Riva del Garda Airbnb Market Analysis 2025: Short Term Rental Data & Vacation Rental Statistics in Trentino – Alto Adige/Südtirol, Italy
Is Airbnb profitable in Riva del Garda in 2025? Explore comprehensive Airbnb analytics for Riva del Garda, Trentino – Alto Adige/Südtirol, Italy to uncover income potential. This 2025 STR market report for Riva del Garda, based on AirROI data from April 2024 to March 2025, reveals key trends in the market of 526 active listings.
Whether you're considering an Airbnb investment in Riva del Garda, optimizing your existing vacation rental, or exploring rental arbitrage opportunities, understanding the Riva del Garda Airbnb data is crucial. Navigating the high regulation landscape is key to maximizing your short term rental income potential. Let's dive into the specifics.
Key Riva del Garda Airbnb Performance Metrics Overview
Monthly Airbnb Revenue Variations & Income Potential in Riva del Garda (2025)
Understanding the monthly revenue variations for Airbnb listings in Riva del Garda is key to maximizing your short term rental income potential. Seasonality significantly impacts earnings. Our analysis, based on data from the past 12 months, shows that the peak revenue month for STRs in Riva del Garda is typically August, while February often presents the lowest earnings, highlighting opportunities for strategic pricing adjustments during shoulder and low seasons. Explore the typical Airbnb income in Riva del Garda across different performance tiers:
- Best-in-class properties (Top 10%) achieve $4,270+ monthly, often utilizing dynamic pricing and superior guest experiences.
- Strong performing properties (Top 25%) earn $2,942 or more, indicating effective management and desirable locations/amenities.
- Typical properties (Median) generate around $1,878 per month, representing the average market performance.
- Entry-level properties (Bottom 25%) see earnings around $1,072, often with potential for optimization.
Average Monthly Airbnb Earnings Trend in Riva del Garda
Riva del Garda Airbnb Occupancy Rate Trends (2025)
Maximize your bookings by understanding the Riva del Garda STR occupancy trends. Seasonal demand shifts significantly influence how often properties are booked. Typically, Augustsees the highest demand (peak season occupancy), while January experiences the lowest (low season). Effective strategies, like adjusting minimum stays or offering promotions, can boost occupancy during slower periods. Here's how different property tiers perform in Riva del Garda:
- Best-in-class properties (Top 10%) achieve 70%+ occupancy, indicating high desirability and potentially optimized availability.
- Strong performing properties (Top 25%) maintain 56% or higher occupancy, suggesting good market fit and guest satisfaction.
- Typical properties (Median) have an occupancy rate around 38%.
- Entry-level properties (Bottom 25%) average 21% occupancy, potentially facing higher vacancy.
Average Monthly Occupancy Rate Trend in Riva del Garda
Average Daily Rate (ADR) Airbnb Trends in Riva del Garda (2025)
Effective short term rental pricing strategy in Riva del Garda involves understanding monthly ADR fluctuations. The Average Daily Rate (ADR) for Airbnb in Riva del Garda typically peaks in August and dips lowest during February. Leveraging Airbnb dynamic pricing tools or strategies based on this seasonality can significantly boost revenue. Here's a look at the typical nightly rates achieved:
- Best-in-class properties (Top 10%) command rates of $277+ per night, often due to premium features or locations.
- Strong performing properties (Top 25%) achieve nightly rates of $197 or more.
- Typical properties (Median) charge around $152 per night.
- Entry-level properties (Bottom 25%) earn around $117 per night.
Average Daily Rate (ADR) Trend by Month in Riva del Garda
Get Live Riva del Garda Market Intelligence 👇

Explore Real-time Analytics
Airbnb Seasonality Analysis & Trends in Riva del Garda (2025)
Peak Season (August, July, June)
- Revenue averages $3,946 per month
- Occupancy rates average 60.2%
- Daily rates average $197
Shoulder Season
- Revenue averages $2,054 per month
- Occupancy maintains around 36.8%
- Daily rates hold near $174
Low Season (January, February, March)
- Revenue drops to average $980 per month
- Occupancy decreases to average 23.2%
- Daily rates adjust to average $166
Seasonality Insights for Riva del Garda
- The Airbnb seasonality in Riva del Garda shows highly seasonal trends requiring careful strategy. While the sections above show seasonal averages, it's also insightful to look at the extremes:
- During the high season, the absolute peak month showcases Riva del Garda's highest earning potential, with monthly revenues capable of climbing to $4,432, occupancy reaching a high of 67.4%, and ADRs peaking at $203.
- Conversely, the slowest single month of the year, typically falling within the low season, marks the market's lowest point. In this month, revenue might dip to $924, occupancy could drop to 21.1%, and ADRs may adjust down to $163.
- Understanding both the seasonal averages and these monthly peaks and troughs in revenue, occupancy, and ADR is crucial for maximizing your Airbnb profit potential in Riva del Garda.
Seasonal Strategies for Maximizing Profit
- Peak Season: Maximize revenue through premium pricing and potentially longer minimum stays. Ensure high availability.
- Low Season: Offer competitive pricing, special promotions (e.g., extended stay discounts), and flexible cancellation policies. Target off-season travelers like remote workers or budget-conscious guests.
- Shoulder Seasons: Implement dynamic pricing that balances peak and low rates. Target weekend travelers or specific events. Offer slightly more flexible terms than peak season.
- Regularly analyze your own performance against these Riva del Garda seasonality benchmarks and adjust your pricing and availability strategy accordingly.
Best Areas for Airbnb Investment in Riva del Garda (2025)
Exploring the top neighborhoods for short-term rentals in Riva del Garda? This section highlights key areas, outlining why they are attractive for hosts and guests, along with notable local attractions. Consider these locations based on your target guest profile and investment strategy.
| Neighborhood / Area | Why Host Here? (Target Guests & Appeal) | Key Attractions & Landmarks |
|---|---|---|
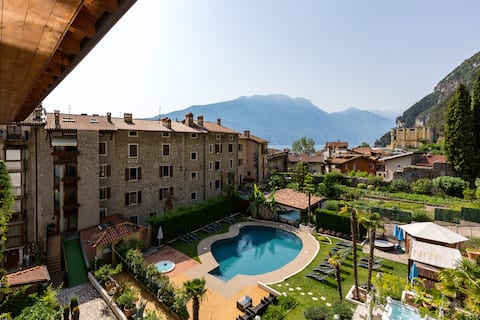
| Lago di Garda | The stunning lake offers beautiful views, outdoor activities, and a romantic setting, making it attractive for tourists seeking relaxation and adventure. | Bicycle path around the lake, Water sports, Boat tours, Villa Melzi, Monte Baldo, Gardaland Amusement Park |
| Old Town (Centro Storico) | The historic center is full of charm, with cobblestone streets, local shops, and restaurants, appealing to tourists looking for local culture. | Piazza 3 Novembre, Torre Apponale, Church of Santa Maria Assunta, Palazzo dei Capitani, Castello di Riva |
| Mount Brione | This area offers hiking trails and panoramic views of the lake, attracting nature lovers and outdoor enthusiasts. | Hiking trails, Cycling paths, Panoramic viewpoints, Nature parks |
| Pini Beach | A popular beach area known for its family-friendly environment and recreational facilities, perfect for tourists with kids. | Water sports rentals, Beachside restaurants, Playgrounds, Lifeguard service, Sun loungers and umbrellas |
| Riva del Garda Forti | Historical fortifications and scenic locations provide a unique backdrop for history buffs and photographers. | Forte di Riva del Garda, Fortress ruins, Historical tours |
| Cascate del Varone | Impressive waterfalls and natural beauty attract visitors interested in wildlife and scenery. | Guided tours, Photography spots, Nature trails |
| Sarche di Calavino | A nearby area known for rock climbing and beautiful landscapes, appealing to adventure travelers. | Climbing spots, Scenic hiking paths, Nature parks |
| Terme di Arco | Famous for its thermal baths, this area attracts wellness tourists looking for relaxation and rejuvenation. | Thermal baths, Wellness centers, Spas, Gardens |
Understanding Airbnb License Requirements & STR Laws in Riva del Garda (2025)
Yes, Riva del Garda, Trentino – Alto Adige/Südtirol, Italy enforces high STR regulations. Obtaining a license and ensuring compliance is almost certainly required according to current 2025 STR laws. Always verify the latest short term rental regulations and Airbnb license requirements directly with local government authorities for Riva del Garda to ensure full compliance before hosting.
(Source: AirROI data, 2025, based on 78% licensed listings)
Top Performing Airbnb Properties in Riva del Garda (2025)
Benchmark your potential! Explore examples of top-performing Airbnb properties in Riva del Gardabased on Trailing Twelve Month (TTM) revenue. Analyze their characteristics, revenue, occupancy rate, and ADR to understand what drives success in this market.
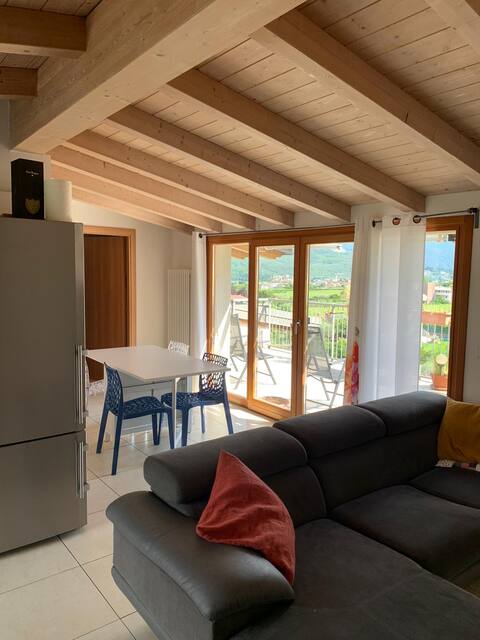
2 bedroom apartment
Entire Place • 2 bedrooms
Attico vista lago
Entire Place • 1 bedroom

1 floor apartment suite with terrace
Entire Place • 3 bedrooms

Casa Internazionale, two APARTMENTS with a garden
Entire Place • 4 bedrooms
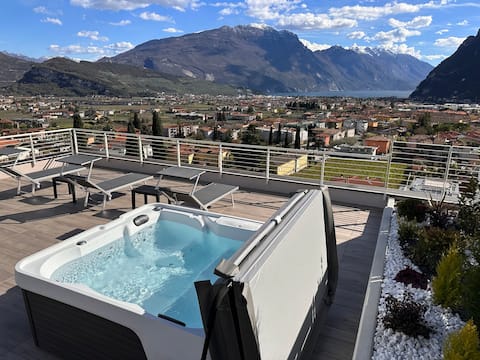
Attico Sky Lake Holiday - Luxury Apartment
Entire Place • 2 bedrooms
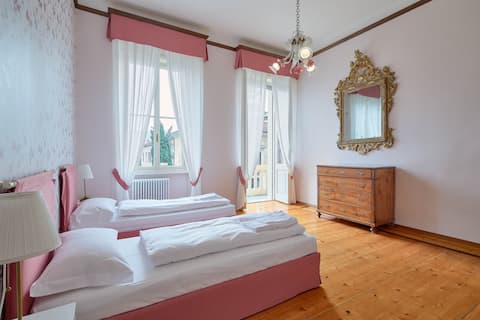
Unique 4 bedrooms apartment in Liberty style villa
Entire Place • 4 bedrooms
Note: Performance varies based on location, size, amenities, seasonality, and management quality. Data reflects the past 12 months.
Top Performing Airbnb Hosts in Riva del Garda (2025)
Learn from the best! This table showcases top-performing Airbnb hosts in Riva del Garda based on the number of properties managed and estimated total revenue over the past year. Analyze their scale and performance metrics.
| Host Name | Properties | Grossing Revenue | Stay Reviews | Avg Rating |
|---|---|---|---|---|
| Thomas | 65 | $1,202,822 | 674 | 3.40/5.0 |
| 1Dest | 42 | $1,091,463 | 2597 | 4.50/5.0 |
| Garda Host | 23 | $673,905 | 511 | 4.79/5.0 |
| Sabrina | 7 | $231,083 | 29 | 3.62/5.0 |
| Rafael | 7 | $199,598 | 147 | 4.93/5.0 |
| Alex | 5 | $192,093 | 133 | 3.93/5.0 |
| Sara E Maretta | 7 | $188,109 | 47 | 4.94/5.0 |
| Davide | 6 | $177,247 | 20 | 1.64/5.0 |
| Giulia | 4 | $174,758 | 124 | 4.94/5.0 |
| Anna | 5 | $155,948 | 417 | 4.96/5.0 |
Analyzing the strategies of top hosts, such as their property selection, pricing, and guest communication, can offer valuable lessons for optimizing your own Airbnb operations in Riva del Garda.
Dive Deeper: Advanced Riva del Garda STR Market Data (2025)
Ready to unlock more insights? AirROI provides access to advanced metrics and comprehensive Airbnb data for Riva del Garda. Explore detailed analytics beyond this report to refine your investment strategy, optimize pricing, and maximize your vacation rental profits.
Explore Advanced MetricsRiva del Garda Short-Term Rental Market Composition (2025): Property & Room Types
Room Type Distribution
Property Type Distribution
Market Composition Insights for Riva del Garda
- The Riva del Garda Airbnb market composition is heavily skewed towards Entire Home/Apt listings, which make up 96.8% of the 526 active rentals. This indicates strong guest preference for privacy and space.
- Looking at the property type distribution in Riva del Garda, Apartment/Condo properties are the most common (88.2%), reflecting the local real estate landscape.
- Smaller segments like hotel/boutique, unique stays, others (combined 2.7%) offer potential for unique stay experiences.
Riva del Garda Airbnb Room Capacity Analysis (2025): Bedroom Distribution
Distribution of Listings by Number of Bedrooms
Room Capacity Insights for Riva del Garda
- The dominant room capacity in Riva del Garda is 1 bedroom listings, making up 43.2% of the market. This suggests a strong demand for properties suitable for couples or solo travelers.
- Together, 1 bedroom and 2 bedrooms properties represent 83.9% of the active Airbnb listings in Riva del Garda, indicating a high concentration in these sizes.
Riva del Garda Vacation Rental Guest Capacity Trends (2025)
Distribution of Listings by Guest Capacity
Guest Capacity Insights for Riva del Garda
- The most common guest capacity trend in Riva del Garda vacation rentals is listings accommodating 4 guests (41.4%). This suggests the primary traveler segment is likely small families or groups.
- Properties designed for 4 guests and 6 guests dominate the Riva del Garda STR market, accounting for 62.9% of listings.
- 30.6% of properties accommodate 6+ guests, serving the market segment for larger families or group travel in Riva del Garda.
- On average, properties in Riva del Garda are equipped to host 4.5 guests.
Riva del Garda Airbnb Booking Patterns (2025): Available vs. Booked Days
Available Days Distribution
Booked Days Distribution
Booking Pattern Insights for Riva del Garda
- The most common availability pattern in Riva del Garda falls within the 181-270 days range, representing 44.5% of listings. This suggests many properties have significant open periods on their calendars.
- Approximately 85.0% of listings show high availability (181+ days open annually), indicating potential for increased bookings or specific owner usage patterns.
- For booked days, the 91-180 days range is most frequent in Riva del Garda (45.6%), reflecting common guest stay durations or potential owner blocking patterns.
- A notable 16.4% of properties secure long booking periods (181+ days booked per year), highlighting successful long-term rental strategies or significant owner usage.
Riva del Garda Airbnb Minimum Stay Requirements Analysis
Distribution of Listings by Minimum Night Requirement
1 Night
65 listings
12.7% of total
2 Nights
114 listings
22.4% of total
3 Nights
86 listings
16.9% of total
4-6 Nights
64 listings
12.5% of total
7-29 Nights
13 listings
2.5% of total
30+ Nights
168 listings
32.9% of total
Key Insights
- The most prevalent minimum stay requirement in Riva del Garda is 30+ Nights, adopted by 32.9% of listings. This highlights the market's preference for longer commitments.
- A significant segment (32.9%) caters to monthly stays (30+ nights) in Riva del Garda, pointing to opportunities in the extended-stay market.
Recommendations
- Align with the market by considering a 30+ Nights minimum stay, as 32.9% of Riva del Garda hosts use this setting.
- If feasible, allowing 1-night stays, especially midweek or during low season, could capture last-minute bookings, as only 12.7% currently do.
- Explore offering discounts for stays of 30+ nights to attract the 32.9% of the market seeking extended stays.
- Adjust minimum nights based on seasonality – potentially shorter during low season and longer during peak demand periods in Riva del Garda.
Riva del Garda Airbnb Cancellation Policy Trends Analysis (2025)
Super Strict 60 Days
9 listings
1.9% of total
Super Strict 30 Days
81 listings
17.2% of total
Flexible
58 listings
12.3% of total
Moderate
228 listings
48.5% of total
Strict
94 listings
20% of total
Cancellation Policy Insights for Riva del Garda
- The prevailing Airbnb cancellation policy trend in Riva del Garda is Moderate, used by 48.5% of listings.
- There's a relatively balanced mix between guest-friendly (60.8%) and stricter (20.0%) policies, offering choices for different guest needs.
Recommendations for Hosts
- Consider adopting a Moderate policy to align with the 48.5% market standard in Riva del Garda.
- Regularly review your cancellation policy against competitors and market demand shifts in Riva del Garda.
Riva del Garda STR Booking Lead Time Analysis (2025)
Average Booking Lead Time by Month
Booking Lead Time Insights for Riva del Garda
- The overall average booking lead time for vacation rentals in Riva del Garda is 60 days.
- Guests book furthest in advance for stays during July (average 111 days), likely coinciding with peak travel demand or local events.
- The shortest booking windows occur for stays in March (average 33 days), indicating more last-minute travel plans during this time.
- Seasonally, Summer (98 days avg.) sees the longest lead times, while Winter (47 days avg.) has the shortest, reflecting typical travel planning cycles.
Recommendations for Hosts
- Use the overall average lead time (60 days) as a baseline for your pricing and availability strategy in Riva del Garda.
- For July stays, consider implementing length-of-stay discounts or slightly higher rates for bookings made less than 111 days out to capitalize on advance planning.
- Target marketing efforts for the Summer season well in advance (at least 98 days) to capture early planners.
- Monitor your own booking lead times against these Riva del Garda averages to identify opportunities for dynamic pricing adjustments.
Popular & Essential Airbnb Amenities in Riva del Garda (2025)
Amenity Prevalence
Amenity Insights for Riva del Garda
- Essential amenities in Riva del Garda that guests expect include: Kitchen, TV, Wifi. Lacking these (any) could significantly impact bookings.
- Popular amenities like Heating, Hair dryer, Essentials are common but not universal. Offering these can provide a competitive edge.
Recommendations for Hosts
- Ensure your listing includes all essential amenities for Riva del Garda: Kitchen, TV, Wifi.
- Prioritize adding missing essentials: Kitchen, TV, Wifi.
- Consider adding popular differentiators like Heating or Hair dryer to increase appeal.
- Highlight unique or less common amenities you offer (e.g., hot tub, dedicated workspace, EV charger) in your listing description and photos.
- Regularly check competitor amenities in Riva del Garda to stay competitive.
Riva del Garda Airbnb Guest Demographics & Profile Analysis (2025)
Guest Profile Summary for Riva del Garda
- The typical guest profile for Airbnb in Riva del Garda consists of predominantly international visitors (89%), with top international origins including Italy, typically belonging to the Post-2000s (Gen Z/Alpha) group (50%), primarily speaking English or German.
- Domestic travelers account for 10.9% of guests.
- Key international markets include Germany (32.4%) and Italy (10.9%).
- Top languages spoken are English (42.7%) followed by German (19.9%).
- A significant demographic segment is the Post-2000s (Gen Z/Alpha) group, representing 50% of guests.
Recommendations for Hosts
- Focus marketing internationally, particularly towards travelers from Italy.
- Tailor amenities and listing descriptions to appeal to the dominant Post-2000s (Gen Z/Alpha) demographic (e.g., highlight fast WiFi, smart home features, local guides).
- Highlight unique local experiences or amenities relevant to the primary guest profile.
- Consider seasonal promotions aligned with peak travel times for key origin markets.
Nearby Short-Term Rental Market Comparison
How does the Riva del Garda Airbnb market stack up against its neighbors? Compare key performance metrics like average monthly revenue, ADR, and occupancy rates in surrounding areas to understand the broader regional STR landscape.
| Market | Active Properties | Monthly Revenue | Daily Rate | Avg. Occupancy |
|---|---|---|---|---|
| Laglio | 64 | $4,873 | $463.61 | 47% |
| Urtijëi - St. Ulrich in Gröden - Ortisei | 163 | $4,698 | $630.45 | 40% |
| Moos in Passeier - Moso in Passiria | 17 | $4,619 | $547.60 | 27% |
| Brenzone sul Garda | 19 | $4,128 | $335.25 | 52% |
| Portofino | 68 | $4,086 | $454.35 | 44% |
| Sala Comacina | 64 | $3,794 | $400.27 | 50% |
| Bellagio | 373 | $3,630 | $328.26 | 55% |
| Oliveto Lario | 99 | $3,509 | $327.42 | 55% |
| Varenna | 216 | $3,419 | $272.27 | 56% |
| Carate Urio | 71 | $3,379 | $331.90 | 44% |