Nago-Torbole Airbnb Market Analysis 2025: Short Term Rental Data & Vacation Rental Statistics in Trentino – Alto Adige/Südtirol, Italy
Is Airbnb profitable in Nago-Torbole in 2025? Explore comprehensive Airbnb analytics for Nago-Torbole, Trentino – Alto Adige/Südtirol, Italy to uncover income potential. This 2025 STR market report for Nago-Torbole, based on AirROI data from April 2024 to March 2025, reveals key trends in the niche market of 172 active listings.
Whether you're considering an Airbnb investment in Nago-Torbole, optimizing your existing vacation rental, or exploring rental arbitrage opportunities, understanding the Nago-Torbole Airbnb data is crucial. Navigating the high regulation landscape is key to maximizing your short term rental income potential. Let's dive into the specifics.
Key Nago-Torbole Airbnb Performance Metrics Overview
Monthly Airbnb Revenue Variations & Income Potential in Nago-Torbole (2025)
Understanding the monthly revenue variations for Airbnb listings in Nago-Torbole is key to maximizing your short term rental income potential. Seasonality significantly impacts earnings. Our analysis, based on data from the past 12 months, shows that the peak revenue month for STRs in Nago-Torbole is typically July, while February often presents the lowest earnings, highlighting opportunities for strategic pricing adjustments during shoulder and low seasons. Explore the typical Airbnb income in Nago-Torbole across different performance tiers:
- Best-in-class properties (Top 10%) achieve $3,872+ monthly, often utilizing dynamic pricing and superior guest experiences.
- Strong performing properties (Top 25%) earn $2,791 or more, indicating effective management and desirable locations/amenities.
- Typical properties (Median) generate around $1,657 per month, representing the average market performance.
- Entry-level properties (Bottom 25%) see earnings around $894, often with potential for optimization.
Average Monthly Airbnb Earnings Trend in Nago-Torbole
Nago-Torbole Airbnb Occupancy Rate Trends (2025)
Maximize your bookings by understanding the Nago-Torbole STR occupancy trends. Seasonal demand shifts significantly influence how often properties are booked. Typically, Augustsees the highest demand (peak season occupancy), while January experiences the lowest (low season). Effective strategies, like adjusting minimum stays or offering promotions, can boost occupancy during slower periods. Here's how different property tiers perform in Nago-Torbole:
- Best-in-class properties (Top 10%) achieve 67%+ occupancy, indicating high desirability and potentially optimized availability.
- Strong performing properties (Top 25%) maintain 54% or higher occupancy, suggesting good market fit and guest satisfaction.
- Typical properties (Median) have an occupancy rate around 34%.
- Entry-level properties (Bottom 25%) average 18% occupancy, potentially facing higher vacancy.
Average Monthly Occupancy Rate Trend in Nago-Torbole
Average Daily Rate (ADR) Airbnb Trends in Nago-Torbole (2025)
Effective short term rental pricing strategy in Nago-Torbole involves understanding monthly ADR fluctuations. The Average Daily Rate (ADR) for Airbnb in Nago-Torbole typically peaks in July and dips lowest during March. Leveraging Airbnb dynamic pricing tools or strategies based on this seasonality can significantly boost revenue. Here's a look at the typical nightly rates achieved:
- Best-in-class properties (Top 10%) command rates of $262+ per night, often due to premium features or locations.
- Strong performing properties (Top 25%) achieve nightly rates of $195 or more.
- Typical properties (Median) charge around $154 per night.
- Entry-level properties (Bottom 25%) earn around $119 per night.
Average Daily Rate (ADR) Trend by Month in Nago-Torbole
Get Live Nago-Torbole Market Intelligence 👇

Explore Real-time Analytics
Airbnb Seasonality Analysis & Trends in Nago-Torbole (2025)
Peak Season (July, August, June)
- Revenue averages $3,573 per month
- Occupancy rates average 58.9%
- Daily rates average $183
Shoulder Season
- Revenue averages $1,876 per month
- Occupancy maintains around 35.2%
- Daily rates hold near $169
Low Season (January, February, March)
- Revenue drops to average $822 per month
- Occupancy decreases to average 18.5%
- Daily rates adjust to average $162
Seasonality Insights for Nago-Torbole
- The Airbnb seasonality in Nago-Torbole shows highly seasonal trends requiring careful strategy. While the sections above show seasonal averages, it's also insightful to look at the extremes:
- During the high season, the absolute peak month showcases Nago-Torbole's highest earning potential, with monthly revenues capable of climbing to $3,928, occupancy reaching a high of 65.5%, and ADRs peaking at $186.
- Conversely, the slowest single month of the year, typically falling within the low season, marks the market's lowest point. In this month, revenue might dip to $667, occupancy could drop to 15.0%, and ADRs may adjust down to $158.
- Understanding both the seasonal averages and these monthly peaks and troughs in revenue, occupancy, and ADR is crucial for maximizing your Airbnb profit potential in Nago-Torbole.
Seasonal Strategies for Maximizing Profit
- Peak Season: Maximize revenue through premium pricing and potentially longer minimum stays. Ensure high availability.
- Low Season: Offer competitive pricing, special promotions (e.g., extended stay discounts), and flexible cancellation policies. Target off-season travelers like remote workers or budget-conscious guests.
- Shoulder Seasons: Implement dynamic pricing that balances peak and low rates. Target weekend travelers or specific events. Offer slightly more flexible terms than peak season.
- Regularly analyze your own performance against these Nago-Torbole seasonality benchmarks and adjust your pricing and availability strategy accordingly.
Best Areas for Airbnb Investment in Nago-Torbole (2025)
Exploring the top neighborhoods for short-term rentals in Nago-Torbole? This section highlights key areas, outlining why they are attractive for hosts and guests, along with notable local attractions. Consider these locations based on your target guest profile and investment strategy.
| Neighborhood / Area | Why Host Here? (Target Guests & Appeal) | Key Attractions & Landmarks |
|---|---|---|
| Tremosine | Famous for its breathtaking views from high cliffs above Lake Garda. Ideal for those looking for adventure and stunning scenery. | Strada della Forra, scenic viewpoints, local hiking paths, taste local cheese, explore nature |
Understanding Airbnb License Requirements & STR Laws in Nago-Torbole (2025)
Yes, Nago-Torbole, Trentino – Alto Adige/Südtirol, Italy enforces high STR regulations. Obtaining a license and ensuring compliance is almost certainly required according to current 2025 STR laws. Always verify the latest short term rental regulations and Airbnb license requirements directly with local government authorities for Nago-Torbole to ensure full compliance before hosting.
(Source: AirROI data, 2025, based on 78% licensed listings)
Top Performing Airbnb Properties in Nago-Torbole (2025)
Benchmark your potential! Explore examples of top-performing Airbnb properties in Nago-Torbolebased on Trailing Twelve Month (TTM) revenue. Analyze their characteristics, revenue, occupancy rate, and ADR to understand what drives success in this market.

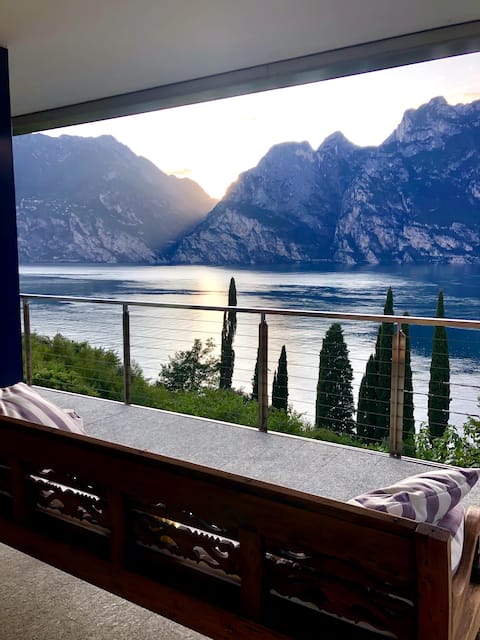
La Terrazza del Lago, with breathtaking views
Entire Place • 2 bedrooms
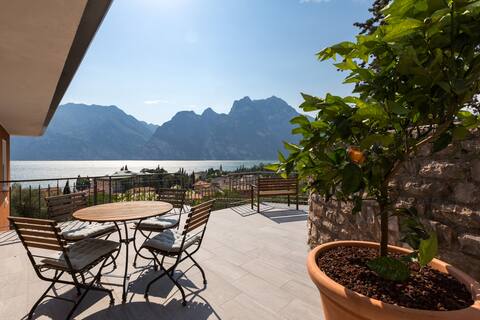
"LA VISTA" Villa with Mozzafiato view
Entire Place • 2 bedrooms
The WINDOW - Villa Fiore - CIPAT 022124-AT-566770
Entire Place • 2 bedrooms

Attico Bellavista Lake view
Entire Place • 1 bedroom
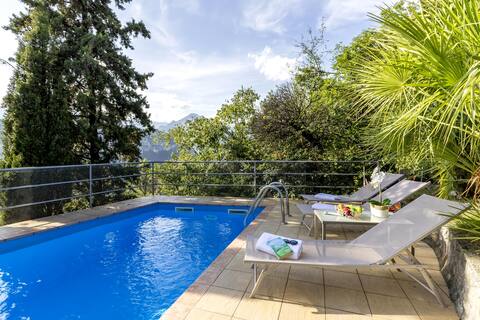
Villa Panorama with private pool - Happy.Rentals
Entire Place • 3 bedrooms
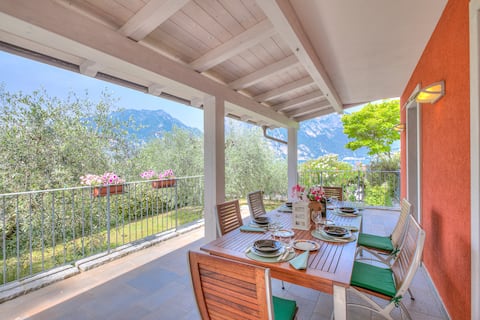
Villa Il Paradiso Di Gabri - Happy.Rentals
Entire Place • 3 bedrooms
Note: Performance varies based on location, size, amenities, seasonality, and management quality. Data reflects the past 12 months.
Top Performing Airbnb Hosts in Nago-Torbole (2025)
Learn from the best! This table showcases top-performing Airbnb hosts in Nago-Torbole based on the number of properties managed and estimated total revenue over the past year. Analyze their scale and performance metrics.
| Host Name | Properties | Grossing Revenue | Stay Reviews | Avg Rating |
|---|---|---|---|---|
| Thomas | 23 | $395,982 | 133 | 2.85/5.0 |
| Garda Host | 11 | $291,426 | 384 | 4.84/5.0 |
| Mario | 4 | $152,691 | 77 | 3.70/5.0 |
| Andrea | 6 | $151,786 | 90 | 4.97/5.0 |
| Maurizio | 4 | $130,914 | 176 | 4.94/5.0 |
| Anita | 6 | $115,126 | 165 | 4.72/5.0 |
| Andrea | 5 | $95,244 | 105 | 4.65/5.0 |
| Matteo | 7 | $90,258 | 149 | 4.64/5.0 |
| Vasco | 5 | $89,727 | 19 | 3.87/5.0 |
| Helen | 1 | $83,250 | 26 | 4.96/5.0 |
Analyzing the strategies of top hosts, such as their property selection, pricing, and guest communication, can offer valuable lessons for optimizing your own Airbnb operations in Nago-Torbole.
Dive Deeper: Advanced Nago-Torbole STR Market Data (2025)
Ready to unlock more insights? AirROI provides access to advanced metrics and comprehensive Airbnb data for Nago-Torbole. Explore detailed analytics beyond this report to refine your investment strategy, optimize pricing, and maximize your vacation rental profits.
Explore Advanced MetricsNago-Torbole Short-Term Rental Market Composition (2025): Property & Room Types
Room Type Distribution
Property Type Distribution
Market Composition Insights for Nago-Torbole
- The Nago-Torbole Airbnb market composition is heavily skewed towards Entire Home/Apt listings, which make up 87.2% of the 172 active rentals. This indicates strong guest preference for privacy and space.
- Looking at the property type distribution in Nago-Torbole, Apartment/Condo properties are the most common (79.1%), reflecting the local real estate landscape.
- The presence of 8.7% Hotel/Boutique listings indicates integration with traditional hospitality.
- Smaller segments like others (combined 0.6%) offer potential for unique stay experiences.
Nago-Torbole Airbnb Room Capacity Analysis (2025): Bedroom Distribution
Distribution of Listings by Number of Bedrooms
Room Capacity Insights for Nago-Torbole
- The dominant room capacity in Nago-Torbole is 1 bedroom listings, making up 42.4% of the market. This suggests a strong demand for properties suitable for couples or solo travelers.
- Together, 1 bedroom and 2 bedrooms properties represent 84.3% of the active Airbnb listings in Nago-Torbole, indicating a high concentration in these sizes.
- Listings with 3+ bedrooms (9.8%) represent a smaller niche, potentially indicating an underserved market for larger group accommodations in Nago-Torbole.
Nago-Torbole Vacation Rental Guest Capacity Trends (2025)
Distribution of Listings by Guest Capacity
Guest Capacity Insights for Nago-Torbole
- The most common guest capacity trend in Nago-Torbole vacation rentals is listings accommodating 4 guests (34.9%). This suggests the primary traveler segment is likely small families or groups.
- Properties designed for 4 guests and 6 guests dominate the Nago-Torbole STR market, accounting for 55.8% of listings.
- 24.9% of properties accommodate 6+ guests, serving the market segment for larger families or group travel in Nago-Torbole.
- On average, properties in Nago-Torbole are equipped to host 4.2 guests.
Nago-Torbole Airbnb Booking Patterns (2025): Available vs. Booked Days
Available Days Distribution
Booked Days Distribution
Booking Pattern Insights for Nago-Torbole
- The most common availability pattern in Nago-Torbole falls within the 271-366 days range, representing 46.5% of listings. This suggests many properties have significant open periods on their calendars.
- Approximately 90.1% of listings show high availability (181+ days open annually), indicating potential for increased bookings or specific owner usage patterns.
- For booked days, the 91-180 days range is most frequent in Nago-Torbole (44.2%), reflecting common guest stay durations or potential owner blocking patterns.
- A notable 11.7% of properties secure long booking periods (181+ days booked per year), highlighting successful long-term rental strategies or significant owner usage.
Nago-Torbole Airbnb Minimum Stay Requirements Analysis
Distribution of Listings by Minimum Night Requirement
1 Night
27 listings
16% of total
2 Nights
39 listings
23.1% of total
3 Nights
36 listings
21.3% of total
4-6 Nights
19 listings
11.2% of total
7-29 Nights
8 listings
4.7% of total
30+ Nights
40 listings
23.7% of total
Key Insights
- The most prevalent minimum stay requirement in Nago-Torbole is 30+ Nights, adopted by 23.7% of listings. This highlights the market's preference for longer commitments.
- A significant segment (23.7%) caters to monthly stays (30+ nights) in Nago-Torbole, pointing to opportunities in the extended-stay market.
Recommendations
- Align with the market by considering a 30+ Nights minimum stay, as 23.7% of Nago-Torbole hosts use this setting.
- If feasible, allowing 1-night stays, especially midweek or during low season, could capture last-minute bookings, as only 16% currently do.
- Explore offering discounts for stays of 30+ nights to attract the 23.7% of the market seeking extended stays.
- Adjust minimum nights based on seasonality – potentially shorter during low season and longer during peak demand periods in Nago-Torbole.
Nago-Torbole Airbnb Cancellation Policy Trends Analysis (2025)
Super Strict 30 Days
16 listings
11% of total
Flexible
7 listings
4.8% of total
Moderate
63 listings
43.4% of total
Strict
59 listings
40.7% of total
Cancellation Policy Insights for Nago-Torbole
- The prevailing Airbnb cancellation policy trend in Nago-Torbole is Moderate, used by 43.4% of listings.
- There's a relatively balanced mix between guest-friendly (48.2%) and stricter (40.7%) policies, offering choices for different guest needs.
Recommendations for Hosts
- Consider adopting a Moderate policy to align with the 43.4% market standard in Nago-Torbole.
- With 40.7% using Strict terms, this is a viable option in Nago-Torbole, particularly for high-value properties or during peak demand periods.
- Regularly review your cancellation policy against competitors and market demand shifts in Nago-Torbole.
Nago-Torbole STR Booking Lead Time Analysis (2025)
Average Booking Lead Time by Month
Booking Lead Time Insights for Nago-Torbole
- The overall average booking lead time for vacation rentals in Nago-Torbole is 76 days.
- Guests book furthest in advance for stays during August (average 121 days), likely coinciding with peak travel demand or local events.
- The shortest booking windows occur for stays in February (average 43 days), indicating more last-minute travel plans during this time.
- Seasonally, Summer (110 days avg.) sees the longest lead times, while Winter (46 days avg.) has the shortest, reflecting typical travel planning cycles.
Recommendations for Hosts
- Use the overall average lead time (76 days) as a baseline for your pricing and availability strategy in Nago-Torbole.
- For August stays, consider implementing length-of-stay discounts or slightly higher rates for bookings made less than 121 days out to capitalize on advance planning.
- Target marketing efforts for the Summer season well in advance (at least 110 days) to capture early planners.
- Monitor your own booking lead times against these Nago-Torbole averages to identify opportunities for dynamic pricing adjustments.
Popular & Essential Airbnb Amenities in Nago-Torbole (2025)
Amenity Prevalence
Amenity Insights for Nago-Torbole
- Essential amenities in Nago-Torbole that guests expect include: Heating. Lacking these (this) could significantly impact bookings.
- Popular amenities like Kitchen, TV, Wifi are common but not universal. Offering these can provide a competitive edge.
- Warning: Wifi is not universally provided but is considered essential globally. Ensure reliable Wifi is offered.
Recommendations for Hosts
- Ensure your listing includes all essential amenities for Nago-Torbole: Heating.
- Prioritize adding missing essentials: Heating.
- Consider adding popular differentiators like Kitchen or TV to increase appeal.
- Highlight unique or less common amenities you offer (e.g., hot tub, dedicated workspace, EV charger) in your listing description and photos.
- Regularly check competitor amenities in Nago-Torbole to stay competitive.
Nago-Torbole Airbnb Guest Demographics & Profile Analysis (2025)
Guest Profile Summary for Nago-Torbole
- The typical guest profile for Airbnb in Nago-Torbole consists of predominantly international visitors (92%), with top international origins including Italy, typically belonging to the Post-2000s (Gen Z/Alpha) group (50%), primarily speaking English or German.
- Domestic travelers account for 8.4% of guests.
- Key international markets include Germany (39.1%) and Italy (8.4%).
- Top languages spoken are English (41.9%) followed by German (21.7%).
- A significant demographic segment is the Post-2000s (Gen Z/Alpha) group, representing 50% of guests.
Recommendations for Hosts
- Focus marketing internationally, particularly towards travelers from Italy.
- Tailor amenities and listing descriptions to appeal to the dominant Post-2000s (Gen Z/Alpha) demographic (e.g., highlight fast WiFi, smart home features, local guides).
- Highlight unique local experiences or amenities relevant to the primary guest profile.
- Consider seasonal promotions aligned with peak travel times for key origin markets.
Nearby Short-Term Rental Market Comparison
How does the Nago-Torbole Airbnb market stack up against its neighbors? Compare key performance metrics like average monthly revenue, ADR, and occupancy rates in surrounding areas to understand the broader regional STR landscape.
| Market | Active Properties | Monthly Revenue | Daily Rate | Avg. Occupancy |
|---|---|---|---|---|
| Laglio | 64 | $4,873 | $463.61 | 47% |
| Urtijëi - St. Ulrich in Gröden - Ortisei | 163 | $4,698 | $630.45 | 40% |
| Moos in Passeier - Moso in Passiria | 17 | $4,619 | $547.60 | 27% |
| Brenzone sul Garda | 19 | $4,128 | $335.25 | 52% |
| Portofino | 68 | $4,086 | $454.35 | 44% |
| Sala Comacina | 64 | $3,794 | $400.27 | 50% |
| Bellagio | 373 | $3,630 | $328.26 | 55% |
| Oliveto Lario | 99 | $3,509 | $327.42 | 55% |
| Varenna | 216 | $3,419 | $272.27 | 56% |
| Carate Urio | 71 | $3,379 | $331.90 | 44% |