Cavedago Airbnb Market Analysis 2025: Short Term Rental Data & Vacation Rental Statistics in Trentino – Alto Adige/Südtirol, Italy
Is Airbnb profitable in Cavedago in 2025? Explore comprehensive Airbnb analytics for Cavedago, Trentino – Alto Adige/Südtirol, Italy to uncover income potential. This 2025 STR market report for Cavedago, based on AirROI data from April 2024 to March 2025, reveals key trends in the niche market of 18 active listings.
Whether you're considering an Airbnb investment in Cavedago, optimizing your existing vacation rental, or exploring rental arbitrage opportunities, understanding the Cavedago Airbnb data is crucial. Navigating the high regulation landscape is key to maximizing your short term rental income potential. Let's dive into the specifics.
Key Cavedago Airbnb Performance Metrics Overview
Monthly Airbnb Revenue Variations & Income Potential in Cavedago (2025)
Understanding the monthly revenue variations for Airbnb listings in Cavedago is key to maximizing your short term rental income potential. Seasonality significantly impacts earnings. Our analysis, based on data from the past 12 months, shows that the peak revenue month for STRs in Cavedago is typically August, while October often presents the lowest earnings, highlighting opportunities for strategic pricing adjustments during shoulder and low seasons. Explore the typical Airbnb income in Cavedago across different performance tiers:
- Best-in-class properties (Top 10%) achieve $4,106+ monthly, often utilizing dynamic pricing and superior guest experiences.
- Strong performing properties (Top 25%) earn $2,368 or more, indicating effective management and desirable locations/amenities.
- Typical properties (Median) generate around $1,129 per month, representing the average market performance.
- Entry-level properties (Bottom 25%) see earnings around $584, often with potential for optimization.
Average Monthly Airbnb Earnings Trend in Cavedago
Cavedago Airbnb Occupancy Rate Trends (2025)
Maximize your bookings by understanding the Cavedago STR occupancy trends. Seasonal demand shifts significantly influence how often properties are booked. Typically, Augustsees the highest demand (peak season occupancy), while May experiences the lowest (low season). Effective strategies, like adjusting minimum stays or offering promotions, can boost occupancy during slower periods. Here's how different property tiers perform in Cavedago:
- Best-in-class properties (Top 10%) achieve 74%+ occupancy, indicating high desirability and potentially optimized availability.
- Strong performing properties (Top 25%) maintain 47% or higher occupancy, suggesting good market fit and guest satisfaction.
- Typical properties (Median) have an occupancy rate around 20%.
- Entry-level properties (Bottom 25%) average 10% occupancy, potentially facing higher vacancy.
Average Monthly Occupancy Rate Trend in Cavedago
Average Daily Rate (ADR) Airbnb Trends in Cavedago (2025)
Effective short term rental pricing strategy in Cavedago involves understanding monthly ADR fluctuations. The Average Daily Rate (ADR) for Airbnb in Cavedago typically peaks in December and dips lowest during September. Leveraging Airbnb dynamic pricing tools or strategies based on this seasonality can significantly boost revenue. Here's a look at the typical nightly rates achieved:
- Best-in-class properties (Top 10%) command rates of $304+ per night, often due to premium features or locations.
- Strong performing properties (Top 25%) achieve nightly rates of $209 or more.
- Typical properties (Median) charge around $155 per night.
- Entry-level properties (Bottom 25%) earn around $119 per night.
Average Daily Rate (ADR) Trend by Month in Cavedago
Get Live Cavedago Market Intelligence 👇

Explore Real-time Analytics
Airbnb Seasonality Analysis & Trends in Cavedago (2025)
Peak Season (August, June, December)
- Revenue averages $2,784 per month
- Occupancy rates average 38.7%
- Daily rates average $180
Shoulder Season
- Revenue averages $1,705 per month
- Occupancy maintains around 29.7%
- Daily rates hold near $178
Low Season (March, May, October)
- Revenue drops to average $935 per month
- Occupancy decreases to average 19.5%
- Daily rates adjust to average $173
Seasonality Insights for Cavedago
- The Airbnb seasonality in Cavedago shows highly seasonal trends requiring careful strategy. While the sections above show seasonal averages, it's also insightful to look at the extremes:
- During the high season, the absolute peak month showcases Cavedago's highest earning potential, with monthly revenues capable of climbing to $3,171, occupancy reaching a high of 53.5%, and ADRs peaking at $203.
- Conversely, the slowest single month of the year, typically falling within the low season, marks the market's lowest point. In this month, revenue might dip to $788, occupancy could drop to 15.6%, and ADRs may adjust down to $159.
- Understanding both the seasonal averages and these monthly peaks and troughs in revenue, occupancy, and ADR is crucial for maximizing your Airbnb profit potential in Cavedago.
Seasonal Strategies for Maximizing Profit
- Peak Season: Maximize revenue through premium pricing and potentially longer minimum stays. Ensure high availability.
- Low Season: Offer competitive pricing, special promotions (e.g., extended stay discounts), and flexible cancellation policies. Target off-season travelers like remote workers or budget-conscious guests.
- Shoulder Seasons: Implement dynamic pricing that balances peak and low rates. Target weekend travelers or specific events. Offer slightly more flexible terms than peak season.
- Regularly analyze your own performance against these Cavedago seasonality benchmarks and adjust your pricing and availability strategy accordingly.
Best Areas for Airbnb Investment in Cavedago (2025)
Exploring the top neighborhoods for short-term rentals in Cavedago? This section highlights key areas, outlining why they are attractive for hosts and guests, along with notable local attractions. Consider these locations based on your target guest profile and investment strategy.
| Neighborhood / Area | Why Host Here? (Target Guests & Appeal) | Key Attractions & Landmarks |
|---|---|---|
| Cavedago Village | A cozy village surrounded by nature, perfect for tourists looking to escape into the Dolomites. Cavedago offers tranquility and access to hiking trails, making it an attractive location for nature lovers. | Paganella Ski Area, Hiking Trails, Local Farms, Cavedago Lake, Dolomiti di Brenta |
| Andalo | This nearby town is a popular ski destination in winter and offers beautiful summer landscapes. Its lively atmosphere and family-friendly activities make it ideal for attracting tourists year-round. | Andalo Ski Resort, Adventure Park, Lake Andalo, Wellness Centers, Pedro Park |
| Fai della Paganella | A charming town that serves as a great base for skiing and mountain biking. Its close proximity to natural parks and its family-oriented facilities attract a diverse range of guests. | Paganella Park, Ski Slopes, Mountain Biking Trails, Natural Parks, Playgrounds |
| Molveno | Famous for its stunning lake and scenic beauty, Molveno draws visitors for both summer and winter sports. The picturesque landscape and excellent amenities assure a steady flow of guests. | Lake Molveno, Molveno Ski Area, Hiking Trails, Natural Park Adamello Brenta, Local Cuisine |
| Lago di Tovel | Known for its unique red lake, this location is a favorite for hikers and nature lovers. The serene environment and breathtaking views make it a prime spot for unique Airbnb listings. | Tovel Lake, Hiking Trails, Brenta Dolomites, Scenic Views, Nature Photography |
| San Lorenzo in Banale | This quaint village offers traditional Italian charm and is near the stunning Brenta Dolomites. Tourists come for cultural experiences and outdoor activities. | Brenta Dolomites, Local Festivals, Historic Churches, Hiking Routes, Traditional Food |
| Spormaggiore | A lesser-known destination that offers a peaceful retreat with rich flora and fauna. Ideal for nature-focused tourists looking for a quiet getaway. | Natural Reserves, Hiking Paths, Wildlife Watching, Mountain Views, Picnic Areas |
| Mezzolombardo | A vibrant town with easy access to Trentino's wine country. This area attracts wine lovers and tourists looking to explore local vineyards and enjoy culinary tours. | Wine Vineyards, La Strada del Vino, Historic Downtown, Piazza Della Libertà, Cultural Events |
Understanding Airbnb License Requirements & STR Laws in Cavedago (2025)
Yes, Cavedago, Trentino – Alto Adige/Südtirol, Italy enforces high STR regulations. Obtaining a license and ensuring compliance is almost certainly required according to current 2025 STR laws. Always verify the latest short term rental regulations and Airbnb license requirements directly with local government authorities for Cavedago to ensure full compliance before hosting.
(Source: AirROI data, 2025, based on 67% licensed listings)
Top Performing Airbnb Properties in Cavedago (2025)
Benchmark your potential! Explore examples of top-performing Airbnb properties in Cavedagobased on Trailing Twelve Month (TTM) revenue. Analyze their characteristics, revenue, occupancy rate, and ADR to understand what drives success in this market.

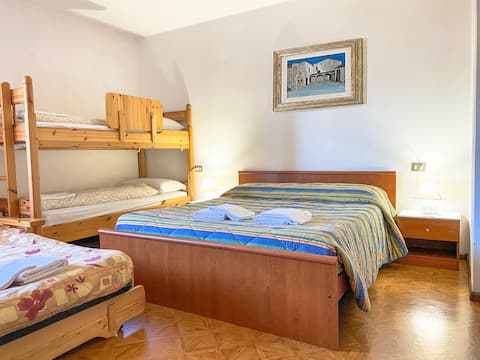
Large rustic house
Entire Place • 3 bedrooms
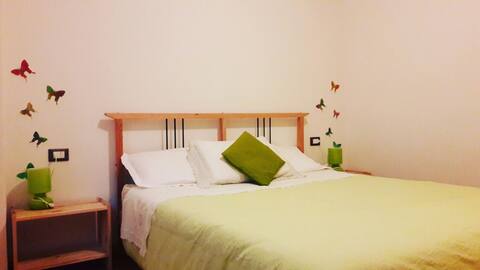
Appartamento con balcone in Dolomiti Paganella
Entire Place • 3 bedrooms
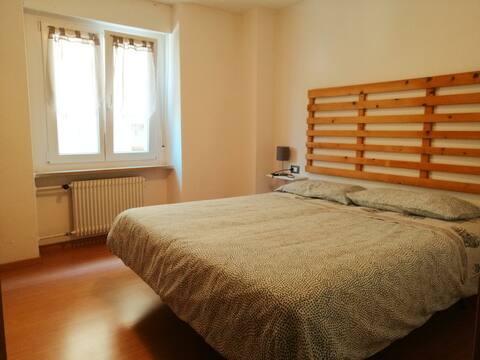
Immersed in the Dolomites
Entire Place • 3 bedrooms
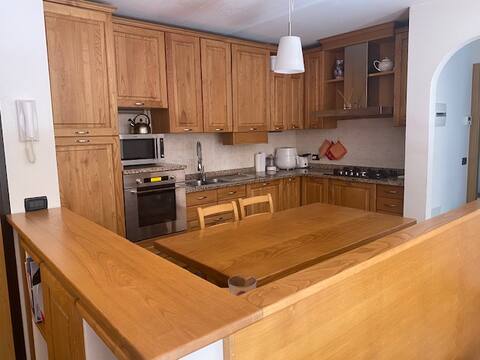
RELAXING IN THE DOLOMITES
Entire Place • 3 bedrooms
Cavedago / Andalo with garden
Entire Place • 2 bedrooms
time in the Dolomites
Entire Place • 2 bedrooms
Note: Performance varies based on location, size, amenities, seasonality, and management quality. Data reflects the past 12 months.
Top Performing Airbnb Hosts in Cavedago (2025)
Learn from the best! This table showcases top-performing Airbnb hosts in Cavedago based on the number of properties managed and estimated total revenue over the past year. Analyze their scale and performance metrics.
| Host Name | Properties | Grossing Revenue | Stay Reviews | Avg Rating |
|---|---|---|---|---|
| Lodovica Sofia | 1 | $61,008 | 15 | 4.87/5.0 |
| Stefano | 3 | $56,352 | 92 | 4.80/5.0 |
| Host #481395682 | 2 | $42,540 | 5 | 2.50/5.0 |
| Alessandro | 4 | $34,557 | 26 | 4.84/5.0 |
| David | 3 | $19,562 | 9 | 1.63/5.0 |
| Massimo | 2 | $18,409 | 35 | 4.97/5.0 |
| Laura | 1 | $17,809 | 11 | 4.73/5.0 |
| Annalisa | 1 | $7,987 | 6 | 4.83/5.0 |
| Host #483402579 | 1 | $1,364 | 1 | 0.00/5.0 |
Analyzing the strategies of top hosts, such as their property selection, pricing, and guest communication, can offer valuable lessons for optimizing your own Airbnb operations in Cavedago.
Dive Deeper: Advanced Cavedago STR Market Data (2025)
Ready to unlock more insights? AirROI provides access to advanced metrics and comprehensive Airbnb data for Cavedago. Explore detailed analytics beyond this report to refine your investment strategy, optimize pricing, and maximize your vacation rental profits.
Explore Advanced MetricsCavedago Short-Term Rental Market Composition (2025): Property & Room Types
Room Type Distribution
Property Type Distribution
Market Composition Insights for Cavedago
- The Cavedago Airbnb market composition is heavily skewed towards Entire Home/Apt listings, which make up 100% of the 18 active rentals. This indicates strong guest preference for privacy and space.
- Looking at the property type distribution in Cavedago, Apartment/Condo properties are the most common (83.3%), reflecting the local real estate landscape.
- Houses represent a significant 16.7% portion, catering likely to families or larger groups.
Cavedago Airbnb Room Capacity Analysis (2025): Bedroom Distribution
Distribution of Listings by Number of Bedrooms
Room Capacity Insights for Cavedago
- The dominant room capacity in Cavedago is 2 bedrooms listings, making up 61.1% of the market. This suggests a strong demand for properties suitable for couples or solo travelers.
- Together, 2 bedrooms and 3 bedrooms properties represent 83.3% of the active Airbnb listings in Cavedago, indicating a high concentration in these sizes.
- A significant 22.2% of listings offer 3+ bedrooms, catering to larger groups and families seeking more space in Cavedago.
Cavedago Vacation Rental Guest Capacity Trends (2025)
Distribution of Listings by Guest Capacity
Guest Capacity Insights for Cavedago
- The most common guest capacity trend in Cavedago vacation rentals is listings accommodating 6 guests (50%). This suggests the primary traveler segment is likely larger groups.
- Properties designed for 6 guests and 4 guests dominate the Cavedago STR market, accounting for 77.8% of listings.
- 55.6% of properties accommodate 6+ guests, serving the market segment for larger families or group travel in Cavedago.
- On average, properties in Cavedago are equipped to host 5.1 guests.
Cavedago Airbnb Booking Patterns (2025): Available vs. Booked Days
Available Days Distribution
Booked Days Distribution
Booking Pattern Insights for Cavedago
- The most common availability pattern in Cavedago falls within the 271-366 days range, representing 72.2% of listings. This suggests many properties have significant open periods on their calendars.
- Approximately 94.4% of listings show high availability (181+ days open annually), indicating potential for increased bookings or specific owner usage patterns.
- For booked days, the 31-90 days range is most frequent in Cavedago (44.4%), reflecting common guest stay durations or potential owner blocking patterns.
- A notable 5.6% of properties secure long booking periods (181+ days booked per year), highlighting successful long-term rental strategies or significant owner usage.
Cavedago Airbnb Minimum Stay Requirements Analysis
Distribution of Listings by Minimum Night Requirement
2 Nights
1 listings
5.6% of total
3 Nights
7 listings
38.9% of total
4-6 Nights
2 listings
11.1% of total
7-29 Nights
3 listings
16.7% of total
30+ Nights
5 listings
27.8% of total
Key Insights
- The most prevalent minimum stay requirement in Cavedago is 3 Nights, adopted by 38.9% of listings. This highlights the market's preference for longer commitments.
- Very short stays (1-2 nights) are less common (5.6%), suggesting hosts prefer slightly longer bookings to optimize turnover.
- A significant segment (27.8%) caters to monthly stays (30+ nights) in Cavedago, pointing to opportunities in the extended-stay market.
Recommendations
- Align with the market by considering a 3 Nights minimum stay, as 38.9% of Cavedago hosts use this setting.
- Explore offering discounts for stays of 30+ nights to attract the 27.8% of the market seeking extended stays.
- Adjust minimum nights based on seasonality – potentially shorter during low season and longer during peak demand periods in Cavedago.
Cavedago Airbnb Cancellation Policy Trends Analysis (2025)
Flexible
1 listings
7.7% of total
Moderate
8 listings
61.5% of total
Strict
4 listings
30.8% of total
Cancellation Policy Insights for Cavedago
- The prevailing Airbnb cancellation policy trend in Cavedago is Moderate, used by 61.5% of listings.
- There's a relatively balanced mix between guest-friendly (69.2%) and stricter (30.8%) policies, offering choices for different guest needs.
Recommendations for Hosts
- Consider adopting a Moderate policy to align with the 61.5% market standard in Cavedago.
- With 30.8% using Strict terms, this is a viable option in Cavedago, particularly for high-value properties or during peak demand periods.
- Regularly review your cancellation policy against competitors and market demand shifts in Cavedago.
Cavedago STR Booking Lead Time Analysis (2025)
Average Booking Lead Time by Month
Booking Lead Time Insights for Cavedago
- The overall average booking lead time for vacation rentals in Cavedago is 65 days.
- Guests book furthest in advance for stays during July (average 108 days), likely coinciding with peak travel demand or local events.
- The shortest booking windows occur for stays in April (average 9 days), indicating more last-minute travel plans during this time.
- Seasonally, Summer (85 days avg.) sees the longest lead times, while Fall (30 days avg.) has the shortest, reflecting typical travel planning cycles.
Recommendations for Hosts
- Use the overall average lead time (65 days) as a baseline for your pricing and availability strategy in Cavedago.
- For July stays, consider implementing length-of-stay discounts or slightly higher rates for bookings made less than 108 days out to capitalize on advance planning.
- During April, focus on last-minute booking availability and promotions, as guests book with very short notice (9 days avg.).
- Target marketing efforts for the Summer season well in advance (at least 85 days) to capture early planners.
- Monitor your own booking lead times against these Cavedago averages to identify opportunities for dynamic pricing adjustments.
Popular & Essential Airbnb Amenities in Cavedago (2025)
Amenity Prevalence
Amenity Insights for Cavedago
- Essential amenities in Cavedago that guests expect include: Washer, Free parking on premises, TV. Lacking these (any) could significantly impact bookings.
- Popular amenities like Dishes and silverware, Heating, Hangers are common but not universal. Offering these can provide a competitive edge.
- Warning: Wifi is not universally provided but is considered essential globally. Ensure reliable Wifi is offered.
Recommendations for Hosts
- Ensure your listing includes all essential amenities for Cavedago: Washer, Free parking on premises, TV.
- Consider adding popular differentiators like Dishes and silverware or Heating to increase appeal.
- Highlight unique or less common amenities you offer (e.g., hot tub, dedicated workspace, EV charger) in your listing description and photos.
- Regularly check competitor amenities in Cavedago to stay competitive.
Cavedago Airbnb Guest Demographics & Profile Analysis (2025)
Guest Profile Summary for Cavedago
- The typical guest profile for Airbnb in Cavedago consists of a mix of domestic (41%) and international guests, with top international origins including Germany, typically belonging to the Post-2000s (Gen Z/Alpha) group (50%), primarily speaking English or Italian.
- Domestic travelers account for 40.7% of guests.
- Key international markets include Italy (40.7%) and Germany (14.8%).
- Top languages spoken are English (37.9%) followed by Italian (20.7%).
- A significant demographic segment is the Post-2000s (Gen Z/Alpha) group, representing 50% of guests.
Recommendations for Hosts
- Balance marketing efforts between domestic and international channels based on the guest mix.
- Tailor amenities and listing descriptions to appeal to the dominant Post-2000s (Gen Z/Alpha) demographic (e.g., highlight fast WiFi, smart home features, local guides).
- Highlight unique local experiences or amenities relevant to the primary guest profile.
- Consider seasonal promotions aligned with peak travel times for key origin markets.
Nearby Short-Term Rental Market Comparison
How does the Cavedago Airbnb market stack up against its neighbors? Compare key performance metrics like average monthly revenue, ADR, and occupancy rates in surrounding areas to understand the broader regional STR landscape.
| Market | Active Properties | Monthly Revenue | Daily Rate | Avg. Occupancy |
|---|---|---|---|---|
| Bayrischzell | 30 | $4,718 | $392.87 | 42% |
| Urtijëi - St. Ulrich in Gröden - Ortisei | 163 | $4,698 | $630.45 | 40% |
| Moos in Passeier - Moso in Passiria | 17 | $4,619 | $547.60 | 27% |
| Steinberg am Rofan | 11 | $4,394 | $311.71 | 40% |
| Brenzone sul Garda | 19 | $4,128 | $335.25 | 52% |
| Reith bei Kitzbühel | 44 | $3,766 | $308.69 | 45% |
| Pfafflar | 10 | $3,559 | $263.33 | 58% |
| Cortina d'Ampezzo | 265 | $3,522 | $379.53 | 43% |
| Venice | 6,405 | $3,454 | $238.80 | 53% |
| Wiesing | 16 | $3,222 | $208.10 | 52% |