Cavalese Airbnb Market Analysis 2025: Short Term Rental Data & Vacation Rental Statistics in Trentino – Alto Adige/Südtirol, Italy
Is Airbnb profitable in Cavalese in 2025? Explore comprehensive Airbnb analytics for Cavalese, Trentino – Alto Adige/Südtirol, Italy to uncover income potential. This 2025 STR market report for Cavalese, based on AirROI data from April 2024 to March 2025, reveals key trends in the niche market of 77 active listings.
Whether you're considering an Airbnb investment in Cavalese, optimizing your existing vacation rental, or exploring rental arbitrage opportunities, understanding the Cavalese Airbnb data is crucial. Navigating the high regulation landscape is key to maximizing your short term rental income potential. Let's dive into the specifics.
Key Cavalese Airbnb Performance Metrics Overview
Monthly Airbnb Revenue Variations & Income Potential in Cavalese (2025)
Understanding the monthly revenue variations for Airbnb listings in Cavalese is key to maximizing your short term rental income potential. Seasonality significantly impacts earnings. Our analysis, based on data from the past 12 months, shows that the peak revenue month for STRs in Cavalese is typically August, while November often presents the lowest earnings, highlighting opportunities for strategic pricing adjustments during shoulder and low seasons. Explore the typical Airbnb income in Cavalese across different performance tiers:
- Best-in-class properties (Top 10%) achieve $4,353+ monthly, often utilizing dynamic pricing and superior guest experiences.
- Strong performing properties (Top 25%) earn $2,966 or more, indicating effective management and desirable locations/amenities.
- Typical properties (Median) generate around $1,833 per month, representing the average market performance.
- Entry-level properties (Bottom 25%) see earnings around $1,118, often with potential for optimization.
Average Monthly Airbnb Earnings Trend in Cavalese
Cavalese Airbnb Occupancy Rate Trends (2025)
Maximize your bookings by understanding the Cavalese STR occupancy trends. Seasonal demand shifts significantly influence how often properties are booked. Typically, Augustsees the highest demand (peak season occupancy), while October experiences the lowest (low season). Effective strategies, like adjusting minimum stays or offering promotions, can boost occupancy during slower periods. Here's how different property tiers perform in Cavalese:
- Best-in-class properties (Top 10%) achieve 76%+ occupancy, indicating high desirability and potentially optimized availability.
- Strong performing properties (Top 25%) maintain 59% or higher occupancy, suggesting good market fit and guest satisfaction.
- Typical properties (Median) have an occupancy rate around 37%.
- Entry-level properties (Bottom 25%) average 19% occupancy, potentially facing higher vacancy.
Average Monthly Occupancy Rate Trend in Cavalese
Average Daily Rate (ADR) Airbnb Trends in Cavalese (2025)
Effective short term rental pricing strategy in Cavalese involves understanding monthly ADR fluctuations. The Average Daily Rate (ADR) for Airbnb in Cavalese typically peaks in February and dips lowest during May. Leveraging Airbnb dynamic pricing tools or strategies based on this seasonality can significantly boost revenue. Here's a look at the typical nightly rates achieved:
- Best-in-class properties (Top 10%) command rates of $318+ per night, often due to premium features or locations.
- Strong performing properties (Top 25%) achieve nightly rates of $223 or more.
- Typical properties (Median) charge around $167 per night.
- Entry-level properties (Bottom 25%) earn around $127 per night.
Average Daily Rate (ADR) Trend by Month in Cavalese
Get Live Cavalese Market Intelligence 👇

Explore Real-time Analytics
Airbnb Seasonality Analysis & Trends in Cavalese (2025)
Peak Season (August, February, July)
- Revenue averages $3,262 per month
- Occupancy rates average 56.4%
- Daily rates average $197
Shoulder Season
- Revenue averages $2,220 per month
- Occupancy maintains around 39.1%
- Daily rates hold near $194
Low Season (April, October, November)
- Revenue drops to average $1,337 per month
- Occupancy decreases to average 27.2%
- Daily rates adjust to average $178
Seasonality Insights for Cavalese
- The Airbnb seasonality in Cavalese shows highly seasonal trends requiring careful strategy. While the sections above show seasonal averages, it's also insightful to look at the extremes:
- During the high season, the absolute peak month showcases Cavalese's highest earning potential, with monthly revenues capable of climbing to $3,672, occupancy reaching a high of 63.1%, and ADRs peaking at $223.
- Conversely, the slowest single month of the year, typically falling within the low season, marks the market's lowest point. In this month, revenue might dip to $1,241, occupancy could drop to 26.7%, and ADRs may adjust down to $169.
- Understanding both the seasonal averages and these monthly peaks and troughs in revenue, occupancy, and ADR is crucial for maximizing your Airbnb profit potential in Cavalese.
Seasonal Strategies for Maximizing Profit
- Peak Season: Maximize revenue through premium pricing and potentially longer minimum stays. Ensure high availability.
- Low Season: Offer competitive pricing, special promotions (e.g., extended stay discounts), and flexible cancellation policies. Target off-season travelers like remote workers or budget-conscious guests.
- Shoulder Seasons: Implement dynamic pricing that balances peak and low rates. Target weekend travelers or specific events. Offer slightly more flexible terms than peak season.
- Regularly analyze your own performance against these Cavalese seasonality benchmarks and adjust your pricing and availability strategy accordingly.
Best Areas for Airbnb Investment in Cavalese (2025)
Exploring the top neighborhoods for short-term rentals in Cavalese? This section highlights key areas, outlining why they are attractive for hosts and guests, along with notable local attractions. Consider these locations based on your target guest profile and investment strategy.
| Neighborhood / Area | Why Host Here? (Target Guests & Appeal) | Key Attractions & Landmarks |
|---|---|---|
| Cavalese Town Center | The heart of Cavalese, offering local shopping, dining, and access to ski lifts. Ideal for travelers seeking a central location to explore attractions and enjoy vibrant Italian culture. | Cavalese's Historic Centre, Cavalese Railway Station, Church of San Sebastiano, Cavalese Park, Pista di pattinaggio di Cavalese |
| Alpe Cermis | A popular skiing area with breathtaking mountain views, attracting winter sports enthusiasts. Offers year-round activities from skiing to hiking, making it a prime location for active travelers. | Alpe Cermis Ski Area, Cermis Gondola, Hiking Trails, Mountain Bike Trails, Scenic Viewpoints |
| Val di Fiemme | Known for its natural beauty and outdoor activities, Val di Fiemme is perfect for nature lovers and families. Offers a range of winter sports and summer hiking opportunities. | Fiemme Valley, Natural Parks, Ski Resorts, Hiking Paths, Local Fauna and Flora |
| Lake Cresta | A serene spot for relaxation and outdoor activities. Appeals to visitors seeking tranquility and scenic beauty, ideal for summer getaways and nature enthusiasts. | Lake Cresta, Picnic Areas, Hiking Trails, Fishing Spots, Nature Walks |
| Predazzo | Close to ski resorts and known for its charming alpine style, Predazzo attracts visitors looking for a quaint mountain experience with easy access to outdoor activities. | Predazzo Town Square, Ski Areas, Dolomites Hiking, Local Restaurants, Historical Sites |
| Bellamonte | A picturesque village offering a mix of tradition and outdoor leisure activities, great for families and weekend retreats. Known for its beautiful landscapes and cultural festivals. | Bellamonte Church, Skiing, Local Cuisine, Forest Walks, Festivals |
| Stava | A small hamlet that provides a quiet getaway, perfect for visitors looking to escape the hustle and enjoy the tranquility of the mountains while being close to other key attractions. | Stava Cable Car, Natural Landscapes, Hiking Trails, Local Farms, Cultural Heritage |
| Tesero | A charming village with access to the Val di Fiemme ski area, it's ideal for families and outdoor lovers. Offers a combination of cultural experiences and adventure activities. | Tesero Town Square, Sportanlagen Tesero, Ski Resorts, Festival Events, Cultural Heritage Sites |
Understanding Airbnb License Requirements & STR Laws in Cavalese (2025)
Yes, Cavalese, Trentino – Alto Adige/Südtirol, Italy enforces high STR regulations. Obtaining a license and ensuring compliance is almost certainly required according to current 2025 STR laws. Always verify the latest short term rental regulations and Airbnb license requirements directly with local government authorities for Cavalese to ensure full compliance before hosting.
(Source: AirROI data, 2025, based on 66% licensed listings)
Top Performing Airbnb Properties in Cavalese (2025)
Benchmark your potential! Explore examples of top-performing Airbnb properties in Cavalesebased on Trailing Twelve Month (TTM) revenue. Analyze their characteristics, revenue, occupancy rate, and ADR to understand what drives success in this market.
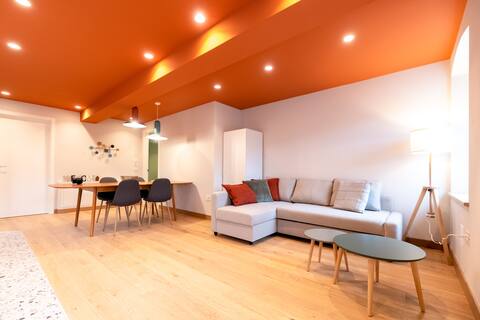
Le Rais apartment
Entire Place • 2 bedrooms
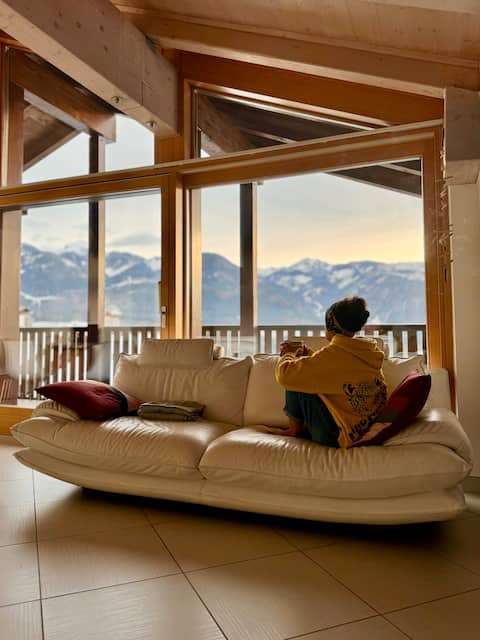
Attic La Cueva
Entire Place • 2 bedrooms

Casa Yara - Cavalese Superior Apartment
Entire Place • 3 bedrooms

Maso Gretel
Entire Place • 2 bedrooms
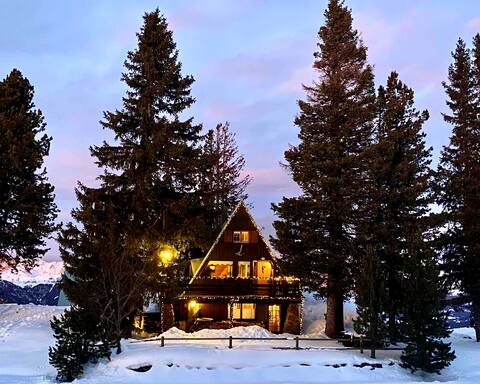
Chalet Cermis
Entire Place • 2 bedrooms
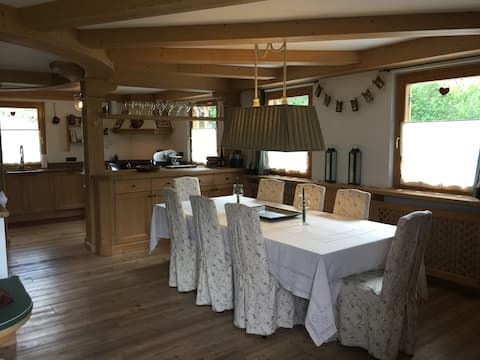
Chalet Masi Dolomites
Entire Place • 3 bedrooms
Note: Performance varies based on location, size, amenities, seasonality, and management quality. Data reflects the past 12 months.
Top Performing Airbnb Hosts in Cavalese (2025)
Learn from the best! This table showcases top-performing Airbnb hosts in Cavalese based on the number of properties managed and estimated total revenue over the past year. Analyze their scale and performance metrics.
| Host Name | Properties | Grossing Revenue | Stay Reviews | Avg Rating |
|---|---|---|---|---|
| Thomas | 13 | $168,209 | 161 | 3.36/5.0 |
| 𝕕𝕠𝕝𝕠𝕞𝕚𝕥𝕚𝕒𝕗𝕗𝕚𝕥𝕥𝕚 | 4 | $109,436 | 17 | 3.71/5.0 |
| Host #59324618 | 7 | $75,909 | 0 | 0.00/5.0 |
| Federico | 1 | $48,614 | 17 | 4.71/5.0 |
| Barbara | 1 | $47,134 | 18 | 4.89/5.0 |
| Michela | 2 | $43,847 | 26 | 4.95/5.0 |
| Andrea | 1 | $41,758 | 61 | 4.82/5.0 |
| Giovanni | 2 | $39,919 | 168 | 4.77/5.0 |
| Patrizia | 1 | $31,924 | 13 | 4.85/5.0 |
| Tiziana | 1 | $31,469 | 20 | 4.95/5.0 |
Analyzing the strategies of top hosts, such as their property selection, pricing, and guest communication, can offer valuable lessons for optimizing your own Airbnb operations in Cavalese.
Dive Deeper: Advanced Cavalese STR Market Data (2025)
Ready to unlock more insights? AirROI provides access to advanced metrics and comprehensive Airbnb data for Cavalese. Explore detailed analytics beyond this report to refine your investment strategy, optimize pricing, and maximize your vacation rental profits.
Explore Advanced MetricsCavalese Short-Term Rental Market Composition (2025): Property & Room Types
Room Type Distribution
Property Type Distribution
Market Composition Insights for Cavalese
- The Cavalese Airbnb market composition is heavily skewed towards Entire Home/Apt listings, which make up 90.9% of the 77 active rentals. This indicates strong guest preference for privacy and space.
- Looking at the property type distribution in Cavalese, Apartment/Condo properties are the most common (72.7%), reflecting the local real estate landscape.
- The presence of 7.8% Hotel/Boutique listings indicates integration with traditional hospitality.
- Smaller segments like others (combined 1.3%) offer potential for unique stay experiences.
Cavalese Airbnb Room Capacity Analysis (2025): Bedroom Distribution
Distribution of Listings by Number of Bedrooms
Room Capacity Insights for Cavalese
- The dominant room capacity in Cavalese is 2 bedrooms listings, making up 45.5% of the market. This suggests a strong demand for properties suitable for couples or solo travelers.
- Together, 2 bedrooms and 3 bedrooms properties represent 71.5% of the active Airbnb listings in Cavalese, indicating a high concentration in these sizes.
- A significant 29.9% of listings offer 3+ bedrooms, catering to larger groups and families seeking more space in Cavalese.
Cavalese Vacation Rental Guest Capacity Trends (2025)
Distribution of Listings by Guest Capacity
Guest Capacity Insights for Cavalese
- The most common guest capacity trend in Cavalese vacation rentals is listings accommodating 4 guests (32.5%). This suggests the primary traveler segment is likely small families or groups.
- Properties designed for 4 guests and 6 guests dominate the Cavalese STR market, accounting for 59.8% of listings.
- 45.5% of properties accommodate 6+ guests, serving the market segment for larger families or group travel in Cavalese.
- On average, properties in Cavalese are equipped to host 5.1 guests.
Cavalese Airbnb Booking Patterns (2025): Available vs. Booked Days
Available Days Distribution
Booked Days Distribution
Booking Pattern Insights for Cavalese
- The most common availability pattern in Cavalese falls within the 271-366 days range, representing 51.9% of listings. This suggests many properties have significant open periods on their calendars.
- Approximately 84.4% of listings show high availability (181+ days open annually), indicating potential for increased bookings or specific owner usage patterns.
- For booked days, the 31-90 days range is most frequent in Cavalese (37.7%), reflecting common guest stay durations or potential owner blocking patterns.
- A notable 16.9% of properties secure long booking periods (181+ days booked per year), highlighting successful long-term rental strategies or significant owner usage.
Cavalese Airbnb Minimum Stay Requirements Analysis
Distribution of Listings by Minimum Night Requirement
1 Night
5 listings
6.6% of total
2 Nights
9 listings
11.8% of total
3 Nights
8 listings
10.5% of total
4-6 Nights
19 listings
25% of total
7-29 Nights
16 listings
21.1% of total
30+ Nights
19 listings
25% of total
Key Insights
- The most prevalent minimum stay requirement in Cavalese is 4-6 Nights, adopted by 25% of listings. This highlights the market's preference for longer commitments.
- Very short stays (1-2 nights) are less common (18.4%), suggesting hosts prefer slightly longer bookings to optimize turnover.
- A significant segment (25%) caters to monthly stays (30+ nights) in Cavalese, pointing to opportunities in the extended-stay market.
Recommendations
- Align with the market by considering a 4-6 Nights minimum stay, as 25% of Cavalese hosts use this setting.
- If feasible, allowing 1-night stays, especially midweek or during low season, could capture last-minute bookings, as only 6.6% currently do.
- Explore offering discounts for stays of 30+ nights to attract the 25% of the market seeking extended stays.
- Adjust minimum nights based on seasonality – potentially shorter during low season and longer during peak demand periods in Cavalese.
Cavalese Airbnb Cancellation Policy Trends Analysis (2025)
Super Strict 30 Days
3 listings
5.2% of total
Flexible
6 listings
10.3% of total
Moderate
26 listings
44.8% of total
Strict
23 listings
39.7% of total
Cancellation Policy Insights for Cavalese
- The prevailing Airbnb cancellation policy trend in Cavalese is Moderate, used by 44.8% of listings.
- There's a relatively balanced mix between guest-friendly (55.1%) and stricter (39.7%) policies, offering choices for different guest needs.
Recommendations for Hosts
- Consider adopting a Moderate policy to align with the 44.8% market standard in Cavalese.
- With 39.7% using Strict terms, this is a viable option in Cavalese, particularly for high-value properties or during peak demand periods.
- Regularly review your cancellation policy against competitors and market demand shifts in Cavalese.
Cavalese STR Booking Lead Time Analysis (2025)
Average Booking Lead Time by Month
Booking Lead Time Insights for Cavalese
- The overall average booking lead time for vacation rentals in Cavalese is 60 days.
- Guests book furthest in advance for stays during August (average 96 days), likely coinciding with peak travel demand or local events.
- The shortest booking windows occur for stays in October (average 38 days), indicating more last-minute travel plans during this time.
- Seasonally, Summer (84 days avg.) sees the longest lead times, while Fall (46 days avg.) has the shortest, reflecting typical travel planning cycles.
Recommendations for Hosts
- Use the overall average lead time (60 days) as a baseline for your pricing and availability strategy in Cavalese.
- For August stays, consider implementing length-of-stay discounts or slightly higher rates for bookings made less than 96 days out to capitalize on advance planning.
- Target marketing efforts for the Summer season well in advance (at least 84 days) to capture early planners.
- Monitor your own booking lead times against these Cavalese averages to identify opportunities for dynamic pricing adjustments.
Popular & Essential Airbnb Amenities in Cavalese (2025)
Amenity Prevalence
Amenity Insights for Cavalese
- Essential amenities in Cavalese that guests expect include: Heating, TV, Kitchen. Lacking these (any) could significantly impact bookings.
- Popular amenities like Hair dryer, Free parking on premises, Washer are common but not universal. Offering these can provide a competitive edge.
- Warning: Wifi is not universally provided but is considered essential globally. Ensure reliable Wifi is offered.
Recommendations for Hosts
- Ensure your listing includes all essential amenities for Cavalese: Heating, TV, Kitchen.
- Prioritize adding missing essentials: TV, Kitchen.
- Consider adding popular differentiators like Hair dryer or Free parking on premises to increase appeal.
- Highlight unique or less common amenities you offer (e.g., hot tub, dedicated workspace, EV charger) in your listing description and photos.
- Regularly check competitor amenities in Cavalese to stay competitive.
Cavalese Airbnb Guest Demographics & Profile Analysis (2025)
Guest Profile Summary for Cavalese
- The typical guest profile for Airbnb in Cavalese consists of a mix of domestic (51%) and international guests, often arriving from nearby Milan, typically belonging to the Post-2000s (Gen Z/Alpha) group (50%), primarily speaking English or Italian.
- Domestic travelers account for 51.4% of guests.
- Key international markets include Italy (51.4%) and Germany (11%).
- Top languages spoken are English (35.9%) followed by Italian (21.6%).
- A significant demographic segment is the Post-2000s (Gen Z/Alpha) group, representing 50% of guests.
Recommendations for Hosts
- Balance marketing efforts between domestic and international channels based on the guest mix.
- Tailor amenities and listing descriptions to appeal to the dominant Post-2000s (Gen Z/Alpha) demographic (e.g., highlight fast WiFi, smart home features, local guides).
- Highlight unique local experiences or amenities relevant to the primary guest profile.
- Consider seasonal promotions aligned with peak travel times for key origin markets.
Nearby Short-Term Rental Market Comparison
How does the Cavalese Airbnb market stack up against its neighbors? Compare key performance metrics like average monthly revenue, ADR, and occupancy rates in surrounding areas to understand the broader regional STR landscape.
| Market | Active Properties | Monthly Revenue | Daily Rate | Avg. Occupancy |
|---|---|---|---|---|
| Bayrischzell | 30 | $4,718 | $392.87 | 42% |
| Urtijëi - St. Ulrich in Gröden - Ortisei | 163 | $4,698 | $630.45 | 40% |
| Moos in Passeier - Moso in Passiria | 17 | $4,619 | $547.60 | 27% |
| Steinberg am Rofan | 11 | $4,394 | $311.71 | 40% |
| Brenzone sul Garda | 19 | $4,128 | $335.25 | 52% |
| Reith bei Kitzbühel | 44 | $3,766 | $308.69 | 45% |
| Pfafflar | 10 | $3,559 | $263.33 | 58% |
| Cortina d'Ampezzo | 265 | $3,522 | $379.53 | 43% |
| Venice | 6,405 | $3,454 | $238.80 | 53% |
| Wiesing | 16 | $3,222 | $208.10 | 52% |