Tenno Airbnb Market Analysis 2025: Short Term Rental Data & Vacation Rental Statistics in Trentino – Alto Adige/Südtirol, Italy
Is Airbnb profitable in Tenno in 2025? Explore comprehensive Airbnb analytics for Tenno, Trentino – Alto Adige/Südtirol, Italy to uncover income potential. This 2025 STR market report for Tenno, based on AirROI data from April 2024 to March 2025, reveals key trends in the niche market of 70 active listings.
Whether you're considering an Airbnb investment in Tenno, optimizing your existing vacation rental, or exploring rental arbitrage opportunities, understanding the Tenno Airbnb data is crucial. Navigating the high regulation landscape is key to maximizing your short term rental income potential. Let's dive into the specifics.
Key Tenno Airbnb Performance Metrics Overview
Monthly Airbnb Revenue Variations & Income Potential in Tenno (2025)
Understanding the monthly revenue variations for Airbnb listings in Tenno is key to maximizing your short term rental income potential. Seasonality significantly impacts earnings. Our analysis, based on data from the past 12 months, shows that the peak revenue month for STRs in Tenno is typically August, while December often presents the lowest earnings, highlighting opportunities for strategic pricing adjustments during shoulder and low seasons. Explore the typical Airbnb income in Tenno across different performance tiers:
- Best-in-class properties (Top 10%) achieve $4,063+ monthly, often utilizing dynamic pricing and superior guest experiences.
- Strong performing properties (Top 25%) earn $2,545 or more, indicating effective management and desirable locations/amenities.
- Typical properties (Median) generate around $1,569 per month, representing the average market performance.
- Entry-level properties (Bottom 25%) see earnings around $765, often with potential for optimization.
Average Monthly Airbnb Earnings Trend in Tenno
Tenno Airbnb Occupancy Rate Trends (2025)
Maximize your bookings by understanding the Tenno STR occupancy trends. Seasonal demand shifts significantly influence how often properties are booked. Typically, Augustsees the highest demand (peak season occupancy), while December experiences the lowest (low season). Effective strategies, like adjusting minimum stays or offering promotions, can boost occupancy during slower periods. Here's how different property tiers perform in Tenno:
- Best-in-class properties (Top 10%) achieve 75%+ occupancy, indicating high desirability and potentially optimized availability.
- Strong performing properties (Top 25%) maintain 58% or higher occupancy, suggesting good market fit and guest satisfaction.
- Typical properties (Median) have an occupancy rate around 35%.
- Entry-level properties (Bottom 25%) average 15% occupancy, potentially facing higher vacancy.
Average Monthly Occupancy Rate Trend in Tenno
Average Daily Rate (ADR) Airbnb Trends in Tenno (2025)
Effective short term rental pricing strategy in Tenno involves understanding monthly ADR fluctuations. The Average Daily Rate (ADR) for Airbnb in Tenno typically peaks in December and dips lowest during April. Leveraging Airbnb dynamic pricing tools or strategies based on this seasonality can significantly boost revenue. Here's a look at the typical nightly rates achieved:
- Best-in-class properties (Top 10%) command rates of $360+ per night, often due to premium features or locations.
- Strong performing properties (Top 25%) achieve nightly rates of $183 or more.
- Typical properties (Median) charge around $130 per night.
- Entry-level properties (Bottom 25%) earn around $99 per night.
Average Daily Rate (ADR) Trend by Month in Tenno
Get Live Tenno Market Intelligence 👇

Explore Real-time Analytics
Airbnb Seasonality Analysis & Trends in Tenno (2025)
Peak Season (August, July, May)
- Revenue averages $3,007 per month
- Occupancy rates average 53.5%
- Daily rates average $167
Shoulder Season
- Revenue averages $1,925 per month
- Occupancy maintains around 38.7%
- Daily rates hold near $214
Low Season (January, February, December)
- Revenue drops to average $991 per month
- Occupancy decreases to average 23.5%
- Daily rates adjust to average $308
Seasonality Insights for Tenno
- The Airbnb seasonality in Tenno shows highly seasonal trends requiring careful strategy. While the sections above show seasonal averages, it's also insightful to look at the extremes:
- During the high season, the absolute peak month showcases Tenno's highest earning potential, with monthly revenues capable of climbing to $3,151, occupancy reaching a high of 56.9%, and ADRs peaking at $333.
- Conversely, the slowest single month of the year, typically falling within the low season, marks the market's lowest point. In this month, revenue might dip to $934, occupancy could drop to 20.4%, and ADRs may adjust down to $146.
- Understanding both the seasonal averages and these monthly peaks and troughs in revenue, occupancy, and ADR is crucial for maximizing your Airbnb profit potential in Tenno.
Seasonal Strategies for Maximizing Profit
- Peak Season: Maximize revenue through premium pricing and potentially longer minimum stays. Ensure high availability.
- Low Season: Offer competitive pricing, special promotions (e.g., extended stay discounts), and flexible cancellation policies. Target off-season travelers like remote workers or budget-conscious guests.
- Shoulder Seasons: Implement dynamic pricing that balances peak and low rates. Target weekend travelers or specific events. Offer slightly more flexible terms than peak season.
- Regularly analyze your own performance against these Tenno seasonality benchmarks and adjust your pricing and availability strategy accordingly.
Best Areas for Airbnb Investment in Tenno (2025)
Exploring the top neighborhoods for short-term rentals in Tenno? This section highlights key areas, outlining why they are attractive for hosts and guests, along with notable local attractions. Consider these locations based on your target guest profile and investment strategy.
| Neighborhood / Area | Why Host Here? (Target Guests & Appeal) | Key Attractions & Landmarks |
|---|---|---|
| Bolzano | Capital of South Tyrol, known for its blend of Italian and Austrian culture, stunning architecture, and rich history. Attracts visitors year-round for its unique charm and access to the Dolomites. | Ötzi the Iceman Museum, Waltherplatz, Bolzano Cathedral, Castel Roncolo, Parco Petrarca, South Tyrol Museum of Archaeology |
| Merano | Famous spa town renowned for its mild climate and beautiful gardens. A favorite destination for wellness tourism and outdoor activities throughout the year. | Therme Meran, Trauttmansdorff Castle Gardens, Merano's Christmas Market, Passeggiata Tappeiner, La Muta Lake, Historic buildings in the center |
| Ortisei | A picturesque village in the Val Gardena with stunning alpine views. Popular among skiers in winter and hikers in summer, making it a year-round destination. | Seceda, St. Ulrich's Church, Val Gardena ski area, Alpe di Siusi, Museum Gherdeina, Wood carving shops |
| Riva del Garda | Located on the northern shores of Lake Garda, known for its outdoor sports and beautiful lake views. Ideal for tourists looking for both relaxation and adventure. | Old Town, Riva del Garda Fortress, Pini Beach, Cascata del Varone, Bicycle and hiking trails, The Bastion |
| Canazei | A charming village within the Fassa Valley, it's an ideal base for skiing in winter and hiking in summer, attracting outdoor enthusiasts throughout the year. | Sella Ronda, Fassa Valley, Lago di Fedaia, Marmolada, Discovery Park, Piz Boè |
| Laives | A smaller town near Bolzano, offers a quieter experience with beautiful vineyards and accessibility to larger urban amenities. Great for families and couples. | Local vineyards, Monumento ai Caduti, Castel Flavon, Parks and walking paths, Cultural events, Weekly markets |
| Lana | Known for its close proximity to Merano, stunning landscapes, and apple orchards. It combines outdoor activities with a peaceful rural atmosphere. | Knottnkino, Lana's apple orchards, Historical village center, Hiking trails, Local gastronomy, Nearby vineyards |
| Val di Funes | Famous for its amazing landscapes and the iconic Odle mountains, a visual treat for nature lovers. Perfect for tranquility and breathtaking hikes. | Funes Valley, Church of St. John in Ranui, Hiking trails to Odle, The valley’s amazing landscapes, Skiing in winter, Traditional Tyrolean huts |
Understanding Airbnb License Requirements & STR Laws in Tenno (2025)
Yes, Tenno, Trentino – Alto Adige/Südtirol, Italy enforces high STR regulations. Obtaining a license and ensuring compliance is almost certainly required according to current 2025 STR laws. Always verify the latest short term rental regulations and Airbnb license requirements directly with local government authorities for Tenno to ensure full compliance before hosting.
(Source: AirROI data, 2025, based on 66% licensed listings)
Top Performing Airbnb Properties in Tenno (2025)
Benchmark your potential! Explore examples of top-performing Airbnb properties in Tennobased on Trailing Twelve Month (TTM) revenue. Analyze their characteristics, revenue, occupancy rate, and ADR to understand what drives success in this market.
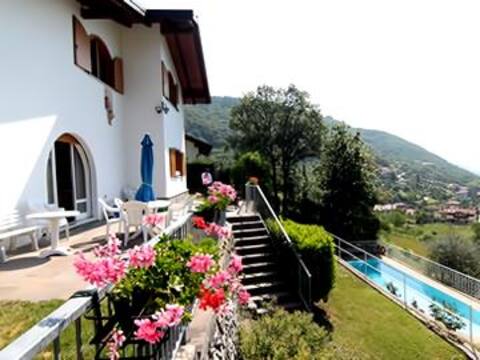
Luxus-Villa with swimmingpool
Entire Place • 3 bedrooms
Villa La Vista
Entire Place • 3 bedrooms

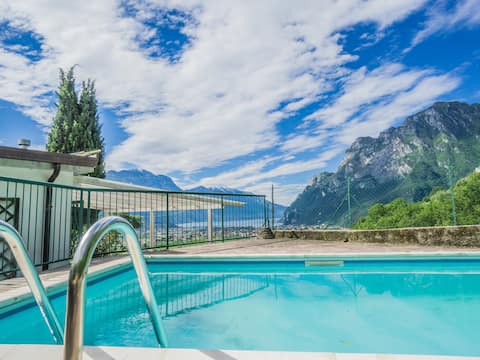
Garden Oasis house - stile moderno WiFi e piscina
Entire Place • 1 bedroom
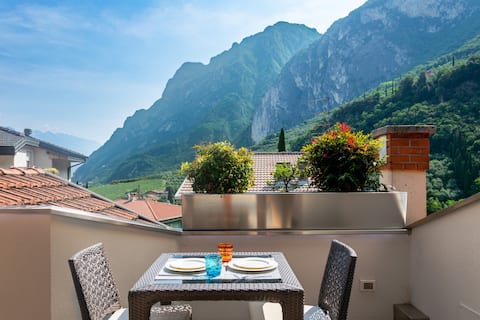
Charming Loft Lake Garda -hot tub & free parking
Entire Place • 1 bedroom

Designer Villa - Amazing View
Entire Place • 4 bedrooms

TSG active and family residence
Entire Place • 2 bedrooms
Note: Performance varies based on location, size, amenities, seasonality, and management quality. Data reflects the past 12 months.
Top Performing Airbnb Hosts in Tenno (2025)
Learn from the best! This table showcases top-performing Airbnb hosts in Tenno based on the number of properties managed and estimated total revenue over the past year. Analyze their scale and performance metrics.
| Host Name | Properties | Grossing Revenue | Stay Reviews | Avg Rating |
|---|---|---|---|---|
| Marco | 3 | $125,527 | 122 | 4.78/5.0 |
| Thomas | 9 | $72,884 | 41 | 1.94/5.0 |
| Eleonora | 3 | $60,822 | 196 | 4.92/5.0 |
| Holidu | 5 | $59,499 | 71 | 3.63/5.0 |
| 1Dest | 2 | $59,340 | 22 | 4.49/5.0 |
| Moritz | 1 | $49,765 | 45 | 4.73/5.0 |
| Alice | 2 | $49,740 | 50 | 4.99/5.0 |
| Roberta | 1 | $43,683 | 17 | 4.94/5.0 |
| Jose Manuel | 1 | $38,953 | 49 | 4.98/5.0 |
| Daniele | 1 | $35,666 | 11 | 5.00/5.0 |
Analyzing the strategies of top hosts, such as their property selection, pricing, and guest communication, can offer valuable lessons for optimizing your own Airbnb operations in Tenno.
Dive Deeper: Advanced Tenno STR Market Data (2025)
Ready to unlock more insights? AirROI provides access to advanced metrics and comprehensive Airbnb data for Tenno. Explore detailed analytics beyond this report to refine your investment strategy, optimize pricing, and maximize your vacation rental profits.
Explore Advanced MetricsTenno Short-Term Rental Market Composition (2025): Property & Room Types
Room Type Distribution
Property Type Distribution
Market Composition Insights for Tenno
- The Tenno Airbnb market composition is heavily skewed towards Entire Home/Apt listings, which make up 94.3% of the 70 active rentals. This indicates strong guest preference for privacy and space.
- Looking at the property type distribution in Tenno, Apartment/Condo properties are the most common (72.9%), reflecting the local real estate landscape.
- Houses represent a significant 22.9% portion, catering likely to families or larger groups.
- Smaller segments like hotel/boutique, outdoor/unique, others (combined 4.2%) offer potential for unique stay experiences.
Tenno Airbnb Room Capacity Analysis (2025): Bedroom Distribution
Distribution of Listings by Number of Bedrooms
Room Capacity Insights for Tenno
- The dominant room capacity in Tenno is 1 bedroom listings, making up 50% of the market. This suggests a strong demand for properties suitable for couples or solo travelers.
- Together, 1 bedroom and 2 bedrooms properties represent 88.6% of the active Airbnb listings in Tenno, indicating a high concentration in these sizes.
- Listings with 3+ bedrooms (8.5%) represent a smaller niche, potentially indicating an underserved market for larger group accommodations in Tenno.
Tenno Vacation Rental Guest Capacity Trends (2025)
Distribution of Listings by Guest Capacity
Guest Capacity Insights for Tenno
- The most common guest capacity trend in Tenno vacation rentals is listings accommodating 4 guests (34.3%). This suggests the primary traveler segment is likely small families or groups.
- Properties designed for 4 guests and 5 guests dominate the Tenno STR market, accounting for 57.2% of listings.
- 18.6% of properties accommodate 6+ guests, serving the market segment for larger families or group travel in Tenno.
- On average, properties in Tenno are equipped to host 4.2 guests.
Tenno Airbnb Booking Patterns (2025): Available vs. Booked Days
Available Days Distribution
Booked Days Distribution
Booking Pattern Insights for Tenno
- The most common availability pattern in Tenno falls within the 271-366 days range, representing 61.4% of listings. This suggests many properties have significant open periods on their calendars.
- Approximately 87.1% of listings show high availability (181+ days open annually), indicating potential for increased bookings or specific owner usage patterns.
- For booked days, the 31-90 days range is most frequent in Tenno (32.9%), reflecting common guest stay durations or potential owner blocking patterns.
- A notable 15.7% of properties secure long booking periods (181+ days booked per year), highlighting successful long-term rental strategies or significant owner usage.
Tenno Airbnb Minimum Stay Requirements Analysis
Distribution of Listings by Minimum Night Requirement
1 Night
23 listings
35.4% of total
2 Nights
2 listings
3.1% of total
3 Nights
16 listings
24.6% of total
4-6 Nights
14 listings
21.5% of total
7-29 Nights
5 listings
7.7% of total
30+ Nights
5 listings
7.7% of total
Key Insights
- The most prevalent minimum stay requirement in Tenno is 1 Night, adopted by 35.4% of listings. This highlights the market's preference for shorter, flexible bookings.
Recommendations
- Align with the market by considering a 1 Night minimum stay, as 35.4% of Tenno hosts use this setting.
- Explore offering discounts for stays of 30+ nights to attract the 7.7% of the market seeking extended stays.
- Adjust minimum nights based on seasonality – potentially shorter during low season and longer during peak demand periods in Tenno.
Tenno Airbnb Cancellation Policy Trends Analysis (2025)
Super Strict 30 Days
4 listings
7.4% of total
Flexible
8 listings
14.8% of total
Moderate
27 listings
50% of total
Strict
15 listings
27.8% of total
Cancellation Policy Insights for Tenno
- The prevailing Airbnb cancellation policy trend in Tenno is Moderate, used by 50% of listings.
- There's a relatively balanced mix between guest-friendly (64.8%) and stricter (27.8%) policies, offering choices for different guest needs.
Recommendations for Hosts
- Consider adopting a Moderate policy to align with the 50% market standard in Tenno.
- Regularly review your cancellation policy against competitors and market demand shifts in Tenno.
Tenno STR Booking Lead Time Analysis (2025)
Average Booking Lead Time by Month
Booking Lead Time Insights for Tenno
- The overall average booking lead time for vacation rentals in Tenno is 65 days.
- Guests book furthest in advance for stays during February (average 127 days), likely coinciding with peak travel demand or local events.
- The shortest booking windows occur for stays in March (average 26 days), indicating more last-minute travel plans during this time.
- Seasonally, Summer (102 days avg.) sees the longest lead times, while Spring (64 days avg.) has the shortest, reflecting typical travel planning cycles.
Recommendations for Hosts
- Use the overall average lead time (65 days) as a baseline for your pricing and availability strategy in Tenno.
- For February stays, consider implementing length-of-stay discounts or slightly higher rates for bookings made less than 127 days out to capitalize on advance planning.
- Target marketing efforts for the Summer season well in advance (at least 102 days) to capture early planners.
- Monitor your own booking lead times against these Tenno averages to identify opportunities for dynamic pricing adjustments.
Popular & Essential Airbnb Amenities in Tenno (2025)
Amenity Prevalence
Amenity Insights for Tenno
- Essential amenities in Tenno that guests expect include: Kitchen. Lacking these (this) could significantly impact bookings.
- Popular amenities like TV, Heating, Essentials are common but not universal. Offering these can provide a competitive edge.
- Warning: Wifi is not universally provided but is considered essential globally. Ensure reliable Wifi is offered.
Recommendations for Hosts
- Ensure your listing includes all essential amenities for Tenno: Kitchen.
- Prioritize adding missing essentials: Kitchen.
- Consider adding popular differentiators like TV or Heating to increase appeal.
- Highlight unique or less common amenities you offer (e.g., hot tub, dedicated workspace, EV charger) in your listing description and photos.
- Regularly check competitor amenities in Tenno to stay competitive.
Tenno Airbnb Guest Demographics & Profile Analysis (2025)
Guest Profile Summary for Tenno
- The typical guest profile for Airbnb in Tenno consists of predominantly international visitors (88%), with top international origins including Italy, typically belonging to the Post-2000s (Gen Z/Alpha) group (50%), primarily speaking English or German.
- Domestic travelers account for 12.3% of guests.
- Key international markets include Germany (46%) and Italy (12.3%).
- Top languages spoken are English (41.6%) followed by German (22.7%).
- A significant demographic segment is the Post-2000s (Gen Z/Alpha) group, representing 50% of guests.
Recommendations for Hosts
- Focus marketing internationally, particularly towards travelers from Italy.
- Tailor amenities and listing descriptions to appeal to the dominant Post-2000s (Gen Z/Alpha) demographic (e.g., highlight fast WiFi, smart home features, local guides).
- Highlight unique local experiences or amenities relevant to the primary guest profile.
- Consider seasonal promotions aligned with peak travel times for key origin markets.
Nearby Short-Term Rental Market Comparison
How does the Tenno Airbnb market stack up against its neighbors? Compare key performance metrics like average monthly revenue, ADR, and occupancy rates in surrounding areas to understand the broader regional STR landscape.
| Market | Active Properties | Monthly Revenue | Daily Rate | Avg. Occupancy |
|---|---|---|---|---|
| Laglio | 64 | $4,873 | $463.61 | 47% |
| Urtijëi - St. Ulrich in Gröden - Ortisei | 163 | $4,698 | $630.45 | 40% |
| Moos in Passeier - Moso in Passiria | 17 | $4,619 | $547.60 | 27% |
| Brenzone sul Garda | 19 | $4,128 | $335.25 | 52% |
| Portofino | 68 | $4,086 | $454.35 | 44% |
| Sala Comacina | 64 | $3,794 | $400.27 | 50% |
| Bellagio | 373 | $3,630 | $328.26 | 55% |
| Oliveto Lario | 99 | $3,509 | $327.42 | 55% |
| Varenna | 216 | $3,419 | $272.27 | 56% |
| Carate Urio | 71 | $3,379 | $331.90 | 44% |