Soraga di Fassa Airbnb Market Analysis 2025: Short Term Rental Data & Vacation Rental Statistics in Trentino – Alto Adige/Südtirol, Italy
Is Airbnb profitable in Soraga di Fassa in 2025? Explore comprehensive Airbnb analytics for Soraga di Fassa, Trentino – Alto Adige/Südtirol, Italy to uncover income potential. This 2025 STR market report for Soraga di Fassa, based on AirROI data from April 2024 to March 2025, reveals key trends in the niche market of 32 active listings.
Whether you're considering an Airbnb investment in Soraga di Fassa, optimizing your existing vacation rental, or exploring rental arbitrage opportunities, understanding the Soraga di Fassa Airbnb data is crucial. Navigating the high regulation landscape is key to maximizing your short term rental income potential. Let's dive into the specifics.
Key Soraga di Fassa Airbnb Performance Metrics Overview
Monthly Airbnb Revenue Variations & Income Potential in Soraga di Fassa (2025)
Understanding the monthly revenue variations for Airbnb listings in Soraga di Fassa is key to maximizing your short term rental income potential. Seasonality significantly impacts earnings. Our analysis, based on data from the past 12 months, shows that the peak revenue month for STRs in Soraga di Fassa is typically August, while March often presents the lowest earnings, highlighting opportunities for strategic pricing adjustments during shoulder and low seasons. Explore the typical Airbnb income in Soraga di Fassa across different performance tiers:
- Best-in-class properties (Top 10%) achieve $3,406+ monthly, often utilizing dynamic pricing and superior guest experiences.
- Strong performing properties (Top 25%) earn $2,576 or more, indicating effective management and desirable locations/amenities.
- Typical properties (Median) generate around $1,590 per month, representing the average market performance.
- Entry-level properties (Bottom 25%) see earnings around $956, often with potential for optimization.
Average Monthly Airbnb Earnings Trend in Soraga di Fassa
Soraga di Fassa Airbnb Occupancy Rate Trends (2025)
Maximize your bookings by understanding the Soraga di Fassa STR occupancy trends. Seasonal demand shifts significantly influence how often properties are booked. Typically, Augustsees the highest demand (peak season occupancy), while March experiences the lowest (low season). Effective strategies, like adjusting minimum stays or offering promotions, can boost occupancy during slower periods. Here's how different property tiers perform in Soraga di Fassa:
- Best-in-class properties (Top 10%) achieve 82%+ occupancy, indicating high desirability and potentially optimized availability.
- Strong performing properties (Top 25%) maintain 71% or higher occupancy, suggesting good market fit and guest satisfaction.
- Typical properties (Median) have an occupancy rate around 42%.
- Entry-level properties (Bottom 25%) average 24% occupancy, potentially facing higher vacancy.
Average Monthly Occupancy Rate Trend in Soraga di Fassa
Average Daily Rate (ADR) Airbnb Trends in Soraga di Fassa (2025)
Effective short term rental pricing strategy in Soraga di Fassa involves understanding monthly ADR fluctuations. The Average Daily Rate (ADR) for Airbnb in Soraga di Fassa typically peaks in August and dips lowest during November. Leveraging Airbnb dynamic pricing tools or strategies based on this seasonality can significantly boost revenue. Here's a look at the typical nightly rates achieved:
- Best-in-class properties (Top 10%) command rates of $231+ per night, often due to premium features or locations.
- Strong performing properties (Top 25%) achieve nightly rates of $175 or more.
- Typical properties (Median) charge around $136 per night.
- Entry-level properties (Bottom 25%) earn around $102 per night.
Average Daily Rate (ADR) Trend by Month in Soraga di Fassa
Get Live Soraga di Fassa Market Intelligence 👇
Explore Real-time Analytics
Airbnb Seasonality Analysis & Trends in Soraga di Fassa (2025)
Peak Season (August, July, February)
- Revenue averages $2,849 per month
- Occupancy rates average 61.7%
- Daily rates average $154
Shoulder Season
- Revenue averages $1,830 per month
- Occupancy maintains around 46.8%
- Daily rates hold near $147
Low Season (March, April, October)
- Revenue drops to average $1,232 per month
- Occupancy decreases to average 34.4%
- Daily rates adjust to average $148
Seasonality Insights for Soraga di Fassa
- The Airbnb seasonality in Soraga di Fassa shows highly seasonal trends requiring careful strategy. While the sections above show seasonal averages, it's also insightful to look at the extremes:
- During the high season, the absolute peak month showcases Soraga di Fassa's highest earning potential, with monthly revenues capable of climbing to $3,601, occupancy reaching a high of 75.7%, and ADRs peaking at $155.
- Conversely, the slowest single month of the year, typically falling within the low season, marks the market's lowest point. In this month, revenue might dip to $1,199, occupancy could drop to 26.0%, and ADRs may adjust down to $140.
- Understanding both the seasonal averages and these monthly peaks and troughs in revenue, occupancy, and ADR is crucial for maximizing your Airbnb profit potential in Soraga di Fassa.
Seasonal Strategies for Maximizing Profit
- Peak Season: Maximize revenue through premium pricing and potentially longer minimum stays. Ensure high availability.
- Low Season: Offer competitive pricing, special promotions (e.g., extended stay discounts), and flexible cancellation policies. Target off-season travelers like remote workers or budget-conscious guests.
- Shoulder Seasons: Implement dynamic pricing that balances peak and low rates. Target weekend travelers or specific events. Offer slightly more flexible terms than peak season.
- Regularly analyze your own performance against these Soraga di Fassa seasonality benchmarks and adjust your pricing and availability strategy accordingly.
Best Areas for Airbnb Investment in Soraga di Fassa (2025)
Exploring the top neighborhoods for short-term rentals in Soraga di Fassa? This section highlights key areas, outlining why they are attractive for hosts and guests, along with notable local attractions. Consider these locations based on your target guest profile and investment strategy.
| Neighborhood / Area | Why Host Here? (Target Guests & Appeal) | Key Attractions & Landmarks |
|---|---|---|
| Fassatal Valley | A stunning valley offering breathtaking views, this area is ideal for tourists seeking adventure sports such as skiing in winter and hiking in summer. Close proximity to the Dolomiti Superski area makes it a prime spot for winter sports enthusiasts. | Sella Ronda, Dolomiti di Braies, Alpe di Siusi, Catinaccio, Ski resorts, Hiking trails |
| San Giovanni di Fassa | This charming village is rich in Ladin culture and tradition, making it attractive for visitors wanting to experience authentic Alpine life. It's a great base for exploring the surrounding mountains. | Ladin Museum, Piz di Segnau, Local festivals, Ski areas, Hiking paths |
| Mazzin di Fassa | A serene village located in the heart of Val di Fassa, Mazzin offers a peaceful retreat for travelers while providing easy access to ski areas and hiking trails. Perfect for family-oriented and nature-loving guests. | Punta Penia, Cascate di Pisoni, Skiing and trekking, Alpine huts and restaurants |
| Canazei | Known for its vibrant après-ski scene and as a hub for ski enthusiasts, Canazei also offers numerous summer outdoor activities, making it a year-round destination. | Belvedere Ski Area, Fassa Valley Bike Paths, Serrai di Sottoguda, Local restaurants and bars |
| Campitello di Fassa | This picturesque town is popular with families and skiers alike, offering a relaxed atmosphere complemented by beautiful landscapes and a variety of outdoor activities, both in winter and summer. | Col Rodella cable car, Ski schools, Hiking trails, Restaurants with local cuisine |
| Vigo di Fassa | A quaint town with stunning views and close connections to the surrounding Dolomites, Vigo is loved for its traditional feel and accessibility to nature. A great place for cultural exploration and outdoor fun. | Catinaccio Mountain, Fassa Valley ski lift, Local crafts and shops, Cultural events |
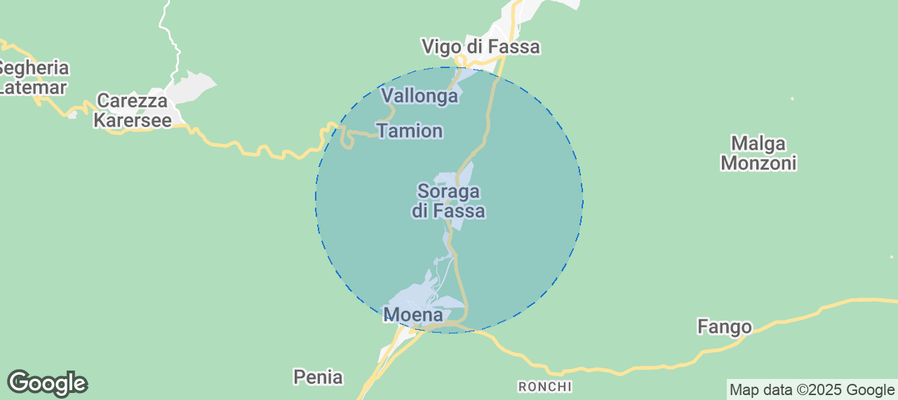
| Soraga | The town of Soraga provides a tranquil setting with quick access to major ski areas and hiking trails, appealing to vacationers looking for a relaxing yet adventurous getaway. | Lago di Soraga, Vigo di Fassa nearby, Outdoor sports, Family-friendly activities |
| Pozza di Fassa | Famous for its hot springs and wellness centers, Pozza di Fassa attracts visitors looking for relaxation and rejuvenation while still being close to nature and adventure sports. | Thermal baths, Ski areas, Val San Nicolo, Dolomites hiking trails |
Understanding Airbnb License Requirements & STR Laws in Soraga di Fassa (2025)
Yes, Soraga di Fassa, Trentino – Alto Adige/Südtirol, Italy enforces high STR regulations. Obtaining a license and ensuring compliance is almost certainly required according to current 2025 STR laws. Always verify the latest short term rental regulations and Airbnb license requirements directly with local government authorities for Soraga di Fassa to ensure full compliance before hosting.
(Source: AirROI data, 2025, based on 69% licensed listings)
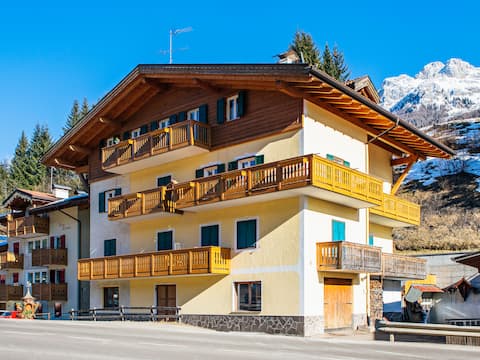
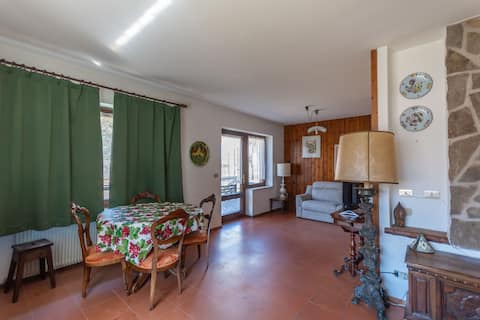
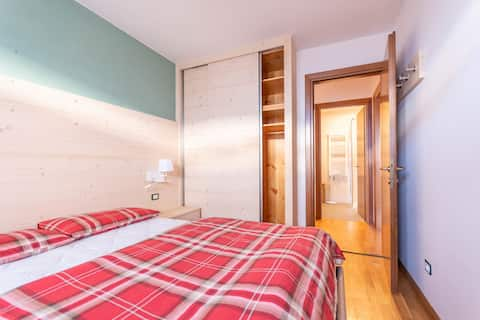
Top Performing Airbnb Properties in Soraga di Fassa (2025)
Benchmark your potential! Explore examples of top-performing Airbnb properties in Soraga di Fassabased on Trailing Twelve Month (TTM) revenue. Analyze their characteristics, revenue, occupancy rate, and ADR to understand what drives success in this market.

Lovely Saslonch apartment, with parking
Entire Place • 2 bedrooms

Charming cabin in the Dolomites
Entire Place • 3 bedrooms
Pederiva (SOF740) by Interhome
Entire Place • 1 bedroom
Casa Iolanda
Entire Place • 3 bedrooms
Casa Piz Meda
Entire Place • 2 bedrooms
Casa Maura
Entire Place • 2 bedrooms
Note: Performance varies based on location, size, amenities, seasonality, and management quality. Data reflects the past 12 months.
Top Performing Airbnb Hosts in Soraga di Fassa (2025)
Learn from the best! This table showcases top-performing Airbnb hosts in Soraga di Fassa based on the number of properties managed and estimated total revenue over the past year. Analyze their scale and performance metrics.
| Host Name | Properties | Grossing Revenue | Stay Reviews | Avg Rating |
|---|---|---|---|---|
| Sergio | 6 | $88,573 | 33 | 2.98/5.0 |
| Laura - Interhome Group | 7 | $63,935 | 41 | 3.38/5.0 |
| Cristina | 5 | $61,619 | 261 | 4.77/5.0 |
| Luigi | 2 | $57,563 | 27 | 4.88/5.0 |
| Sergio | 1 | $32,383 | 66 | 4.82/5.0 |
| Andrea | 2 | $21,057 | 72 | 4.83/5.0 |
| Agatha | 2 | $20,949 | 25 | 4.88/5.0 |
| Daniele | 2 | $18,302 | 86 | 4.82/5.0 |
| Caterina | 1 | $13,785 | 107 | 4.71/5.0 |
| Paolo | 1 | $13,607 | 8 | 4.88/5.0 |
Analyzing the strategies of top hosts, such as their property selection, pricing, and guest communication, can offer valuable lessons for optimizing your own Airbnb operations in Soraga di Fassa.
Dive Deeper: Advanced Soraga di Fassa STR Market Data (2025)
Ready to unlock more insights? AirROI provides access to advanced metrics and comprehensive Airbnb data for Soraga di Fassa. Explore detailed analytics beyond this report to refine your investment strategy, optimize pricing, and maximize your vacation rental profits.
Explore Advanced MetricsSoraga di Fassa Short-Term Rental Market Composition (2025): Property & Room Types
Room Type Distribution
Property Type Distribution
Market Composition Insights for Soraga di Fassa
- The Soraga di Fassa Airbnb market composition is heavily skewed towards Entire Home/Apt listings, which make up 81.3% of the 32 active rentals. This indicates strong guest preference for privacy and space.
- Looking at the property type distribution in Soraga di Fassa, Apartment/Condo properties are the most common (75%), reflecting the local real estate landscape.
Soraga di Fassa Airbnb Room Capacity Analysis (2025): Bedroom Distribution
Distribution of Listings by Number of Bedrooms
Room Capacity Insights for Soraga di Fassa
- The dominant room capacity in Soraga di Fassa is 2 bedrooms listings, making up 43.8% of the market. This suggests a strong demand for properties suitable for couples or solo travelers.
- Together, 2 bedrooms and 1 bedroom properties represent 62.6% of the active Airbnb listings in Soraga di Fassa, indicating a high concentration in these sizes.
Soraga di Fassa Vacation Rental Guest Capacity Trends (2025)
Distribution of Listings by Guest Capacity
Guest Capacity Insights for Soraga di Fassa
- The most common guest capacity trend in Soraga di Fassa vacation rentals is listings accommodating 4 guests (37.5%). This suggests the primary traveler segment is likely small families or groups.
- Properties designed for 4 guests and 6 guests dominate the Soraga di Fassa STR market, accounting for 53.1% of listings.
- 28.1% of properties accommodate 6+ guests, serving the market segment for larger families or group travel in Soraga di Fassa.
- On average, properties in Soraga di Fassa are equipped to host 4.1 guests.
Soraga di Fassa Airbnb Booking Patterns (2025): Available vs. Booked Days
Available Days Distribution
Booked Days Distribution
Booking Pattern Insights for Soraga di Fassa
- The most common availability pattern in Soraga di Fassa falls within the 271-366 days range, representing 53.1% of listings. This suggests many properties have significant open periods on their calendars.
- Approximately 81.2% of listings show high availability (181+ days open annually), indicating potential for increased bookings or specific owner usage patterns.
- For booked days, the 91-180 days range is most frequent in Soraga di Fassa (31.3%), reflecting common guest stay durations or potential owner blocking patterns.
- A notable 18.7% of properties secure long booking periods (181+ days booked per year), highlighting successful long-term rental strategies or significant owner usage.
Soraga di Fassa Airbnb Minimum Stay Requirements Analysis
Distribution of Listings by Minimum Night Requirement
1 Night
7 listings
24.1% of total
2 Nights
6 listings
20.7% of total
3 Nights
3 listings
10.3% of total
4-6 Nights
5 listings
17.2% of total
7-29 Nights
2 listings
6.9% of total
30+ Nights
6 listings
20.7% of total
Key Insights
- The most prevalent minimum stay requirement in Soraga di Fassa is 1 Night, adopted by 24.1% of listings. This highlights the market's preference for shorter, flexible bookings.
- A significant segment (20.7%) caters to monthly stays (30+ nights) in Soraga di Fassa, pointing to opportunities in the extended-stay market.
Recommendations
- Align with the market by considering a 1 Night minimum stay, as 24.1% of Soraga di Fassa hosts use this setting.
- If feasible, allowing 1-night stays, especially midweek or during low season, could capture last-minute bookings, as only 24.1% currently do.
- Explore offering discounts for stays of 30+ nights to attract the 20.7% of the market seeking extended stays.
- Adjust minimum nights based on seasonality – potentially shorter during low season and longer during peak demand periods in Soraga di Fassa.
Soraga di Fassa Airbnb Cancellation Policy Trends Analysis (2025)
Super Strict 30 Days
10 listings
35.7% of total
Moderate
14 listings
50% of total
Strict
4 listings
14.3% of total
Cancellation Policy Insights for Soraga di Fassa
- The prevailing Airbnb cancellation policy trend in Soraga di Fassa is Moderate, used by 50% of listings.
- There's a relatively balanced mix between guest-friendly (50.0%) and stricter (14.3%) policies, offering choices for different guest needs.
Recommendations for Hosts
- Consider adopting a Moderate policy to align with the 50% market standard in Soraga di Fassa.
- Using a Strict policy might deter some guests, as only 14.3% of listings use it. Evaluate if potential revenue protection outweighs possible lower booking rates.
- Regularly review your cancellation policy against competitors and market demand shifts in Soraga di Fassa.
Soraga di Fassa STR Booking Lead Time Analysis (2025)
Average Booking Lead Time by Month
Booking Lead Time Insights for Soraga di Fassa
- The overall average booking lead time for vacation rentals in Soraga di Fassa is 110 days.
- Guests book furthest in advance for stays during August (average 141 days), likely coinciding with peak travel demand or local events.
- The shortest booking windows occur for stays in April (average 41 days), indicating more last-minute travel plans during this time.
- Seasonally, Summer (129 days avg.) sees the longest lead times, while Spring (70 days avg.) has the shortest, reflecting typical travel planning cycles.
Recommendations for Hosts
- Use the overall average lead time (110 days) as a baseline for your pricing and availability strategy in Soraga di Fassa.
- For August stays, consider implementing length-of-stay discounts or slightly higher rates for bookings made less than 141 days out to capitalize on advance planning.
- Target marketing efforts for the Summer season well in advance (at least 129 days) to capture early planners.
- Monitor your own booking lead times against these Soraga di Fassa averages to identify opportunities for dynamic pricing adjustments.
Popular & Essential Airbnb Amenities in Soraga di Fassa (2025)
Amenity Prevalence
Amenity Insights for Soraga di Fassa
- Essential amenities in Soraga di Fassa that guests expect include: TV, Heating. Lacking these (any) could significantly impact bookings.
- Popular amenities like Hot water, Kitchen, Wifi are common but not universal. Offering these can provide a competitive edge.
- Warning: Wifi is not universally provided but is considered essential globally. Ensure reliable Wifi is offered.
Recommendations for Hosts
- Ensure your listing includes all essential amenities for Soraga di Fassa: TV, Heating.
- Prioritize adding missing essentials: Heating.
- Consider adding popular differentiators like Hot water or Kitchen to increase appeal.
- Highlight unique or less common amenities you offer (e.g., hot tub, dedicated workspace, EV charger) in your listing description and photos.
- Regularly check competitor amenities in Soraga di Fassa to stay competitive.
Soraga di Fassa Airbnb Guest Demographics & Profile Analysis (2025)
Guest Profile Summary for Soraga di Fassa
- The typical guest profile for Airbnb in Soraga di Fassa consists of a mix of domestic (58%) and international guests, often arriving from nearby Milan, typically belonging to the Post-2000s (Gen Z/Alpha) group (50%), primarily speaking English or Italian.
- Domestic travelers account for 57.9% of guests.
- Key international markets include Italy (57.9%) and Germany (9%).
- Top languages spoken are English (38.7%) followed by Italian (21.9%).
- A significant demographic segment is the Post-2000s (Gen Z/Alpha) group, representing 50% of guests.
Recommendations for Hosts
- Balance marketing efforts between domestic and international channels based on the guest mix.
- Tailor amenities and listing descriptions to appeal to the dominant Post-2000s (Gen Z/Alpha) demographic (e.g., highlight fast WiFi, smart home features, local guides).
- Highlight unique local experiences or amenities relevant to the primary guest profile.
- Consider seasonal promotions aligned with peak travel times for key origin markets.
Nearby Short-Term Rental Market Comparison
How does the Soraga di Fassa Airbnb market stack up against its neighbors? Compare key performance metrics like average monthly revenue, ADR, and occupancy rates in surrounding areas to understand the broader regional STR landscape.
| Market | Active Properties | Monthly Revenue | Daily Rate | Avg. Occupancy |
|---|---|---|---|---|
| Bayrischzell | 30 | $4,718 | $392.87 | 42% |
| Urtijëi - St. Ulrich in Gröden - Ortisei | 163 | $4,698 | $630.45 | 40% |
| Moos in Passeier - Moso in Passiria | 17 | $4,619 | $547.60 | 27% |
| Steinberg am Rofan | 11 | $4,394 | $311.71 | 40% |
| Brenzone sul Garda | 19 | $4,128 | $335.25 | 52% |
| Reith bei Kitzbühel | 44 | $3,766 | $308.69 | 45% |
| Pfafflar | 10 | $3,559 | $263.32 | 58% |
| Cortina d'Ampezzo | 265 | $3,522 | $379.53 | 43% |
| Venice | 6,405 | $3,454 | $238.80 | 53% |
| Wiesing | 16 | $3,222 | $208.10 | 52% |