Malé Airbnb Market Analysis 2025: Short Term Rental Data & Vacation Rental Statistics in Trentino – Alto Adige/Südtirol, Italy
Is Airbnb profitable in Malé in 2025? Explore comprehensive Airbnb analytics for Malé, Trentino – Alto Adige/Südtirol, Italy to uncover income potential. This 2025 STR market report for Malé, based on AirROI data from April 2024 to March 2025, reveals key trends in the niche market of 41 active listings.
Whether you're considering an Airbnb investment in Malé, optimizing your existing vacation rental, or exploring rental arbitrage opportunities, understanding the Malé Airbnb data is crucial. Navigating the high regulation landscape is key to maximizing your short term rental income potential. Let's dive into the specifics.
Key Malé Airbnb Performance Metrics Overview
Monthly Airbnb Revenue Variations & Income Potential in Malé (2025)
Understanding the monthly revenue variations for Airbnb listings in Malé is key to maximizing your short term rental income potential. Seasonality significantly impacts earnings. Our analysis, based on data from the past 12 months, shows that the peak revenue month for STRs in Malé is typically August, while April often presents the lowest earnings, highlighting opportunities for strategic pricing adjustments during shoulder and low seasons. Explore the typical Airbnb income in Malé across different performance tiers:
- Best-in-class properties (Top 10%) achieve $2,747+ monthly, often utilizing dynamic pricing and superior guest experiences.
- Strong performing properties (Top 25%) earn $1,861 or more, indicating effective management and desirable locations/amenities.
- Typical properties (Median) generate around $1,026 per month, representing the average market performance.
- Entry-level properties (Bottom 25%) see earnings around $614, often with potential for optimization.
Average Monthly Airbnb Earnings Trend in Malé
Malé Airbnb Occupancy Rate Trends (2025)
Maximize your bookings by understanding the Malé STR occupancy trends. Seasonal demand shifts significantly influence how often properties are booked. Typically, Februarysees the highest demand (peak season occupancy), while November experiences the lowest (low season). Effective strategies, like adjusting minimum stays or offering promotions, can boost occupancy during slower periods. Here's how different property tiers perform in Malé:
- Best-in-class properties (Top 10%) achieve 67%+ occupancy, indicating high desirability and potentially optimized availability.
- Strong performing properties (Top 25%) maintain 46% or higher occupancy, suggesting good market fit and guest satisfaction.
- Typical properties (Median) have an occupancy rate around 29%.
- Entry-level properties (Bottom 25%) average 16% occupancy, potentially facing higher vacancy.
Average Monthly Occupancy Rate Trend in Malé
Average Daily Rate (ADR) Airbnb Trends in Malé (2025)
Effective short term rental pricing strategy in Malé involves understanding monthly ADR fluctuations. The Average Daily Rate (ADR) for Airbnb in Malé typically peaks in February and dips lowest during October. Leveraging Airbnb dynamic pricing tools or strategies based on this seasonality can significantly boost revenue. Here's a look at the typical nightly rates achieved:
- Best-in-class properties (Top 10%) command rates of $265+ per night, often due to premium features or locations.
- Strong performing properties (Top 25%) achieve nightly rates of $163 or more.
- Typical properties (Median) charge around $106 per night.
- Entry-level properties (Bottom 25%) earn around $80 per night.
Average Daily Rate (ADR) Trend by Month in Malé
Get Live Malé Market Intelligence 👇

Explore Real-time Analytics
Airbnb Seasonality Analysis & Trends in Malé (2025)
Peak Season (August, February, July)
- Revenue averages $2,077 per month
- Occupancy rates average 54.3%
- Daily rates average $141
Shoulder Season
- Revenue averages $1,172 per month
- Occupancy maintains around 28.5%
- Daily rates hold near $133
Low Season (March, April, November)
- Revenue drops to average $857 per month
- Occupancy decreases to average 21.4%
- Daily rates adjust to average $132
Seasonality Insights for Malé
- The Airbnb seasonality in Malé shows highly seasonal trends requiring careful strategy. While the sections above show seasonal averages, it's also insightful to look at the extremes:
- During the high season, the absolute peak month showcases Malé's highest earning potential, with monthly revenues capable of climbing to $2,377, occupancy reaching a high of 56.6%, and ADRs peaking at $150.
- Conversely, the slowest single month of the year, typically falling within the low season, marks the market's lowest point. In this month, revenue might dip to $680, occupancy could drop to 18.8%, and ADRs may adjust down to $125.
- Understanding both the seasonal averages and these monthly peaks and troughs in revenue, occupancy, and ADR is crucial for maximizing your Airbnb profit potential in Malé.
Seasonal Strategies for Maximizing Profit
- Peak Season: Maximize revenue through premium pricing and potentially longer minimum stays. Ensure high availability.
- Low Season: Offer competitive pricing, special promotions (e.g., extended stay discounts), and flexible cancellation policies. Target off-season travelers like remote workers or budget-conscious guests.
- Shoulder Seasons: Implement dynamic pricing that balances peak and low rates. Target weekend travelers or specific events. Offer slightly more flexible terms than peak season.
- Regularly analyze your own performance against these Malé seasonality benchmarks and adjust your pricing and availability strategy accordingly.
Best Areas for Airbnb Investment in Malé (2025)
Exploring the top neighborhoods for short-term rentals in Malé? This section highlights key areas, outlining why they are attractive for hosts and guests, along with notable local attractions. Consider these locations based on your target guest profile and investment strategy.
| Neighborhood / Area | Why Host Here? (Target Guests & Appeal) | Key Attractions & Landmarks |
|---|---|---|
| Bolzano | The capital of South Tyrol, Bolzano offers a mix of Italian and Austrian culture with stunning mountain views. A perfect base for tourists exploring both the Dolomites and the wine regions. | Piazza Walther, South Tyrol Museum of Archaeology, Ötzi the Iceman, Runkelstein Castle, Bolzano Christmas Market |
| Merano | A charming spa town known for its Mediterranean-style gardens and beautiful promenades. Merano attracts visitors seeking relaxation, wellness, and outdoor activities. | Therme Meran, Trauttmansdorff Castle and Gardens, Merano's Tappeiner Promenade, Merano Christmas Market, Passeggiata Lungo Passirio |
| Trento | A historical city with beautiful architecture and a rich cultural heritage. It serves as a gateway for visitors exploring the Trentino region and its natural parks. | Castello del Buonconsiglio, Piazza Duomo, Trento Science Museum, Museo dell'Aeronautica Gianni Caproni, Giardino Botanico Alpino Viote |
| Riva del Garda | Located on the northern shore of Lake Garda, Riva del Garda is popular for its mild climate and outdoor activities such as hiking, sailing, and cycling. | Rocca di Riva, Old Town, Mountain biking trails, Busatte-Tempesta Trail, Lake Garda |
| Canazei | A popular destination for ski lovers and hikers, Canazei is nestled in the Dolomites and offers amazing access to skiing and hiking trails. | Sella Ronda ski circuit, Dolomiti Superski, Fassa Valley, Pordoi Pass, Bec de Roces |
| Ortisei | Known for its stunning alpine scenery and woodcarving tradition, Ortisei is a charming village that attracts both winter sports enthusiasts and summer nature lovers. | Seceda Plateau, Resciesa Funicular, Alpenrose Ski Resort, Val Gardena, Church of St. Ulrich |
| Laives | A smaller town close to Bolzano, Laives is becoming popular due to its affordability and proximity to the larger cities, making it a good option for budget-conscious travelers. | Parco della Rimembranza, Laives'' wine route, Adige River bike path, St. Joseph's Church, Local vineyards |
| Alto Adige Wine Road | This wine route passes through several picturesque towns and vineyards, making it ideal for wine lovers and gastronomes looking to explore local flavors and culture. | Castel Mareccio, Kellerei Terlan wine cellar, Wine festivals, Vineyard tours, Local eateries |
Understanding Airbnb License Requirements & STR Laws in Malé (2025)
Yes, Malé, Trentino – Alto Adige/Südtirol, Italy enforces high STR regulations. Obtaining a license and ensuring compliance is almost certainly required according to current 2025 STR laws. Always verify the latest short term rental regulations and Airbnb license requirements directly with local government authorities for Malé to ensure full compliance before hosting.
(Source: AirROI data, 2025, based on 71% licensed listings)
Top Performing Airbnb Properties in Malé (2025)
Benchmark your potential! Explore examples of top-performing Airbnb properties in Malébased on Trailing Twelve Month (TTM) revenue. Analyze their characteristics, revenue, occupancy rate, and ADR to understand what drives success in this market.
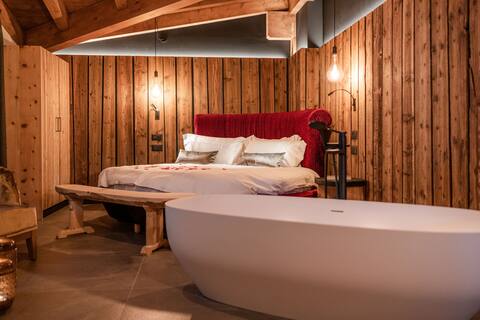
Nidaris: Romantic Rooftop Spa Suite
Entire Place • 1 bedroom

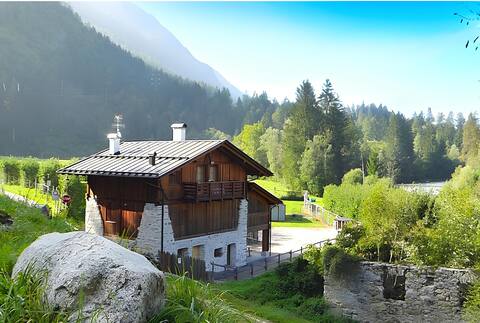
El Mas dei Baiti ... in the forest of Val di Rabbi
Entire Place • 2 bedrooms
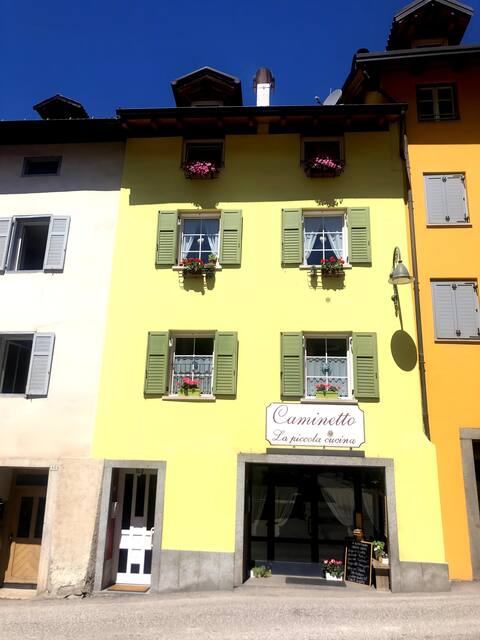
Chalet in Val di Sole-Dimaro: skiing, biking, hiking
Entire Place • 2 bedrooms
Apartment in Malé
Entire Place • 1 bedroom

Golden button 130 m2 Casa Marina sleeps 8
Entire Place • 3 bedrooms
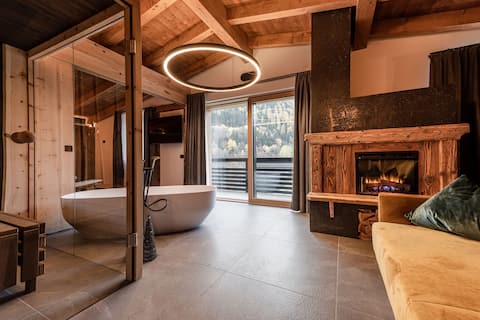
Nidaris: Luxury Spa Suite con sauna
Entire Place • 1 bedroom
Note: Performance varies based on location, size, amenities, seasonality, and management quality. Data reflects the past 12 months.
Top Performing Airbnb Hosts in Malé (2025)
Learn from the best! This table showcases top-performing Airbnb hosts in Malé based on the number of properties managed and estimated total revenue over the past year. Analyze their scale and performance metrics.
| Host Name | Properties | Grossing Revenue | Stay Reviews | Avg Rating |
|---|---|---|---|---|
| Davide | 6 | $90,384 | 20 | 1.60/5.0 |
| Alessandro | 7 | $88,495 | 226 | 4.93/5.0 |
| Carlo | 4 | $41,055 | 76 | 4.91/5.0 |
| Nicoletta | 3 | $32,066 | 20 | 4.93/5.0 |
| Federico | 3 | $27,579 | 9 | 1.63/5.0 |
| Silvia | 2 | $19,478 | 55 | 4.47/5.0 |
| Claudia | 2 | $19,091 | 25 | 4.96/5.0 |
| Ilaria | 1 | $18,703 | 4 | 4.75/5.0 |
| Cristina | 1 | $17,056 | 59 | 4.93/5.0 |
| Emanuela | 1 | $14,995 | 39 | 4.87/5.0 |
Analyzing the strategies of top hosts, such as their property selection, pricing, and guest communication, can offer valuable lessons for optimizing your own Airbnb operations in Malé.
Dive Deeper: Advanced Malé STR Market Data (2025)
Ready to unlock more insights? AirROI provides access to advanced metrics and comprehensive Airbnb data for Malé. Explore detailed analytics beyond this report to refine your investment strategy, optimize pricing, and maximize your vacation rental profits.
Explore Advanced MetricsMalé Short-Term Rental Market Composition (2025): Property & Room Types
Room Type Distribution
Property Type Distribution
Market Composition Insights for Malé
- The Malé Airbnb market composition is heavily skewed towards Entire Home/Apt listings, which make up 95.1% of the 41 active rentals. This indicates strong guest preference for privacy and space.
- Looking at the property type distribution in Malé, Apartment/Condo properties are the most common (82.9%), reflecting the local real estate landscape.
- Smaller segments like outdoor/unique (combined 2.4%) offer potential for unique stay experiences.
Malé Airbnb Room Capacity Analysis (2025): Bedroom Distribution
Distribution of Listings by Number of Bedrooms
Room Capacity Insights for Malé
- The dominant room capacity in Malé is 2 bedrooms listings, making up 51.2% of the market. This suggests a strong demand for properties suitable for couples or solo travelers.
- Together, 2 bedrooms and 1 bedroom properties represent 80.5% of the active Airbnb listings in Malé, indicating a high concentration in these sizes.
Malé Vacation Rental Guest Capacity Trends (2025)
Distribution of Listings by Guest Capacity
Guest Capacity Insights for Malé
- The most common guest capacity trend in Malé vacation rentals is listings accommodating 4 guests (34.1%). This suggests the primary traveler segment is likely small families or groups.
- Properties designed for 4 guests and 8+ guests dominate the Malé STR market, accounting for 48.7% of listings.
- 29.2% of properties accommodate 6+ guests, serving the market segment for larger families or group travel in Malé.
- On average, properties in Malé are equipped to host 4.7 guests.
Malé Airbnb Booking Patterns (2025): Available vs. Booked Days
Available Days Distribution
Booked Days Distribution
Booking Pattern Insights for Malé
- The most common availability pattern in Malé falls within the 271-366 days range, representing 63.4% of listings. This suggests many properties have significant open periods on their calendars.
- Approximately 92.7% of listings show high availability (181+ days open annually), indicating potential for increased bookings or specific owner usage patterns.
- For booked days, the 31-90 days range is most frequent in Malé (41.5%), reflecting common guest stay durations or potential owner blocking patterns.
- A notable 7.3% of properties secure long booking periods (181+ days booked per year), highlighting successful long-term rental strategies or significant owner usage.
Malé Airbnb Minimum Stay Requirements Analysis
Distribution of Listings by Minimum Night Requirement
1 Night
3 listings
7.3% of total
2 Nights
3 listings
7.3% of total
3 Nights
9 listings
22% of total
4-6 Nights
14 listings
34.1% of total
7-29 Nights
1 listings
2.4% of total
30+ Nights
11 listings
26.8% of total
Key Insights
- The most prevalent minimum stay requirement in Malé is 4-6 Nights, adopted by 34.1% of listings. This highlights the market's preference for longer commitments.
- Very short stays (1-2 nights) are less common (14.6%), suggesting hosts prefer slightly longer bookings to optimize turnover.
- A significant segment (26.8%) caters to monthly stays (30+ nights) in Malé, pointing to opportunities in the extended-stay market.
Recommendations
- Align with the market by considering a 4-6 Nights minimum stay, as 34.1% of Malé hosts use this setting.
- If feasible, allowing 1-night stays, especially midweek or during low season, could capture last-minute bookings, as only 7.3% currently do.
- Explore offering discounts for stays of 30+ nights to attract the 26.8% of the market seeking extended stays.
- Adjust minimum nights based on seasonality – potentially shorter during low season and longer during peak demand periods in Malé.
Malé Airbnb Cancellation Policy Trends Analysis (2025)
Flexible
2 listings
5.7% of total
Moderate
24 listings
68.6% of total
Strict
9 listings
25.7% of total
Cancellation Policy Insights for Malé
- The prevailing Airbnb cancellation policy trend in Malé is Moderate, used by 68.6% of listings.
- The market strongly favors guest-friendly terms, with 74.3% of listings offering Flexible or Moderate policies. This suggests guests in Malé may expect booking flexibility.
Recommendations for Hosts
- Consider adopting a Moderate policy to align with the 68.6% market standard in Malé.
- Regularly review your cancellation policy against competitors and market demand shifts in Malé.
Malé STR Booking Lead Time Analysis (2025)
Average Booking Lead Time by Month
Booking Lead Time Insights for Malé
- The overall average booking lead time for vacation rentals in Malé is 45 days.
- Guests book furthest in advance for stays during July (average 81 days), likely coinciding with peak travel demand or local events.
- The shortest booking windows occur for stays in November (average 26 days), indicating more last-minute travel plans during this time.
- Seasonally, Summer (75 days avg.) sees the longest lead times, while Fall (36 days avg.) has the shortest, reflecting typical travel planning cycles.
Recommendations for Hosts
- Use the overall average lead time (45 days) as a baseline for your pricing and availability strategy in Malé.
- For July stays, consider implementing length-of-stay discounts or slightly higher rates for bookings made less than 81 days out to capitalize on advance planning.
- Target marketing efforts for the Summer season well in advance (at least 75 days) to capture early planners.
- Monitor your own booking lead times against these Malé averages to identify opportunities for dynamic pricing adjustments.
Popular & Essential Airbnb Amenities in Malé (2025)
Amenity Prevalence
Amenity Insights for Malé
- Essential amenities in Malé that guests expect include: Heating, Hot water, Kitchen. Lacking these (any) could significantly impact bookings.
- Popular amenities like Dishes and silverware, Refrigerator, TV are common but not universal. Offering these can provide a competitive edge.
Recommendations for Hosts
- Ensure your listing includes all essential amenities for Malé: Heating, Hot water, Kitchen.
- Prioritize adding missing essentials: Hot water, Kitchen.
- Consider adding popular differentiators like Dishes and silverware or Refrigerator to increase appeal.
- Highlight unique or less common amenities you offer (e.g., hot tub, dedicated workspace, EV charger) in your listing description and photos.
- Regularly check competitor amenities in Malé to stay competitive.
Malé Airbnb Guest Demographics & Profile Analysis (2025)
Guest Profile Summary for Malé
- The typical guest profile for Airbnb in Malé consists of a mix of domestic (52%) and international guests, often arriving from nearby Warsaw, typically belonging to the Post-2000s (Gen Z/Alpha) group (50%), primarily speaking English or Italian.
- Domestic travelers account for 51.7% of guests.
- Key international markets include Italy (51.7%) and Germany (11.9%).
- Top languages spoken are English (36.9%) followed by Italian (25.5%).
- A significant demographic segment is the Post-2000s (Gen Z/Alpha) group, representing 50% of guests.
Recommendations for Hosts
- Balance marketing efforts between domestic and international channels based on the guest mix.
- Tailor amenities and listing descriptions to appeal to the dominant Post-2000s (Gen Z/Alpha) demographic (e.g., highlight fast WiFi, smart home features, local guides).
- Highlight unique local experiences or amenities relevant to the primary guest profile.
- Consider seasonal promotions aligned with peak travel times for key origin markets.
Nearby Short-Term Rental Market Comparison
How does the Malé Airbnb market stack up against its neighbors? Compare key performance metrics like average monthly revenue, ADR, and occupancy rates in surrounding areas to understand the broader regional STR landscape.
| Market | Active Properties | Monthly Revenue | Daily Rate | Avg. Occupancy |
|---|---|---|---|---|
| Laglio | 64 | $4,873 | $463.61 | 47% |
| Bayrischzell | 30 | $4,718 | $392.87 | 42% |
| Urtijëi - St. Ulrich in Gröden - Ortisei | 163 | $4,698 | $630.45 | 40% |
| Moos in Passeier - Moso in Passiria | 17 | $4,619 | $547.60 | 27% |
| Steinberg am Rofan | 11 | $4,394 | $311.71 | 40% |
| Brenzone sul Garda | 19 | $4,128 | $335.25 | 52% |
| Bürserberg | 40 | $3,978 | $342.57 | 41% |
| Sala Comacina | 64 | $3,794 | $400.27 | 50% |
| Bellagio | 373 | $3,630 | $328.26 | 55% |
| Brand | 56 | $3,597 | $486.13 | 33% |