Valderice Airbnb Market Analysis 2025: Short Term Rental Data & Vacation Rental Statistics in Sicily, Italy
Is Airbnb profitable in Valderice in 2025? Explore comprehensive Airbnb analytics for Valderice, Sicily, Italy to uncover income potential. This 2025 STR market report for Valderice, based on AirROI data from April 2024 to March 2025, reveals key trends in the niche market of 114 active listings.
Whether you're considering an Airbnb investment in Valderice, optimizing your existing vacation rental, or exploring rental arbitrage opportunities, understanding the Valderice Airbnb data is crucial. Navigating the high regulation landscape is key to maximizing your short term rental income potential. Let's dive into the specifics.
Key Valderice Airbnb Performance Metrics Overview
Monthly Airbnb Revenue Variations & Income Potential in Valderice (2025)
Understanding the monthly revenue variations for Airbnb listings in Valderice is key to maximizing your short term rental income potential. Seasonality significantly impacts earnings. Our analysis, based on data from the past 12 months, shows that the peak revenue month for STRs in Valderice is typically August, while February often presents the lowest earnings, highlighting opportunities for strategic pricing adjustments during shoulder and low seasons. Explore the typical Airbnb income in Valderice across different performance tiers:
- Best-in-class properties (Top 10%) achieve $2,844+ monthly, often utilizing dynamic pricing and superior guest experiences.
- Strong performing properties (Top 25%) earn $1,730 or more, indicating effective management and desirable locations/amenities.
- Typical properties (Median) generate around $888 per month, representing the average market performance.
- Entry-level properties (Bottom 25%) see earnings around $397, often with potential for optimization.
Average Monthly Airbnb Earnings Trend in Valderice
Valderice Airbnb Occupancy Rate Trends (2025)
Maximize your bookings by understanding the Valderice STR occupancy trends. Seasonal demand shifts significantly influence how often properties are booked. Typically, Augustsees the highest demand (peak season occupancy), while March experiences the lowest (low season). Effective strategies, like adjusting minimum stays or offering promotions, can boost occupancy during slower periods. Here's how different property tiers perform in Valderice:
- Best-in-class properties (Top 10%) achieve 71%+ occupancy, indicating high desirability and potentially optimized availability.
- Strong performing properties (Top 25%) maintain 52% or higher occupancy, suggesting good market fit and guest satisfaction.
- Typical properties (Median) have an occupancy rate around 29%.
- Entry-level properties (Bottom 25%) average 12% occupancy, potentially facing higher vacancy.
Average Monthly Occupancy Rate Trend in Valderice
Average Daily Rate (ADR) Airbnb Trends in Valderice (2025)
Effective short term rental pricing strategy in Valderice involves understanding monthly ADR fluctuations. The Average Daily Rate (ADR) for Airbnb in Valderice typically peaks in August and dips lowest during March. Leveraging Airbnb dynamic pricing tools or strategies based on this seasonality can significantly boost revenue. Here's a look at the typical nightly rates achieved:
- Best-in-class properties (Top 10%) command rates of $292+ per night, often due to premium features or locations.
- Strong performing properties (Top 25%) achieve nightly rates of $130 or more.
- Typical properties (Median) charge around $87 per night.
- Entry-level properties (Bottom 25%) earn around $63 per night.
Average Daily Rate (ADR) Trend by Month in Valderice
Get Live Valderice Market Intelligence 👇

Explore Real-time Analytics
Airbnb Seasonality Analysis & Trends in Valderice (2025)
Peak Season (August, July, October)
- Revenue averages $2,264 per month
- Occupancy rates average 47.2%
- Daily rates average $157
Shoulder Season
- Revenue averages $1,283 per month
- Occupancy maintains around 33.4%
- Daily rates hold near $139
Low Season (February, March, December)
- Revenue drops to average $567 per month
- Occupancy decreases to average 23.0%
- Daily rates adjust to average $119
Seasonality Insights for Valderice
- The Airbnb seasonality in Valderice shows highly seasonal trends requiring careful strategy. While the sections above show seasonal averages, it's also insightful to look at the extremes:
- During the high season, the absolute peak month showcases Valderice's highest earning potential, with monthly revenues capable of climbing to $2,703, occupancy reaching a high of 50.7%, and ADRs peaking at $165.
- Conversely, the slowest single month of the year, typically falling within the low season, marks the market's lowest point. In this month, revenue might dip to $448, occupancy could drop to 20.1%, and ADRs may adjust down to $118.
- Understanding both the seasonal averages and these monthly peaks and troughs in revenue, occupancy, and ADR is crucial for maximizing your Airbnb profit potential in Valderice.
Seasonal Strategies for Maximizing Profit
- Peak Season: Maximize revenue through premium pricing and potentially longer minimum stays. Ensure high availability.
- Low Season: Offer competitive pricing, special promotions (e.g., extended stay discounts), and flexible cancellation policies. Target off-season travelers like remote workers or budget-conscious guests.
- Shoulder Seasons: Implement dynamic pricing that balances peak and low rates. Target weekend travelers or specific events. Offer slightly more flexible terms than peak season.
- Regularly analyze your own performance against these Valderice seasonality benchmarks and adjust your pricing and availability strategy accordingly.
Best Areas for Airbnb Investment in Valderice (2025)
Exploring the top neighborhoods for short-term rentals in Valderice? This section highlights key areas, outlining why they are attractive for hosts and guests, along with notable local attractions. Consider these locations based on your target guest profile and investment strategy.
| Neighborhood / Area | Why Host Here? (Target Guests & Appeal) | Key Attractions & Landmarks |
|---|---|---|
| San Vito Lo Capo | A beautiful coastal town known for its stunning beaches and crystal-clear waters. It's a top destination for tourists, especially in the summer, making it ideal for Airbnb hosting. | San Vito Lo Capo Beach, Zingaro Nature Reserve, Couscous Fest, Tonnara del Secco, Spiaggia di Macari |
| Erice | A historic hilltop town offering breathtaking views and a charming atmosphere. It attracts visitors interested in history, culture, and medieval architecture, which is perfect for unique stays. | Castello di Venus, Chiesa Madre, Ancient Greek Theatre, Erice Cable Car, Corso Vittorio Emanuele |
| Trapani | A bustling port city famous for its seafood, historical sites, and vibrant nightlife. With its connections to the Egadi Islands and surrounding attractions, it draws a diverse crowd. | Trapani Old Town, Salt Pans, Museum of Salt, Cathedral of San Lorenzo, Lido Paradiso |
| Monreale | Famous for its stunning cathedral and mosaics, Monreale attracts tourists looking for cultural and historical experiences, making it a prime location for short-term rentals. | Monreale Cathedral, Benedictine Cloister, Piazza Vittorio Emanuele, La Zisa, Piano dell'Acqua |
| Castellammare del Golfo | This picturesque town offers a mix of beaches, historical sites, and nightlife. It's a growing destination for those seeking a Sicilian coastal experience. | Cala Petrolo Beach, Castello di Castellammare, Tonnara di Scopello, Zingaro Nature Reserve, Scopello |
| Segesta | Home to the ancient Greek theater and temple, Segesta appeals to tourists interested in archaeology and history, encouraging stays nearby for easy access to the site. | Greek Theatre of Segesta, Temple of Segesta, Parco Archeologico, Vineyards, Stunning countryside |
| Buseto Palizzolo | A small, charming town in the heart of Sicily, offering an authentic local experience and easy access to nearby attractions, perfect for hosts looking for a quieter setting. | St. Thomas Church, Local Markets, Sicilian Cuisine, Nature Trails, Viewpoints over the surrounding countryside |
| Partinico | Known for its wine production and beautiful landscapes, Partinico appeals to those interested in agritourism and farm stays, making it a unique Airbnb location. | Cantine Donnafugata, La Rocca di Partinico, Nature Hiking Trails, Local Vineyards, Culinary Experiences |
Understanding Airbnb License Requirements & STR Laws in Valderice (2025)
Yes, Valderice, Sicily, Italy enforces high STR regulations. Obtaining a license and ensuring compliance is almost certainly required according to current 2025 STR laws. Always verify the latest short term rental regulations and Airbnb license requirements directly with local government authorities for Valderice to ensure full compliance before hosting.
(Source: AirROI data, 2025, based on 60% licensed listings)
Top Performing Airbnb Properties in Valderice (2025)
Benchmark your potential! Explore examples of top-performing Airbnb properties in Valdericebased on Trailing Twelve Month (TTM) revenue. Analyze their characteristics, revenue, occupancy rate, and ADR to understand what drives success in this market.
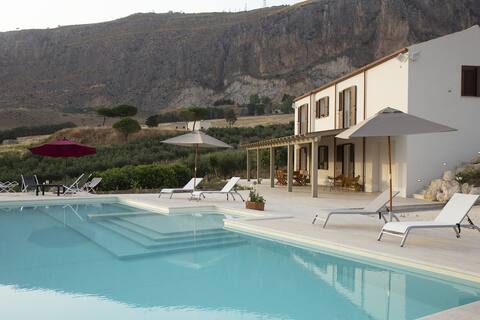
Torrebianca Villa Estate with Panoramic Pool
Entire Place • 5 bedrooms
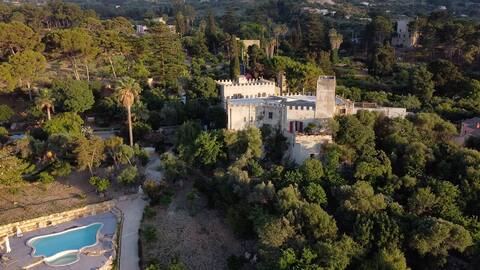
Antica Fortezza Villa Fontana
Entire Place • 8 bedrooms

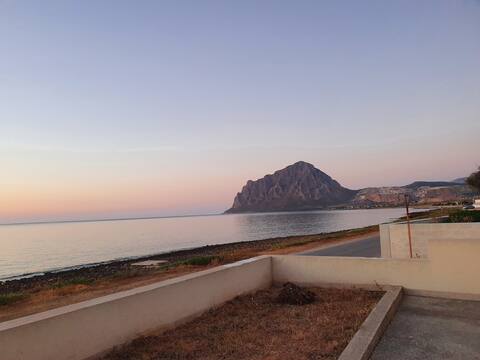
Villa Maria window on the sea
Entire Place • 3 bedrooms
Villino Maria Elena
Entire Place • 2 bedrooms
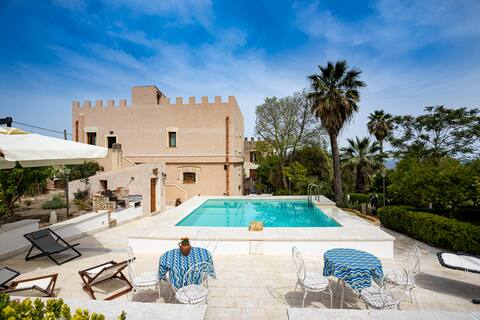
Villa Fontana Casa del Custode CIR 19081022C207701
Entire Place • 3 bedrooms
ViviMare - Villa by the sea
Entire Place • 2 bedrooms
Note: Performance varies based on location, size, amenities, seasonality, and management quality. Data reflects the past 12 months.
Top Performing Airbnb Hosts in Valderice (2025)
Learn from the best! This table showcases top-performing Airbnb hosts in Valderice based on the number of properties managed and estimated total revenue over the past year. Analyze their scale and performance metrics.
| Host Name | Properties | Grossing Revenue | Stay Reviews | Avg Rating |
|---|---|---|---|---|
| Francesca | 2 | $106,367 | 12 | 2.50/5.0 |
| Umberto | 1 | $79,374 | 31 | 5.00/5.0 |
| Paola | 3 | $70,221 | 167 | 4.99/5.0 |
| Leonardo | 1 | $65,306 | 55 | 4.82/5.0 |
| Isidoro | 2 | $44,550 | 357 | 4.71/5.0 |
| Riccardo | 6 | $37,657 | 36 | 4.41/5.0 |
| Maria Elena | 1 | $35,076 | 20 | 4.60/5.0 |
| Maria Carmela | 2 | $34,917 | 15 | 4.94/5.0 |
| Caterina | 2 | $32,264 | 49 | 2.38/5.0 |
| Antonella | 1 | $30,569 | 243 | 4.90/5.0 |
Analyzing the strategies of top hosts, such as their property selection, pricing, and guest communication, can offer valuable lessons for optimizing your own Airbnb operations in Valderice.
Dive Deeper: Advanced Valderice STR Market Data (2025)
Ready to unlock more insights? AirROI provides access to advanced metrics and comprehensive Airbnb data for Valderice. Explore detailed analytics beyond this report to refine your investment strategy, optimize pricing, and maximize your vacation rental profits.
Explore Advanced MetricsValderice Short-Term Rental Market Composition (2025): Property & Room Types
Room Type Distribution
Property Type Distribution
Market Composition Insights for Valderice
- The Valderice Airbnb market composition is heavily skewed towards Entire Home/Apt listings, which make up 86.8% of the 114 active rentals. This indicates strong guest preference for privacy and space.
- Looking at the property type distribution in Valderice, House properties are the most common (56.1%), reflecting the local real estate landscape.
- Houses represent a significant 56.1% portion, catering likely to families or larger groups.
- The presence of 6.1% Hotel/Boutique listings indicates integration with traditional hospitality.
- Smaller segments like outdoor/unique, unique stays (combined 2.7%) offer potential for unique stay experiences.
Valderice Airbnb Room Capacity Analysis (2025): Bedroom Distribution
Distribution of Listings by Number of Bedrooms
Room Capacity Insights for Valderice
- The dominant room capacity in Valderice is 2 bedrooms listings, making up 36% of the market. This suggests a strong demand for properties suitable for couples or solo travelers.
- Together, 2 bedrooms and 1 bedroom properties represent 64.9% of the active Airbnb listings in Valderice, indicating a high concentration in these sizes.
- A significant 27.2% of listings offer 3+ bedrooms, catering to larger groups and families seeking more space in Valderice.
Valderice Vacation Rental Guest Capacity Trends (2025)
Distribution of Listings by Guest Capacity
Guest Capacity Insights for Valderice
- The most common guest capacity trend in Valderice vacation rentals is listings accommodating 4 guests (25.4%). This suggests the primary traveler segment is likely small families or groups.
- Properties designed for 4 guests and 6 guests dominate the Valderice STR market, accounting for 42.9% of listings.
- 35.0% of properties accommodate 6+ guests, serving the market segment for larger families or group travel in Valderice.
- On average, properties in Valderice are equipped to host 4.4 guests.
Valderice Airbnb Booking Patterns (2025): Available vs. Booked Days
Available Days Distribution
Booked Days Distribution
Booking Pattern Insights for Valderice
- The most common availability pattern in Valderice falls within the 271-366 days range, representing 66.7% of listings. This suggests many properties have significant open periods on their calendars.
- Approximately 92.1% of listings show high availability (181+ days open annually), indicating potential for increased bookings or specific owner usage patterns.
- For booked days, the 31-90 days range is most frequent in Valderice (35.1%), reflecting common guest stay durations or potential owner blocking patterns.
- A notable 8.8% of properties secure long booking periods (181+ days booked per year), highlighting successful long-term rental strategies or significant owner usage.
Valderice Airbnb Minimum Stay Requirements Analysis
Distribution of Listings by Minimum Night Requirement
1 Night
21 listings
20% of total
2 Nights
26 listings
24.8% of total
3 Nights
25 listings
23.8% of total
4-6 Nights
16 listings
15.2% of total
7-29 Nights
11 listings
10.5% of total
30+ Nights
6 listings
5.7% of total
Key Insights
- The most prevalent minimum stay requirement in Valderice is 2 Nights, adopted by 24.8% of listings. This highlights the market's preference for shorter, flexible bookings.
Recommendations
- Align with the market by considering a 2 Nights minimum stay, as 24.8% of Valderice hosts use this setting.
- If feasible, allowing 1-night stays, especially midweek or during low season, could capture last-minute bookings, as only 20% currently do.
- Explore offering discounts for stays of 30+ nights to attract the 5.7% of the market seeking extended stays.
- Adjust minimum nights based on seasonality – potentially shorter during low season and longer during peak demand periods in Valderice.
Valderice Airbnb Cancellation Policy Trends Analysis (2025)
Super Strict 30 Days
1 listings
1.1% of total
Flexible
23 listings
24.2% of total
Moderate
44 listings
46.3% of total
Strict
27 listings
28.4% of total
Cancellation Policy Insights for Valderice
- The prevailing Airbnb cancellation policy trend in Valderice is Moderate, used by 46.3% of listings.
- The market strongly favors guest-friendly terms, with 70.5% of listings offering Flexible or Moderate policies. This suggests guests in Valderice may expect booking flexibility.
Recommendations for Hosts
- Consider adopting a Moderate policy to align with the 46.3% market standard in Valderice.
- Regularly review your cancellation policy against competitors and market demand shifts in Valderice.
Valderice STR Booking Lead Time Analysis (2025)
Average Booking Lead Time by Month
Booking Lead Time Insights for Valderice
- The overall average booking lead time for vacation rentals in Valderice is 52 days.
- Guests book furthest in advance for stays during October (average 80 days), likely coinciding with peak travel demand or local events.
- The shortest booking windows occur for stays in December (average 26 days), indicating more last-minute travel plans during this time.
- Seasonally, Fall (69 days avg.) sees the longest lead times, while Winter (36 days avg.) has the shortest, reflecting typical travel planning cycles.
Recommendations for Hosts
- Use the overall average lead time (52 days) as a baseline for your pricing and availability strategy in Valderice.
- For October stays, consider implementing length-of-stay discounts or slightly higher rates for bookings made less than 80 days out to capitalize on advance planning.
- Target marketing efforts for the Fall season well in advance (at least 69 days) to capture early planners.
- Monitor your own booking lead times against these Valderice averages to identify opportunities for dynamic pricing adjustments.
Popular & Essential Airbnb Amenities in Valderice (2025)
Amenity Prevalence
Amenity Insights for Valderice
- Essential amenities in Valderice that guests expect include: Air conditioning, TV. Lacking these (any) could significantly impact bookings.
- Popular amenities like Kitchen, Hair dryer, Essentials are common but not universal. Offering these can provide a competitive edge.
- Warning: Wifi is not universally provided but is considered essential globally. Ensure reliable Wifi is offered.
Recommendations for Hosts
- Ensure your listing includes all essential amenities for Valderice: Air conditioning, TV.
- Prioritize adding missing essentials: Air conditioning, TV.
- Consider adding popular differentiators like Kitchen or Hair dryer to increase appeal.
- Highlight unique or less common amenities you offer (e.g., hot tub, dedicated workspace, EV charger) in your listing description and photos.
- Regularly check competitor amenities in Valderice to stay competitive.
Valderice Airbnb Guest Demographics & Profile Analysis (2025)
Guest Profile Summary for Valderice
- The typical guest profile for Airbnb in Valderice consists of predominantly international visitors (76%), with top international origins including France, typically belonging to the Post-2000s (Gen Z/Alpha) group (50%), primarily speaking English or French.
- Domestic travelers account for 24.0% of guests.
- Key international markets include Italy (24%) and France (20%).
- Top languages spoken are English (38.2%) followed by French (15.8%).
- A significant demographic segment is the Post-2000s (Gen Z/Alpha) group, representing 50% of guests.
Recommendations for Hosts
- Focus marketing internationally, particularly towards travelers from France.
- Tailor amenities and listing descriptions to appeal to the dominant Post-2000s (Gen Z/Alpha) demographic (e.g., highlight fast WiFi, smart home features, local guides).
- Highlight unique local experiences or amenities relevant to the primary guest profile.
- Consider seasonal promotions aligned with peak travel times for key origin markets.
Nearby Short-Term Rental Market Comparison
How does the Valderice Airbnb market stack up against its neighbors? Compare key performance metrics like average monthly revenue, ADR, and occupancy rates in surrounding areas to understand the broader regional STR landscape.
| Market | Active Properties | Monthly Revenue | Daily Rate | Avg. Occupancy |
|---|---|---|---|---|
| Partinico | 112 | $2,077 | $283.49 | 39% |
| Santa Flavia | 189 | $1,866 | $165.16 | 47% |
| Collesano | 47 | $1,716 | $240.89 | 35% |
| Buseto Palizzolo | 31 | $1,683 | $218.18 | 38% |
| Altavilla Milicia | 79 | $1,568 | $210.58 | 42% |
| Borgetto | 15 | $1,425 | $168.70 | 43% |
| Partanna | 23 | $1,403 | $161.12 | 34% |
| Montallegro | 26 | $1,390 | $159.24 | 43% |
| Marausa | 15 | $1,366 | $207.22 | 30% |
| Alcamo | 300 | $1,330 | $161.45 | 43% |