Tusa Airbnb Market Analysis 2025: Short Term Rental Data & Vacation Rental Statistics in Sicily, Italy
Is Airbnb profitable in Tusa in 2025? Explore comprehensive Airbnb analytics for Tusa, Sicily, Italy to uncover income potential. This 2025 STR market report for Tusa, based on AirROI data from April 2024 to March 2025, reveals key trends in the niche market of 32 active listings.
Whether you're considering an Airbnb investment in Tusa, optimizing your existing vacation rental, or exploring rental arbitrage opportunities, understanding the Tusa Airbnb data is crucial. Navigating the high regulation landscape is key to maximizing your short term rental income potential. Let's dive into the specifics.
Key Tusa Airbnb Performance Metrics Overview
Monthly Airbnb Revenue Variations & Income Potential in Tusa (2025)
Understanding the monthly revenue variations for Airbnb listings in Tusa is key to maximizing your short term rental income potential. Seasonality significantly impacts earnings. Our analysis, based on data from the past 12 months, shows that the peak revenue month for STRs in Tusa is typically April, while March often presents the lowest earnings, highlighting opportunities for strategic pricing adjustments during shoulder and low seasons. Explore the typical Airbnb income in Tusa across different performance tiers:
- Best-in-class properties (Top 10%) achieve $3,211+ monthly, often utilizing dynamic pricing and superior guest experiences.
- Strong performing properties (Top 25%) earn $1,816 or more, indicating effective management and desirable locations/amenities.
- Typical properties (Median) generate around $718 per month, representing the average market performance.
- Entry-level properties (Bottom 25%) see earnings around $281, often with potential for optimization.
Average Monthly Airbnb Earnings Trend in Tusa
Tusa Airbnb Occupancy Rate Trends (2025)
Maximize your bookings by understanding the Tusa STR occupancy trends. Seasonal demand shifts significantly influence how often properties are booked. Typically, Augustsees the highest demand (peak season occupancy), while March experiences the lowest (low season). Effective strategies, like adjusting minimum stays or offering promotions, can boost occupancy during slower periods. Here's how different property tiers perform in Tusa:
- Best-in-class properties (Top 10%) achieve 66%+ occupancy, indicating high desirability and potentially optimized availability.
- Strong performing properties (Top 25%) maintain 43% or higher occupancy, suggesting good market fit and guest satisfaction.
- Typical properties (Median) have an occupancy rate around 24%.
- Entry-level properties (Bottom 25%) average 9% occupancy, potentially facing higher vacancy.
Average Monthly Occupancy Rate Trend in Tusa
Average Daily Rate (ADR) Airbnb Trends in Tusa (2025)
Effective short term rental pricing strategy in Tusa involves understanding monthly ADR fluctuations. The Average Daily Rate (ADR) for Airbnb in Tusa typically peaks in August and dips lowest during December. Leveraging Airbnb dynamic pricing tools or strategies based on this seasonality can significantly boost revenue. Here's a look at the typical nightly rates achieved:
- Best-in-class properties (Top 10%) command rates of $194+ per night, often due to premium features or locations.
- Strong performing properties (Top 25%) achieve nightly rates of $132 or more.
- Typical properties (Median) charge around $92 per night.
- Entry-level properties (Bottom 25%) earn around $69 per night.
Average Daily Rate (ADR) Trend by Month in Tusa
Get Live Tusa Market Intelligence 👇

Explore Real-time Analytics
Airbnb Seasonality Analysis & Trends in Tusa (2025)
Peak Season (April, August, May)
- Revenue averages $1,935 per month
- Occupancy rates average 35.6%
- Daily rates average $110
Shoulder Season
- Revenue averages $1,320 per month
- Occupancy maintains around 32.5%
- Daily rates hold near $109
Low Season (January, February, March)
- Revenue drops to average $708 per month
- Occupancy decreases to average 18.1%
- Daily rates adjust to average $108
Seasonality Insights for Tusa
- The Airbnb seasonality in Tusa shows highly seasonal trends requiring careful strategy. While the sections above show seasonal averages, it's also insightful to look at the extremes:
- During the high season, the absolute peak month showcases Tusa's highest earning potential, with monthly revenues capable of climbing to $2,018, occupancy reaching a high of 50.9%, and ADRs peaking at $115.
- Conversely, the slowest single month of the year, typically falling within the low season, marks the market's lowest point. In this month, revenue might dip to $670, occupancy could drop to 16.8%, and ADRs may adjust down to $104.
- Understanding both the seasonal averages and these monthly peaks and troughs in revenue, occupancy, and ADR is crucial for maximizing your Airbnb profit potential in Tusa.
Seasonal Strategies for Maximizing Profit
- Peak Season: Maximize revenue through premium pricing and potentially longer minimum stays. Ensure high availability.
- Low Season: Offer competitive pricing, special promotions (e.g., extended stay discounts), and flexible cancellation policies. Target off-season travelers like remote workers or budget-conscious guests.
- Shoulder Seasons: Implement dynamic pricing that balances peak and low rates. Target weekend travelers or specific events. Offer slightly more flexible terms than peak season.
- Regularly analyze your own performance against these Tusa seasonality benchmarks and adjust your pricing and availability strategy accordingly.
Best Areas for Airbnb Investment in Tusa (2025)
Exploring the top neighborhoods for short-term rentals in Tusa? This section highlights key areas, outlining why they are attractive for hosts and guests, along with notable local attractions. Consider these locations based on your target guest profile and investment strategy.
| Neighborhood / Area | Why Host Here? (Target Guests & Appeal) | Key Attractions & Landmarks |
|---|---|---|
| Centro Storico | The historic center of Tusa is rich in culture and history, making it a prime location for tourists. Visitors can explore ancient churches and vibrant local markets, experiencing authentic Sicilian life. | Castle of Tusa, Church of San Nicolo, Museo Antiquarium, Piazza della Repubblica, Church of Sant'Antonio |
| Capo Tusa | A stunning coastal area with beautiful beaches and crystal clear waters. It's ideal for travelers looking to relax by the sea and enjoy water sports or sunbathing. | Capo Tusa Beach, Baia dei Saraceni, Scubadiving spots, Snorkeling, Beach clubs |
| Fiumara d'Arte | An open-air museum featuring contemporary sculptures, Fiumara d'Arte attracts art lovers and tourists interested in unique cultural experiences, enhancing the appeal of Tusa as a destination. | Fiumara d'Arte sculptures, Parco dei Pini, Cultural events, Local art galleries |
| Cefalù | Located a short drive from Tusa, Cefalù is a charming coastal town known for its beautiful beaches and medieval architecture. A must-visit for tourists, increasing the demand in nearby Tusa. | Cefalù Cathedral, La Rocca, Spiaggia di Cefalù, Old Town, Museo Mandralisca |
| Cerro di Tusa | This scenic area offers hiking and beautiful landscapes, attracting nature lovers and adventure seekers. It's perfect for eco-tourism promotions and outdoor activities. | Hiking trails, Panoramic views, Nature parks, Wildlife observation |
| Local Vineyards | The surrounding countryside is dotted with local vineyards, perfect for wine enthusiasts. Wine tours and tastings attract many visitors looking for authentic Sicilian experiences. | Wine tasting tours, Vineyard visits, Local gastronomy, Wine festivals |
| Tusa Marina | The marina area offers access to boat rentals and sea excursions. It's a hot spot for tourists who want to explore the coastline and nearby islands. | Boat rentals, Fishing excursions, Seafood restaurants, Water sports activities |
| Natural Reserves | The natural reserves near Tusa provide opportunities for bird watching, hiking, and exploring unique ecosystems. This attracts eco-tourists and families looking for nature retreats. | Riserva Naturale Orientata, Ecotourism activities, Nature trails, Wildlife viewing |
Understanding Airbnb License Requirements & STR Laws in Tusa (2025)
Yes, Tusa, Sicily, Italy enforces high STR regulations. Obtaining a license and ensuring compliance is almost certainly required according to current 2025 STR laws. Always verify the latest short term rental regulations and Airbnb license requirements directly with local government authorities for Tusa to ensure full compliance before hosting.
(Source: AirROI data, 2025, based on 50% licensed listings)
Top Performing Airbnb Properties in Tusa (2025)
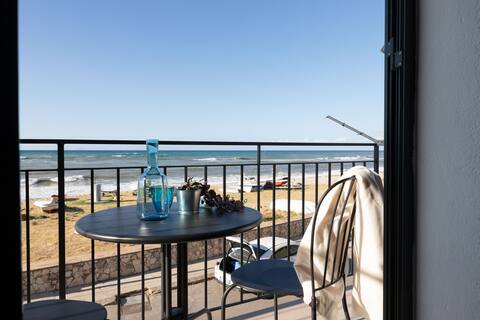
Benchmark your potential! Explore examples of top-performing Airbnb properties in Tusabased on Trailing Twelve Month (TTM) revenue. Analyze their characteristics, revenue, occupancy rate, and ADR to understand what drives success in this market.

Romantic escape for ❤️❤️lovers.......
Entire Place • 1 bedroom
Tusa Bay. Enjoy the sea at 1BR house at the beach.
Entire Place • 1 bedroom

Tusa Bay. Enjoy the sea at 2BR house at the beach.
Entire Place • 2 bedrooms

Stabile Briante (Seaside House)
Entire Place • 2 bedrooms

LUNA ROSSA charming house comfort 💝🔆
Entire Place • 2 bedrooms
Casa cuticchia
Entire Place • 2 bedrooms
Note: Performance varies based on location, size, amenities, seasonality, and management quality. Data reflects the past 12 months.
Top Performing Airbnb Hosts in Tusa (2025)
Learn from the best! This table showcases top-performing Airbnb hosts in Tusa based on the number of properties managed and estimated total revenue over the past year. Analyze their scale and performance metrics.
| Host Name | Properties | Grossing Revenue | Stay Reviews | Avg Rating |
|---|---|---|---|---|
| Alexandros | 2 | $76,541 | 16 | 4.92/5.0 |
| Giuseppe | 2 | $72,200 | 253 | 4.95/5.0 |
| Patrizia | 3 | $19,600 | 18 | 4.60/5.0 |
| Carlo | 1 | $17,134 | 113 | 4.79/5.0 |
| Host #92938717 | 1 | $15,703 | 0 | 0.00/5.0 |
| Maria | 3 | $15,311 | 94 | 4.94/5.0 |
| Rossana | 1 | $13,298 | 21 | 4.86/5.0 |
| Host #153920869 | 1 | $11,473 | 1 | 0.00/5.0 |
| Casavacanze | 2 | $10,475 | 23 | 4.97/5.0 |
| Luigi | 1 | $9,463 | 24 | 4.92/5.0 |
Analyzing the strategies of top hosts, such as their property selection, pricing, and guest communication, can offer valuable lessons for optimizing your own Airbnb operations in Tusa.
Dive Deeper: Advanced Tusa STR Market Data (2025)
Ready to unlock more insights? AirROI provides access to advanced metrics and comprehensive Airbnb data for Tusa. Explore detailed analytics beyond this report to refine your investment strategy, optimize pricing, and maximize your vacation rental profits.
Explore Advanced MetricsTusa Short-Term Rental Market Composition (2025): Property & Room Types
Room Type Distribution
Property Type Distribution
Market Composition Insights for Tusa
- The Tusa Airbnb market composition is heavily skewed towards Entire Home/Apt listings, which make up 100% of the 32 active rentals. This indicates strong guest preference for privacy and space.
- Looking at the property type distribution in Tusa, House properties are the most common (59.4%), reflecting the local real estate landscape.
- Houses represent a significant 59.4% portion, catering likely to families or larger groups.
Tusa Airbnb Room Capacity Analysis (2025): Bedroom Distribution
Distribution of Listings by Number of Bedrooms
Room Capacity Insights for Tusa
- The dominant room capacity in Tusa is 2 bedrooms listings, making up 56.3% of the market. This suggests a strong demand for properties suitable for couples or solo travelers.
- Together, 2 bedrooms and 1 bedroom properties represent 96.9% of the active Airbnb listings in Tusa, indicating a high concentration in these sizes.
- Listings with 3+ bedrooms (3.1%) represent a smaller niche, potentially indicating an underserved market for larger group accommodations in Tusa.
Tusa Vacation Rental Guest Capacity Trends (2025)
Distribution of Listings by Guest Capacity
Guest Capacity Insights for Tusa
- The most common guest capacity trend in Tusa vacation rentals is listings accommodating 4 guests (28.1%). This suggests the primary traveler segment is likely small families or groups.
- Properties designed for 4 guests and 2 guests dominate the Tusa STR market, accounting for 56.2% of listings.
- 15.6% of properties accommodate 6+ guests, serving the market segment for larger families or group travel in Tusa.
- On average, properties in Tusa are equipped to host 3.8 guests.
Tusa Airbnb Booking Patterns (2025): Available vs. Booked Days
Available Days Distribution
Booked Days Distribution
Booking Pattern Insights for Tusa
- The most common availability pattern in Tusa falls within the 271-366 days range, representing 75% of listings. This suggests many properties have significant open periods on their calendars.
- Approximately 93.8% of listings show high availability (181+ days open annually), indicating potential for increased bookings or specific owner usage patterns.
- For booked days, the 31-90 days range is most frequent in Tusa (50%), reflecting common guest stay durations or potential owner blocking patterns.
- A notable 9.4% of properties secure long booking periods (181+ days booked per year), highlighting successful long-term rental strategies or significant owner usage.
Tusa Airbnb Minimum Stay Requirements Analysis
Distribution of Listings by Minimum Night Requirement
1 Night
10 listings
32.3% of total
2 Nights
3 listings
9.7% of total
3 Nights
6 listings
19.4% of total
4-6 Nights
5 listings
16.1% of total
7-29 Nights
5 listings
16.1% of total
30+ Nights
2 listings
6.5% of total
Key Insights
- The most prevalent minimum stay requirement in Tusa is 1 Night, adopted by 32.3% of listings. This highlights the market's preference for shorter, flexible bookings.
Recommendations
- Align with the market by considering a 1 Night minimum stay, as 32.3% of Tusa hosts use this setting.
- Explore offering discounts for stays of 30+ nights to attract the 6.5% of the market seeking extended stays.
- Adjust minimum nights based on seasonality – potentially shorter during low season and longer during peak demand periods in Tusa.
Tusa Airbnb Cancellation Policy Trends Analysis (2025)
Flexible
11 listings
40.7% of total
Moderate
8 listings
29.6% of total
Strict
8 listings
29.6% of total
Cancellation Policy Insights for Tusa
- The prevailing Airbnb cancellation policy trend in Tusa is Flexible, used by 40.7% of listings.
- The market strongly favors guest-friendly terms, with 70.3% of listings offering Flexible or Moderate policies. This suggests guests in Tusa may expect booking flexibility.
Recommendations for Hosts
- Consider adopting a Flexible policy to align with the 40.7% market standard in Tusa.
- Regularly review your cancellation policy against competitors and market demand shifts in Tusa.
Tusa STR Booking Lead Time Analysis (2025)
Average Booking Lead Time by Month
Booking Lead Time Insights for Tusa
- The overall average booking lead time for vacation rentals in Tusa is 63 days.
- Guests book furthest in advance for stays during May (average 133 days), likely coinciding with peak travel demand or local events.
- The shortest booking windows occur for stays in February (average 1 days), indicating more last-minute travel plans during this time.
- Seasonally, Spring (106 days avg.) sees the longest lead times, while Winter (41 days avg.) has the shortest, reflecting typical travel planning cycles.
Recommendations for Hosts
- Use the overall average lead time (63 days) as a baseline for your pricing and availability strategy in Tusa.
- For May stays, consider implementing length-of-stay discounts or slightly higher rates for bookings made less than 133 days out to capitalize on advance planning.
- During February, focus on last-minute booking availability and promotions, as guests book with very short notice (1 days avg.).
- Target marketing efforts for the Spring season well in advance (at least 106 days) to capture early planners.
- Monitor your own booking lead times against these Tusa averages to identify opportunities for dynamic pricing adjustments.
Popular & Essential Airbnb Amenities in Tusa (2025)
Amenity Prevalence
Amenity Insights for Tusa
- Essential amenities in Tusa that guests expect include: Essentials. Lacking these (this) could significantly impact bookings.
- Popular amenities like Kitchen, Hair dryer, Air conditioning are common but not universal. Offering these can provide a competitive edge.
Recommendations for Hosts
- Ensure your listing includes all essential amenities for Tusa: Essentials.
- Prioritize adding missing essentials: Essentials.
- Consider adding popular differentiators like Kitchen or Hair dryer to increase appeal.
- Highlight unique or less common amenities you offer (e.g., hot tub, dedicated workspace, EV charger) in your listing description and photos.
- Regularly check competitor amenities in Tusa to stay competitive.
Tusa Airbnb Guest Demographics & Profile Analysis (2025)
Guest Profile Summary for Tusa
- The typical guest profile for Airbnb in Tusa consists of predominantly international visitors (86%), with top international origins including Germany, typically belonging to the Post-2000s (Gen Z/Alpha) group (50%), primarily speaking English or French.
- Domestic travelers account for 13.9% of guests.
- Key international markets include France (23.8%) and Germany (18.9%).
- Top languages spoken are English (40%) followed by French (14.5%).
- A significant demographic segment is the Post-2000s (Gen Z/Alpha) group, representing 50% of guests.
Recommendations for Hosts
- Focus marketing internationally, particularly towards travelers from Germany.
- Tailor amenities and listing descriptions to appeal to the dominant Post-2000s (Gen Z/Alpha) demographic (e.g., highlight fast WiFi, smart home features, local guides).
- Highlight unique local experiences or amenities relevant to the primary guest profile.
- Consider seasonal promotions aligned with peak travel times for key origin markets.
Nearby Short-Term Rental Market Comparison
How does the Tusa Airbnb market stack up against its neighbors? Compare key performance metrics like average monthly revenue, ADR, and occupancy rates in surrounding areas to understand the broader regional STR landscape.
| Market | Active Properties | Monthly Revenue | Daily Rate | Avg. Occupancy |
|---|---|---|---|---|
| Taormina | 973 | $2,450 | $221.38 | 47% |
| Graniti | 20 | $2,135 | $168.67 | 47% |
| Torregrotta | 16 | $2,105 | $267.72 | 36% |
| Partinico | 112 | $2,077 | $283.49 | 39% |
| Viagrande | 34 | $1,921 | $196.41 | 38% |
| Gaggi | 16 | $1,892 | $190.10 | 40% |
| Santa Venerina | 53 | $1,872 | $219.97 | 41% |
| Santa Flavia | 189 | $1,866 | $165.16 | 47% |
| Cefalù | 1,003 | $1,764 | $182.13 | 48% |
| San Marco d'Alunzio | 13 | $1,726 | $174.71 | 38% |