Trecastagni Airbnb Market Analysis 2025: Short Term Rental Data & Vacation Rental Statistics in Sicily, Italy
Is Airbnb profitable in Trecastagni in 2025? Explore comprehensive Airbnb analytics for Trecastagni, Sicily, Italy to uncover income potential. This 2025 STR market report for Trecastagni, based on AirROI data from April 2024 to March 2025, reveals key trends in the niche market of 53 active listings.
Whether you're considering an Airbnb investment in Trecastagni, optimizing your existing vacation rental, or exploring rental arbitrage opportunities, understanding the Trecastagni Airbnb data is crucial. Navigating the high regulation landscape is key to maximizing your short term rental income potential. Let's dive into the specifics.
Key Trecastagni Airbnb Performance Metrics Overview
Monthly Airbnb Revenue Variations & Income Potential in Trecastagni (2025)
Understanding the monthly revenue variations for Airbnb listings in Trecastagni is key to maximizing your short term rental income potential. Seasonality significantly impacts earnings. Our analysis, based on data from the past 12 months, shows that the peak revenue month for STRs in Trecastagni is typically May, while November often presents the lowest earnings, highlighting opportunities for strategic pricing adjustments during shoulder and low seasons. Explore the typical Airbnb income in Trecastagni across different performance tiers:
- Best-in-class properties (Top 10%) achieve $5,350+ monthly, often utilizing dynamic pricing and superior guest experiences.
- Strong performing properties (Top 25%) earn $2,496 or more, indicating effective management and desirable locations/amenities.
- Typical properties (Median) generate around $1,179 per month, representing the average market performance.
- Entry-level properties (Bottom 25%) see earnings around $492, often with potential for optimization.
Average Monthly Airbnb Earnings Trend in Trecastagni
Trecastagni Airbnb Occupancy Rate Trends (2025)
Maximize your bookings by understanding the Trecastagni STR occupancy trends. Seasonal demand shifts significantly influence how often properties are booked. Typically, Augustsees the highest demand (peak season occupancy), while January experiences the lowest (low season). Effective strategies, like adjusting minimum stays or offering promotions, can boost occupancy during slower periods. Here's how different property tiers perform in Trecastagni:
- Best-in-class properties (Top 10%) achieve 74%+ occupancy, indicating high desirability and potentially optimized availability.
- Strong performing properties (Top 25%) maintain 48% or higher occupancy, suggesting good market fit and guest satisfaction.
- Typical properties (Median) have an occupancy rate around 24%.
- Entry-level properties (Bottom 25%) average 12% occupancy, potentially facing higher vacancy.
Average Monthly Occupancy Rate Trend in Trecastagni
Average Daily Rate (ADR) Airbnb Trends in Trecastagni (2025)
Effective short term rental pricing strategy in Trecastagni involves understanding monthly ADR fluctuations. The Average Daily Rate (ADR) for Airbnb in Trecastagni typically peaks in December and dips lowest during February. Leveraging Airbnb dynamic pricing tools or strategies based on this seasonality can significantly boost revenue. Here's a look at the typical nightly rates achieved:
- Best-in-class properties (Top 10%) command rates of $493+ per night, often due to premium features or locations.
- Strong performing properties (Top 25%) achieve nightly rates of $224 or more.
- Typical properties (Median) charge around $115 per night.
- Entry-level properties (Bottom 25%) earn around $73 per night.
Average Daily Rate (ADR) Trend by Month in Trecastagni
Get Live Trecastagni Market Intelligence 👇

Explore Real-time Analytics
Airbnb Seasonality Analysis & Trends in Trecastagni (2025)
Peak Season (May, June, October)
- Revenue averages $2,932 per month
- Occupancy rates average 34.0%
- Daily rates average $214
Shoulder Season
- Revenue averages $2,081 per month
- Occupancy maintains around 33.5%
- Daily rates hold near $219
Low Season (January, February, November)
- Revenue drops to average $1,322 per month
- Occupancy decreases to average 28.2%
- Daily rates adjust to average $213
Seasonality Insights for Trecastagni
- The Airbnb seasonality in Trecastagni shows highly seasonal trends requiring careful strategy. While the sections above show seasonal averages, it's also insightful to look at the extremes:
- During the high season, the absolute peak month showcases Trecastagni's highest earning potential, with monthly revenues capable of climbing to $3,456, occupancy reaching a high of 40.8%, and ADRs peaking at $244.
- Conversely, the slowest single month of the year, typically falling within the low season, marks the market's lowest point. In this month, revenue might dip to $1,282, occupancy could drop to 25.2%, and ADRs may adjust down to $195.
- Understanding both the seasonal averages and these monthly peaks and troughs in revenue, occupancy, and ADR is crucial for maximizing your Airbnb profit potential in Trecastagni.
Seasonal Strategies for Maximizing Profit
- Peak Season: Maximize revenue through premium pricing and potentially longer minimum stays. Ensure high availability.
- Low Season: Offer competitive pricing, special promotions (e.g., extended stay discounts), and flexible cancellation policies. Target off-season travelers like remote workers or budget-conscious guests.
- Shoulder Seasons: Implement dynamic pricing that balances peak and low rates. Target weekend travelers or specific events. Offer slightly more flexible terms than peak season.
- Regularly analyze your own performance against these Trecastagni seasonality benchmarks and adjust your pricing and availability strategy accordingly.
Best Areas for Airbnb Investment in Trecastagni (2025)
Exploring the top neighborhoods for short-term rentals in Trecastagni? This section highlights key areas, outlining why they are attractive for hosts and guests, along with notable local attractions. Consider these locations based on your target guest profile and investment strategy.
| Neighborhood / Area | Why Host Here? (Target Guests & Appeal) | Key Attractions & Landmarks |
|---|---|---|
| Historic Center | The heart of Trecastagni, with charming narrow streets and traditional Sicilian architecture. Popular among tourists who appreciate historical sites and local culture. | Church of Santa Maria della Consolazione, Piazza dei Martiri, local artisan shops, Sicilian cuisine restaurants, wooden sculptures and crafts |
| Mount Etna | Nearby Mount Etna is a major attraction for adventure seekers and nature lovers. Trecastagni offers stunning views and is a base for excursions. | Mount Etna National Park, hiking trails, wine tours, volcanic landscapes, Etna cable car |
| Parco dell'Etna | A beautiful nature park at the outskirts of Trecastagni, offering outdoor activities and scenic experiences for families and adventurers. | nature trails, picnic areas, wildlife watching, educational visitor center, breathtaking views |
| Local Wineries | Trecastagni is known for its production of wine, particularly from the slopes of Mount Etna. Wine tourism is a growing market. | Etna wine tasting tours, vineyard visits, local wine shops, wine festivals, traditional wine cellars |
| Cultural Festivals | Trecastagni hosts various cultural festivals throughout the year, attracting visitors looking to experience local traditions and celebrations. | Festivals of Saint Joseph, Carnival in Trecastagni, local food markets, ethnic music and dance performances, street fairs |
| Etna Scenic Drives | The scenic drives around Mount Etna are popular for tourists who want to enjoy breathtaking landscapes and picturesque views. | Scenic viewpoints, photography spots, driving tours, local eateries along the route, wineries and vineyards |
| Local Cuisine | Trecastagni is famous for its traditional Sicilian dishes. Tourists often seek out authentic dining experiences here. | local trattorias, Sicilian street food, cooking classes, food markets, gastronomic festivals |
| Access to Catania | Proximity to Catania provides easy access to urban amenities, shopping, and public transport for guests. | Catania market, Castello Ursino, Monastero dei Benedettini, Piazza del Duomo, Catania nightlife |
Understanding Airbnb License Requirements & STR Laws in Trecastagni (2025)
Yes, Trecastagni, Sicily, Italy enforces high STR regulations. Obtaining a license and ensuring compliance is almost certainly required according to current 2025 STR laws. Always verify the latest short term rental regulations and Airbnb license requirements directly with local government authorities for Trecastagni to ensure full compliance before hosting.
(Source: AirROI data, 2025, based on 49% licensed listings)
Top Performing Airbnb Properties in Trecastagni (2025)
Benchmark your potential! Explore examples of top-performing Airbnb properties in Trecastagnibased on Trailing Twelve Month (TTM) revenue. Analyze their characteristics, revenue, occupancy rate, and ADR to understand what drives success in this market.

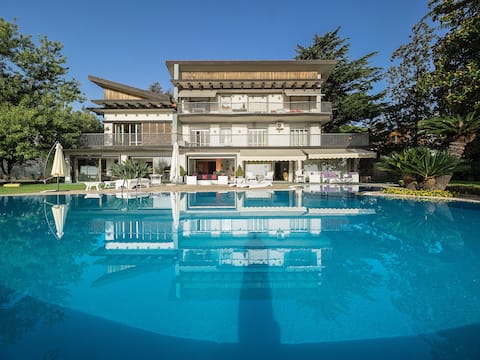
Villa with pool and huge garden, near mount Etna
Entire Place • 6 bedrooms
Villa Ninina in the Heart of Etna Park x10
Entire Place • 5 bedrooms
With private pool on the Etna-flanks (22 sleeps)
Entire Place • 10 bedrooms
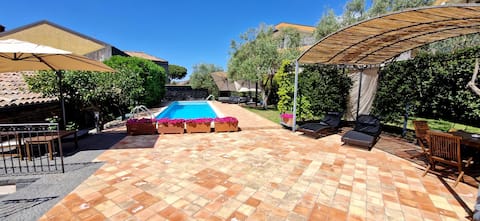
Villa with antique charm and modern comfort
Entire Place • 3 bedrooms
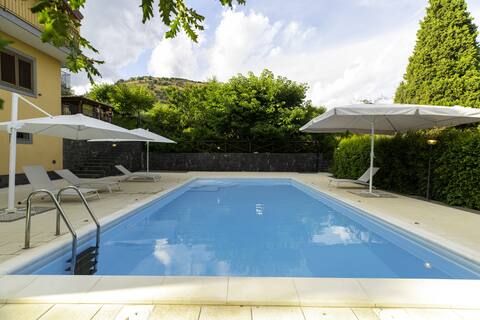
Villa Sara sul Etna with Pool
Entire Place • 4 bedrooms
Villa dei Ciliegi con piscina e parco privato
Entire Place • 6 bedrooms
Note: Performance varies based on location, size, amenities, seasonality, and management quality. Data reflects the past 12 months.
Top Performing Airbnb Hosts in Trecastagni (2025)
Learn from the best! This table showcases top-performing Airbnb hosts in Trecastagni based on the number of properties managed and estimated total revenue over the past year. Analyze their scale and performance metrics.
| Host Name | Properties | Grossing Revenue | Stay Reviews | Avg Rating |
|---|---|---|---|---|
| Paul | 1 | $107,458 | 128 | 4.91/5.0 |
| Welcome To Italy | 2 | $104,240 | 34 | 4.46/5.0 |
| Giulia | 1 | $69,212 | 30 | 4.80/5.0 |
| Luciano | 3 | $60,828 | 24 | 4.81/5.0 |
| Giuseppe Riggio | 2 | $49,289 | 105 | 4.92/5.0 |
| Luciano | 1 | $48,729 | 14 | 5.00/5.0 |
| Holidu | 1 | $44,855 | 15 | 4.87/5.0 |
| Host #13725561 | 1 | $38,569 | 13 | 4.31/5.0 |
| Ivano | 2 | $36,866 | 18 | 2.50/5.0 |
| Orazio | 1 | $34,570 | 19 | 4.95/5.0 |
Analyzing the strategies of top hosts, such as their property selection, pricing, and guest communication, can offer valuable lessons for optimizing your own Airbnb operations in Trecastagni.
Dive Deeper: Advanced Trecastagni STR Market Data (2025)
Ready to unlock more insights? AirROI provides access to advanced metrics and comprehensive Airbnb data for Trecastagni. Explore detailed analytics beyond this report to refine your investment strategy, optimize pricing, and maximize your vacation rental profits.
Explore Advanced MetricsTrecastagni Short-Term Rental Market Composition (2025): Property & Room Types
Room Type Distribution
Property Type Distribution
Market Composition Insights for Trecastagni
- The Trecastagni Airbnb market composition is heavily skewed towards Entire Home/Apt listings, which make up 83% of the 53 active rentals. This indicates strong guest preference for privacy and space.
- Looking at the property type distribution in Trecastagni, House properties are the most common (75.5%), reflecting the local real estate landscape.
- Houses represent a significant 75.5% portion, catering likely to families or larger groups.
- The presence of 9.4% Hotel/Boutique listings indicates integration with traditional hospitality.
- Smaller segments like outdoor/unique (combined 1.9%) offer potential for unique stay experiences.
Trecastagni Airbnb Room Capacity Analysis (2025): Bedroom Distribution
Distribution of Listings by Number of Bedrooms
Room Capacity Insights for Trecastagni
- The dominant room capacity in Trecastagni is 2 bedrooms listings, making up 28.3% of the market. This suggests a strong demand for properties suitable for couples or solo travelers.
- Together, 2 bedrooms and 1 bedroom properties represent 54.7% of the active Airbnb listings in Trecastagni, indicating a high concentration in these sizes.
- A significant 37.7% of listings offer 3+ bedrooms, catering to larger groups and families seeking more space in Trecastagni.
Trecastagni Vacation Rental Guest Capacity Trends (2025)
Distribution of Listings by Guest Capacity
Guest Capacity Insights for Trecastagni
- The most common guest capacity trend in Trecastagni vacation rentals is listings accommodating 8+ guests (24.5%). This suggests the primary traveler segment is likely larger groups.
- Properties designed for 8+ guests and 4 guests dominate the Trecastagni STR market, accounting for 43.4% of listings.
- 43.4% of properties accommodate 6+ guests, serving the market segment for larger families or group travel in Trecastagni.
- On average, properties in Trecastagni are equipped to host 4.8 guests.
Trecastagni Airbnb Booking Patterns (2025): Available vs. Booked Days
Available Days Distribution
Booked Days Distribution
Booking Pattern Insights for Trecastagni
- The most common availability pattern in Trecastagni falls within the 271-366 days range, representing 62.3% of listings. This suggests many properties have significant open periods on their calendars.
- Approximately 84.9% of listings show high availability (181+ days open annually), indicating potential for increased bookings or specific owner usage patterns.
- For booked days, the 31-90 days range is most frequent in Trecastagni (37.7%), reflecting common guest stay durations or potential owner blocking patterns.
- A notable 15.1% of properties secure long booking periods (181+ days booked per year), highlighting successful long-term rental strategies or significant owner usage.
Trecastagni Airbnb Minimum Stay Requirements Analysis
Distribution of Listings by Minimum Night Requirement
1 Night
11 listings
21.6% of total
2 Nights
10 listings
19.6% of total
3 Nights
9 listings
17.6% of total
4-6 Nights
5 listings
9.8% of total
7-29 Nights
10 listings
19.6% of total
30+ Nights
6 listings
11.8% of total
Key Insights
- The most prevalent minimum stay requirement in Trecastagni is 1 Night, adopted by 21.6% of listings. This highlights the market's preference for shorter, flexible bookings.
- A significant segment (11.8%) caters to monthly stays (30+ nights) in Trecastagni, pointing to opportunities in the extended-stay market.
Recommendations
- Align with the market by considering a 1 Night minimum stay, as 21.6% of Trecastagni hosts use this setting.
- If feasible, allowing 1-night stays, especially midweek or during low season, could capture last-minute bookings, as only 21.6% currently do.
- Explore offering discounts for stays of 30+ nights to attract the 11.8% of the market seeking extended stays.
- Adjust minimum nights based on seasonality – potentially shorter during low season and longer during peak demand periods in Trecastagni.
Trecastagni Airbnb Cancellation Policy Trends Analysis (2025)
Super Strict 30 Days
3 listings
8.1% of total
Super Strict 60 Days
2 listings
5.4% of total
Flexible
7 listings
18.9% of total
Moderate
22 listings
59.5% of total
Strict
3 listings
8.1% of total
Cancellation Policy Insights for Trecastagni
- The prevailing Airbnb cancellation policy trend in Trecastagni is Moderate, used by 59.5% of listings.
- The market strongly favors guest-friendly terms, with 78.4% of listings offering Flexible or Moderate policies. This suggests guests in Trecastagni may expect booking flexibility.
- Strict cancellation policies are quite rare (8.1%), potentially making listings with this policy less competitive unless justified by high demand or property type.
Recommendations for Hosts
- Consider adopting a Moderate policy to align with the 59.5% market standard in Trecastagni.
- Using a Strict policy might deter some guests, as only 8.1% of listings use it. Evaluate if potential revenue protection outweighs possible lower booking rates.
- Regularly review your cancellation policy against competitors and market demand shifts in Trecastagni.
Trecastagni STR Booking Lead Time Analysis (2025)
Average Booking Lead Time by Month
Booking Lead Time Insights for Trecastagni
- The overall average booking lead time for vacation rentals in Trecastagni is 55 days.
- Guests book furthest in advance for stays during May (average 110 days), likely coinciding with peak travel demand or local events.
- The shortest booking windows occur for stays in February (average 32 days), indicating more last-minute travel plans during this time.
- Seasonally, Summer (83 days avg.) sees the longest lead times, while Winter (36 days avg.) has the shortest, reflecting typical travel planning cycles.
Recommendations for Hosts
- Use the overall average lead time (55 days) as a baseline for your pricing and availability strategy in Trecastagni.
- For May stays, consider implementing length-of-stay discounts or slightly higher rates for bookings made less than 110 days out to capitalize on advance planning.
- Target marketing efforts for the Summer season well in advance (at least 83 days) to capture early planners.
- Monitor your own booking lead times against these Trecastagni averages to identify opportunities for dynamic pricing adjustments.
Popular & Essential Airbnb Amenities in Trecastagni (2025)
Amenity Prevalence
Amenity Insights for Trecastagni
- Essential amenities in Trecastagni that guests expect include: Essentials, TV. Lacking these (any) could significantly impact bookings.
- Popular amenities like Heating, Kitchen, Wifi are common but not universal. Offering these can provide a competitive edge.
- Warning: Wifi is not universally provided but is considered essential globally. Ensure reliable Wifi is offered.
Recommendations for Hosts
- Ensure your listing includes all essential amenities for Trecastagni: Essentials, TV.
- Prioritize adding missing essentials: Essentials, TV.
- Consider adding popular differentiators like Heating or Kitchen to increase appeal.
- Highlight unique or less common amenities you offer (e.g., hot tub, dedicated workspace, EV charger) in your listing description and photos.
- Regularly check competitor amenities in Trecastagni to stay competitive.
Trecastagni Airbnb Guest Demographics & Profile Analysis (2025)
Guest Profile Summary for Trecastagni
- The typical guest profile for Airbnb in Trecastagni consists of predominantly international visitors (88%), with top international origins including United Kingdom, typically belonging to the Post-2000s (Gen Z/Alpha) group (50%), primarily speaking English or French.
- Domestic travelers account for 12.1% of guests.
- Key international markets include France (19.8%) and United Kingdom (14.8%).
- Top languages spoken are English (38.7%) followed by French (14.7%).
- A significant demographic segment is the Post-2000s (Gen Z/Alpha) group, representing 50% of guests.
Recommendations for Hosts
- Focus marketing internationally, particularly towards travelers from United Kingdom.
- Tailor amenities and listing descriptions to appeal to the dominant Post-2000s (Gen Z/Alpha) demographic (e.g., highlight fast WiFi, smart home features, local guides).
- Highlight unique local experiences or amenities relevant to the primary guest profile.
- Consider seasonal promotions aligned with peak travel times for key origin markets.
Nearby Short-Term Rental Market Comparison
How does the Trecastagni Airbnb market stack up against its neighbors? Compare key performance metrics like average monthly revenue, ADR, and occupancy rates in surrounding areas to understand the broader regional STR landscape.
| Market | Active Properties | Monthly Revenue | Daily Rate | Avg. Occupancy |
|---|---|---|---|---|
| Taormina | 973 | $2,450 | $221.38 | 47% |
| Għasri | 56 | $2,339 | $216.90 | 40% |
| Graniti | 20 | $2,135 | $168.67 | 47% |
| Torregrotta | 16 | $2,105 | $267.72 | 36% |
| Viagrande | 34 | $1,921 | $196.41 | 38% |
| Gaggi | 16 | $1,892 | $190.10 | 40% |
| Santa Venerina | 53 | $1,872 | $219.97 | 41% |
| Xewkija | 36 | $1,766 | $167.34 | 43% |
| Cefalù | 1,003 | $1,764 | $182.13 | 48% |
| San Marco d'Alunzio | 13 | $1,726 | $174.71 | 38% |