Santo Stefano di Camastra Airbnb Market Analysis 2025: Short Term Rental Data & Vacation Rental Statistics in Sicily, Italy
Is Airbnb profitable in Santo Stefano di Camastra in 2025? Explore comprehensive Airbnb analytics for Santo Stefano di Camastra, Sicily, Italy to uncover income potential. This 2025 STR market report for Santo Stefano di Camastra, based on AirROI data from April 2024 to March 2025, reveals key trends in the niche market of 53 active listings.
Whether you're considering an Airbnb investment in Santo Stefano di Camastra, optimizing your existing vacation rental, or exploring rental arbitrage opportunities, understanding the Santo Stefano di Camastra Airbnb data is crucial. Navigating the high regulation landscape is key to maximizing your short term rental income potential. Let's dive into the specifics.
Key Santo Stefano di Camastra Airbnb Performance Metrics Overview
Monthly Airbnb Revenue Variations & Income Potential in Santo Stefano di Camastra (2025)
Understanding the monthly revenue variations for Airbnb listings in Santo Stefano di Camastra is key to maximizing your short term rental income potential. Seasonality significantly impacts earnings. Our analysis, based on data from the past 12 months, shows that the peak revenue month for STRs in Santo Stefano di Camastra is typically August, while February often presents the lowest earnings, highlighting opportunities for strategic pricing adjustments during shoulder and low seasons. Explore the typical Airbnb income in Santo Stefano di Camastra across different performance tiers:
- Best-in-class properties (Top 10%) achieve $1,924+ monthly, often utilizing dynamic pricing and superior guest experiences.
- Strong performing properties (Top 25%) earn $1,242 or more, indicating effective management and desirable locations/amenities.
- Typical properties (Median) generate around $583 per month, representing the average market performance.
- Entry-level properties (Bottom 25%) see earnings around $262, often with potential for optimization.
Average Monthly Airbnb Earnings Trend in Santo Stefano di Camastra
Santo Stefano di Camastra Airbnb Occupancy Rate Trends (2025)
Maximize your bookings by understanding the Santo Stefano di Camastra STR occupancy trends. Seasonal demand shifts significantly influence how often properties are booked. Typically, Augustsees the highest demand (peak season occupancy), while February experiences the lowest (low season). Effective strategies, like adjusting minimum stays or offering promotions, can boost occupancy during slower periods. Here's how different property tiers perform in Santo Stefano di Camastra:
- Best-in-class properties (Top 10%) achieve 53%+ occupancy, indicating high desirability and potentially optimized availability.
- Strong performing properties (Top 25%) maintain 39% or higher occupancy, suggesting good market fit and guest satisfaction.
- Typical properties (Median) have an occupancy rate around 23%.
- Entry-level properties (Bottom 25%) average 11% occupancy, potentially facing higher vacancy.
Average Monthly Occupancy Rate Trend in Santo Stefano di Camastra
Average Daily Rate (ADR) Airbnb Trends in Santo Stefano di Camastra (2025)
Effective short term rental pricing strategy in Santo Stefano di Camastra involves understanding monthly ADR fluctuations. The Average Daily Rate (ADR) for Airbnb in Santo Stefano di Camastra typically peaks in August and dips lowest during March. Leveraging Airbnb dynamic pricing tools or strategies based on this seasonality can significantly boost revenue. Here's a look at the typical nightly rates achieved:
- Best-in-class properties (Top 10%) command rates of $126+ per night, often due to premium features or locations.
- Strong performing properties (Top 25%) achieve nightly rates of $92 or more.
- Typical properties (Median) charge around $77 per night.
- Entry-level properties (Bottom 25%) earn around $62 per night.
Average Daily Rate (ADR) Trend by Month in Santo Stefano di Camastra
Get Live Santo Stefano di Camastra Market Intelligence 👇

Explore Real-time Analytics
Airbnb Seasonality Analysis & Trends in Santo Stefano di Camastra (2025)
Peak Season (August, July, May)
- Revenue averages $1,660 per month
- Occupancy rates average 42.1%
- Daily rates average $107
Shoulder Season
- Revenue averages $835 per month
- Occupancy maintains around 25.3%
- Daily rates hold near $92
Low Season (January, February, December)
- Revenue drops to average $367 per month
- Occupancy decreases to average 16.2%
- Daily rates adjust to average $79
Seasonality Insights for Santo Stefano di Camastra
- The Airbnb seasonality in Santo Stefano di Camastra shows highly seasonal trends requiring careful strategy. While the sections above show seasonal averages, it's also insightful to look at the extremes:
- During the high season, the absolute peak month showcases Santo Stefano di Camastra's highest earning potential, with monthly revenues capable of climbing to $1,784, occupancy reaching a high of 48.9%, and ADRs peaking at $115.
- Conversely, the slowest single month of the year, typically falling within the low season, marks the market's lowest point. In this month, revenue might dip to $313, occupancy could drop to 15.8%, and ADRs may adjust down to $78.
- Understanding both the seasonal averages and these monthly peaks and troughs in revenue, occupancy, and ADR is crucial for maximizing your Airbnb profit potential in Santo Stefano di Camastra.
Seasonal Strategies for Maximizing Profit
- Peak Season: Maximize revenue through premium pricing and potentially longer minimum stays. Ensure high availability.
- Low Season: Offer competitive pricing, special promotions (e.g., extended stay discounts), and flexible cancellation policies. Target off-season travelers like remote workers or budget-conscious guests.
- Shoulder Seasons: Implement dynamic pricing that balances peak and low rates. Target weekend travelers or specific events. Offer slightly more flexible terms than peak season.
- Regularly analyze your own performance against these Santo Stefano di Camastra seasonality benchmarks and adjust your pricing and availability strategy accordingly.
Best Areas for Airbnb Investment in Santo Stefano di Camastra (2025)
Exploring the top neighborhoods for short-term rentals in Santo Stefano di Camastra? This section highlights key areas, outlining why they are attractive for hosts and guests, along with notable local attractions. Consider these locations based on your target guest profile and investment strategy.
| Neighborhood / Area | Why Host Here? (Target Guests & Appeal) | Key Attractions & Landmarks |
|---|---|---|
| Centro Storico | The historic center of Santo Stefano di Camastra, known for its charming streets, local shops, and traditional Sicilian architecture. It attracts tourists interested in culture and history, providing an authentic experience. | Church of San Giuseppe, Ceramics Museum, Local artisan shops, Piazza Matteotti |
| Spiaggia di Calatabiano | A stunning beach area close to Santo Stefano, perfect for vacationers looking for sun and relaxation. This area offers easy access to the coast and beautiful scenery. | Beachfront restaurants, Water sports, Scenic views, Relaxing beach lounges |
| Castello di Milazzo | Nearby historical castle offering rich history and breathtaking views. A favorite spot for day trips, attracting both tourists and locals. | Historic castle, Stunning panoramic views, Picnic areas, Nearby beaches |
| Parco dei Nebrodi | A natural park located a short drive away, perfect for nature lovers and outdoor activities. An excellent getaway for hosts wanting to attract eco-tourists. | Hiking trails, Wildlife watching, Scenic landscapes, Traditional Sicilian villages |
| Cefalù | A beautiful coastal town that is a popular tourist destination due to its sandy beaches and medieval architecture. An excellent location for attracting vacationers. | Cefalù Cathedral, La Rocca, Long sandy beaches, Charming old town |
| Tindari | Home to the ancient Greek theater and stunning views of the coastline. This area attracts cultural tourists and those interested in history. | Ancient Greek theater, Sanctuary of Tindari, Beautiful coastal views |
| Salina | One of the Aeolian Islands known for its beautiful landscapes and local wineries. A great location for tourists seeking a unique island experience. | Vineyards, Beautiful beaches, Hiking trails, Local seafood restaurants |
| Patti | A coastal city known for its beaches and archaeological sites. It offers a range of attractions from historical sites to modern amenities, appealing to a variety of travelers. | Roman villa, Patti's beach, Shopping areas, Dining options |
Understanding Airbnb License Requirements & STR Laws in Santo Stefano di Camastra (2025)
Yes, Santo Stefano di Camastra, Sicily, Italy enforces high STR regulations. Obtaining a license and ensuring compliance is almost certainly required according to current 2025 STR laws. Always verify the latest short term rental regulations and Airbnb license requirements directly with local government authorities for Santo Stefano di Camastra to ensure full compliance before hosting.
(Source: AirROI data, 2025, based on 53% licensed listings)
Top Performing Airbnb Properties in Santo Stefano di Camastra (2025)
Benchmark your potential! Explore examples of top-performing Airbnb properties in Santo Stefano di Camastrabased on Trailing Twelve Month (TTM) revenue. Analyze their characteristics, revenue, occupancy rate, and ADR to understand what drives success in this market.
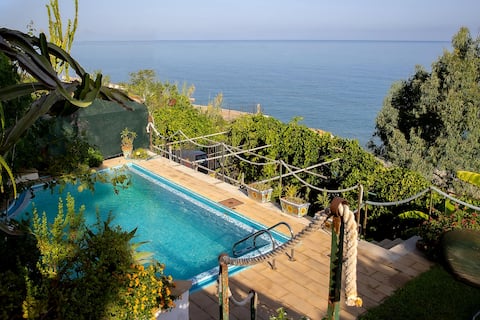
Villa Con Piscina Vista Mare
Entire Place • 3 bedrooms

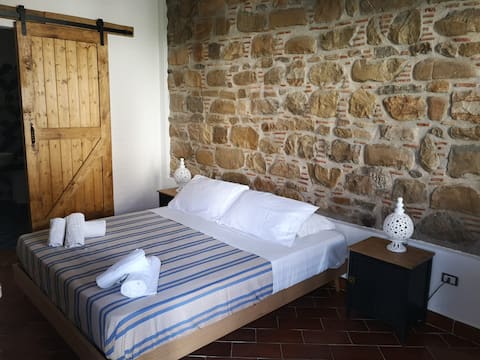
among olive trees + hot tub + 150 from the beach
Entire Place • 1 bedroom
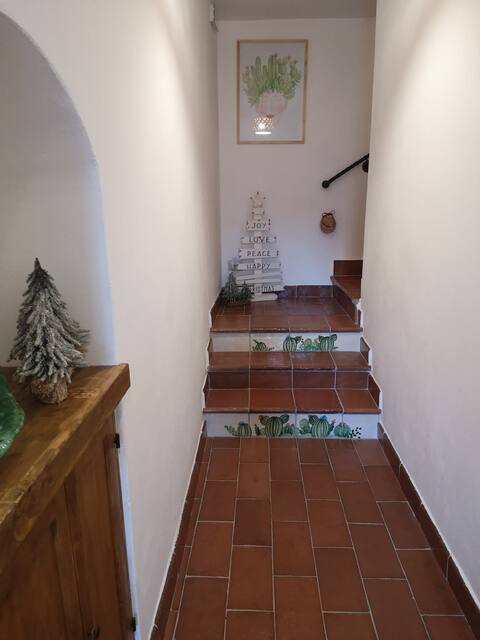
Ficodindia apartaments - Anemone
Entire Place • 1 bedroom

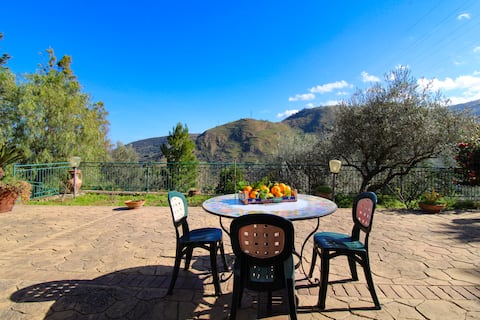
Sea View Penthouse with Terrace & Heated Spa
Entire Place • 1 bedroom
Ficodindia Appartament
Entire Place • 2 bedrooms
Private villa, free entry to exclusive beach club
Entire Place • 4 bedrooms
Note: Performance varies based on location, size, amenities, seasonality, and management quality. Data reflects the past 12 months.
Top Performing Airbnb Hosts in Santo Stefano di Camastra (2025)
Learn from the best! This table showcases top-performing Airbnb hosts in Santo Stefano di Camastra based on the number of properties managed and estimated total revenue over the past year. Analyze their scale and performance metrics.
| Host Name | Properties | Grossing Revenue | Stay Reviews | Avg Rating |
|---|---|---|---|---|
| Viviana | 4 | $64,389 | 48 | 4.88/5.0 |
| Holidu | 1 | $55,701 | 13 | 4.46/5.0 |
| Francesco | 3 | $53,803 | 122 | 4.77/5.0 |
| Leonardo | 8 | $39,584 | 46 | 2.45/5.0 |
| Andrea | 3 | $20,709 | 14 | 1.54/5.0 |
| Therese Martha | 1 | $19,970 | 51 | 4.67/5.0 |
| Host #332228995 | 1 | $17,289 | 6 | 4.83/5.0 |
| Dario | 3 | $16,847 | 428 | 4.88/5.0 |
| Antonella | 3 | $15,745 | 16 | 3.33/5.0 |
| Isidoro | 1 | $13,051 | 21 | 4.95/5.0 |
Analyzing the strategies of top hosts, such as their property selection, pricing, and guest communication, can offer valuable lessons for optimizing your own Airbnb operations in Santo Stefano di Camastra.
Dive Deeper: Advanced Santo Stefano di Camastra STR Market Data (2025)
Ready to unlock more insights? AirROI provides access to advanced metrics and comprehensive Airbnb data for Santo Stefano di Camastra. Explore detailed analytics beyond this report to refine your investment strategy, optimize pricing, and maximize your vacation rental profits.
Explore Advanced MetricsSanto Stefano di Camastra Short-Term Rental Market Composition (2025): Property & Room Types
Room Type Distribution
Property Type Distribution
Market Composition Insights for Santo Stefano di Camastra
- The Santo Stefano di Camastra Airbnb market composition is heavily skewed towards Entire Home/Apt listings, which make up 66% of the 53 active rentals. This indicates strong guest preference for privacy and space.
- However, a notable 34% share for Private Rooms suggests opportunities for budget-conscious travelers or hosts renting out spare rooms.
- Looking at the property type distribution in Santo Stefano di Camastra, Apartment/Condo properties are the most common (45.3%), reflecting the local real estate landscape.
- Houses represent a significant 26.4% portion, catering likely to families or larger groups.
- The presence of 26.4% Hotel/Boutique listings indicates integration with traditional hospitality.
- Smaller segments like outdoor/unique (combined 1.9%) offer potential for unique stay experiences.
Santo Stefano di Camastra Airbnb Room Capacity Analysis (2025): Bedroom Distribution
Distribution of Listings by Number of Bedrooms
Room Capacity Insights for Santo Stefano di Camastra
- The dominant room capacity in Santo Stefano di Camastra is 1 bedroom listings, making up 56.6% of the market. This suggests a strong demand for properties suitable for couples or solo travelers.
- Together, 1 bedroom and 2 bedrooms properties represent 79.2% of the active Airbnb listings in Santo Stefano di Camastra, indicating a high concentration in these sizes.
- With over half the market (56.6%) consisting of studios or 1-bedroom units, Santo Stefano di Camastra is particularly well-suited for individuals or couples.
- Listings with 3+ bedrooms (7.6%) represent a smaller niche, potentially indicating an underserved market for larger group accommodations in Santo Stefano di Camastra.
Santo Stefano di Camastra Vacation Rental Guest Capacity Trends (2025)
Distribution of Listings by Guest Capacity
Guest Capacity Insights for Santo Stefano di Camastra
- The most common guest capacity trend in Santo Stefano di Camastra vacation rentals is listings accommodating 4 guests (22.6%). This suggests the primary traveler segment is likely small families or groups.
- Properties designed for 4 guests and 2 guests dominate the Santo Stefano di Camastra STR market, accounting for 45.2% of listings.
- 18.8% of properties accommodate 6+ guests, serving the market segment for larger families or group travel in Santo Stefano di Camastra.
- On average, properties in Santo Stefano di Camastra are equipped to host 3.4 guests.
Santo Stefano di Camastra Airbnb Booking Patterns (2025): Available vs. Booked Days
Available Days Distribution
Booked Days Distribution
Booking Pattern Insights for Santo Stefano di Camastra
- The most common availability pattern in Santo Stefano di Camastra falls within the 271-366 days range, representing 75.5% of listings. This suggests many properties have significant open periods on their calendars.
- Approximately 92.5% of listings show high availability (181+ days open annually), indicating potential for increased bookings or specific owner usage patterns.
- For booked days, the 31-90 days range is most frequent in Santo Stefano di Camastra (41.5%), reflecting common guest stay durations or potential owner blocking patterns.
- A notable 7.5% of properties secure long booking periods (181+ days booked per year), highlighting successful long-term rental strategies or significant owner usage.
Santo Stefano di Camastra Airbnb Minimum Stay Requirements Analysis
Distribution of Listings by Minimum Night Requirement
1 Night
23 listings
46% of total
2 Nights
13 listings
26% of total
3 Nights
3 listings
6% of total
4-6 Nights
2 listings
4% of total
7-29 Nights
5 listings
10% of total
30+ Nights
4 listings
8% of total
Key Insights
- The most prevalent minimum stay requirement in Santo Stefano di Camastra is 1 Night, adopted by 46% of listings. This highlights the market's preference for shorter, flexible bookings.
- A strong majority (72.0%) of the Santo Stefano di Camastra Airbnb data shows acceptance of very short stays (1-2 nights), indicating a dynamic, high-turnover market.
Recommendations
- Align with the market by considering a 1 Night minimum stay, as 46% of Santo Stefano di Camastra hosts use this setting.
- Explore offering discounts for stays of 30+ nights to attract the 8% of the market seeking extended stays.
- Adjust minimum nights based on seasonality – potentially shorter during low season and longer during peak demand periods in Santo Stefano di Camastra.
Santo Stefano di Camastra Airbnb Cancellation Policy Trends Analysis (2025)
Super Strict 30 Days
4 listings
11.1% of total
Flexible
9 listings
25% of total
Moderate
12 listings
33.3% of total
Strict
11 listings
30.6% of total
Cancellation Policy Insights for Santo Stefano di Camastra
- The prevailing Airbnb cancellation policy trend in Santo Stefano di Camastra is Moderate, used by 33.3% of listings.
- There's a relatively balanced mix between guest-friendly (58.3%) and stricter (30.6%) policies, offering choices for different guest needs.
Recommendations for Hosts
- Consider adopting a Moderate policy to align with the 33.3% market standard in Santo Stefano di Camastra.
- With 30.6% using Strict terms, this is a viable option in Santo Stefano di Camastra, particularly for high-value properties or during peak demand periods.
- Regularly review your cancellation policy against competitors and market demand shifts in Santo Stefano di Camastra.
Santo Stefano di Camastra STR Booking Lead Time Analysis (2025)
Average Booking Lead Time by Month
Booking Lead Time Insights for Santo Stefano di Camastra
- The overall average booking lead time for vacation rentals in Santo Stefano di Camastra is 31 days.
- Guests book furthest in advance for stays during July (average 68 days), likely coinciding with peak travel demand or local events.
- The shortest booking windows occur for stays in November (average 18 days), indicating more last-minute travel plans during this time.
- Seasonally, Summer (53 days avg.) sees the longest lead times, while Winter (26 days avg.) has the shortest, reflecting typical travel planning cycles.
Recommendations for Hosts
- Use the overall average lead time (31 days) as a baseline for your pricing and availability strategy in Santo Stefano di Camastra.
- For July stays, consider implementing length-of-stay discounts or slightly higher rates for bookings made less than 68 days out to capitalize on advance planning.
- Target marketing efforts for the Summer season well in advance (at least 53 days) to capture early planners.
- Monitor your own booking lead times against these Santo Stefano di Camastra averages to identify opportunities for dynamic pricing adjustments.
Popular & Essential Airbnb Amenities in Santo Stefano di Camastra (2025)
Amenity Prevalence
Amenity Insights for Santo Stefano di Camastra
- Essential amenities in Santo Stefano di Camastra that guests expect include: Air conditioning, Kitchen. Lacking these (any) could significantly impact bookings.
- Popular amenities like TV, Essentials, Hot water are common but not universal. Offering these can provide a competitive edge.
- Warning: Wifi is not universally provided but is considered essential globally. Ensure reliable Wifi is offered.
Recommendations for Hosts
- Ensure your listing includes all essential amenities for Santo Stefano di Camastra: Air conditioning, Kitchen.
- Prioritize adding missing essentials: Air conditioning, Kitchen.
- Consider adding popular differentiators like TV or Essentials to increase appeal.
- Highlight unique or less common amenities you offer (e.g., hot tub, dedicated workspace, EV charger) in your listing description and photos.
- Regularly check competitor amenities in Santo Stefano di Camastra to stay competitive.
Santo Stefano di Camastra Airbnb Guest Demographics & Profile Analysis (2025)
Guest Profile Summary for Santo Stefano di Camastra
- The typical guest profile for Airbnb in Santo Stefano di Camastra consists of predominantly international visitors (88%), with top international origins including Germany, typically belonging to the Post-2000s (Gen Z/Alpha) group (50%), primarily speaking English or French.
- Domestic travelers account for 11.7% of guests.
- Key international markets include France (23%) and Germany (20.2%).
- Top languages spoken are English (41.4%) followed by French (16.9%).
- A significant demographic segment is the Post-2000s (Gen Z/Alpha) group, representing 50% of guests.
Recommendations for Hosts
- Focus marketing internationally, particularly towards travelers from Germany.
- Tailor amenities and listing descriptions to appeal to the dominant Post-2000s (Gen Z/Alpha) demographic (e.g., highlight fast WiFi, smart home features, local guides).
- Highlight unique local experiences or amenities relevant to the primary guest profile.
- Consider seasonal promotions aligned with peak travel times for key origin markets.
Nearby Short-Term Rental Market Comparison
How does the Santo Stefano di Camastra Airbnb market stack up against its neighbors? Compare key performance metrics like average monthly revenue, ADR, and occupancy rates in surrounding areas to understand the broader regional STR landscape.
| Market | Active Properties | Monthly Revenue | Daily Rate | Avg. Occupancy |
|---|---|---|---|---|
| Taormina | 973 | $2,450 | $221.38 | 47% |
| Graniti | 20 | $2,135 | $168.67 | 47% |
| Torregrotta | 16 | $2,105 | $267.72 | 36% |
| Partinico | 112 | $2,077 | $283.49 | 39% |
| Viagrande | 34 | $1,921 | $196.41 | 38% |
| Gaggi | 16 | $1,892 | $190.10 | 40% |
| Santa Venerina | 53 | $1,872 | $219.97 | 41% |
| Santa Flavia | 189 | $1,866 | $165.16 | 47% |
| Cefalù | 1,003 | $1,764 | $182.13 | 48% |
| San Marco d'Alunzio | 13 | $1,726 | $174.71 | 38% |