Santa Venerina Airbnb Market Analysis 2025: Short Term Rental Data & Vacation Rental Statistics in Sicily, Italy
Is Airbnb profitable in Santa Venerina in 2025? Explore comprehensive Airbnb analytics for Santa Venerina, Sicily, Italy to uncover income potential. This 2025 STR market report for Santa Venerina, based on AirROI data from April 2024 to March 2025, reveals key trends in the niche market of 53 active listings.
Whether you're considering an Airbnb investment in Santa Venerina, optimizing your existing vacation rental, or exploring rental arbitrage opportunities, understanding the Santa Venerina Airbnb data is crucial. Navigating the high regulation landscape is key to maximizing your short term rental income potential. Let's dive into the specifics.
Key Santa Venerina Airbnb Performance Metrics Overview
Monthly Airbnb Revenue Variations & Income Potential in Santa Venerina (2025)
Understanding the monthly revenue variations for Airbnb listings in Santa Venerina is key to maximizing your short term rental income potential. Seasonality significantly impacts earnings. Our analysis, based on data from the past 12 months, shows that the peak revenue month for STRs in Santa Venerina is typically August, while February often presents the lowest earnings, highlighting opportunities for strategic pricing adjustments during shoulder and low seasons. Explore the typical Airbnb income in Santa Venerina across different performance tiers:
- Best-in-class properties (Top 10%) achieve $6,670+ monthly, often utilizing dynamic pricing and superior guest experiences.
- Strong performing properties (Top 25%) earn $2,940 or more, indicating effective management and desirable locations/amenities.
- Typical properties (Median) generate around $1,635 per month, representing the average market performance.
- Entry-level properties (Bottom 25%) see earnings around $879, often with potential for optimization.
Average Monthly Airbnb Earnings Trend in Santa Venerina
Santa Venerina Airbnb Occupancy Rate Trends (2025)
Maximize your bookings by understanding the Santa Venerina STR occupancy trends. Seasonal demand shifts significantly influence how often properties are booked. Typically, Augustsees the highest demand (peak season occupancy), while January experiences the lowest (low season). Effective strategies, like adjusting minimum stays or offering promotions, can boost occupancy during slower periods. Here's how different property tiers perform in Santa Venerina:
- Best-in-class properties (Top 10%) achieve 69%+ occupancy, indicating high desirability and potentially optimized availability.
- Strong performing properties (Top 25%) maintain 58% or higher occupancy, suggesting good market fit and guest satisfaction.
- Typical properties (Median) have an occupancy rate around 40%.
- Entry-level properties (Bottom 25%) average 18% occupancy, potentially facing higher vacancy.
Average Monthly Occupancy Rate Trend in Santa Venerina
Average Daily Rate (ADR) Airbnb Trends in Santa Venerina (2025)
Effective short term rental pricing strategy in Santa Venerina involves understanding monthly ADR fluctuations. The Average Daily Rate (ADR) for Airbnb in Santa Venerina typically peaks in August and dips lowest during February. Leveraging Airbnb dynamic pricing tools or strategies based on this seasonality can significantly boost revenue. Here's a look at the typical nightly rates achieved:
- Best-in-class properties (Top 10%) command rates of $430+ per night, often due to premium features or locations.
- Strong performing properties (Top 25%) achieve nightly rates of $242 or more.
- Typical properties (Median) charge around $132 per night.
- Entry-level properties (Bottom 25%) earn around $79 per night.
Average Daily Rate (ADR) Trend by Month in Santa Venerina
Get Live Santa Venerina Market Intelligence 👇

Explore Real-time Analytics
Airbnb Seasonality Analysis & Trends in Santa Venerina (2025)
Peak Season (August, July, June)
- Revenue averages $4,297 per month
- Occupancy rates average 57.3%
- Daily rates average $220
Shoulder Season
- Revenue averages $2,557 per month
- Occupancy maintains around 41.8%
- Daily rates hold near $206
Low Season (February, March, December)
- Revenue drops to average $685 per month
- Occupancy decreases to average 20.0%
- Daily rates adjust to average $203
Seasonality Insights for Santa Venerina
- The Airbnb seasonality in Santa Venerina shows highly seasonal trends requiring careful strategy. While the sections above show seasonal averages, it's also insightful to look at the extremes:
- During the high season, the absolute peak month showcases Santa Venerina's highest earning potential, with monthly revenues capable of climbing to $4,989, occupancy reaching a high of 66.6%, and ADRs peaking at $224.
- Conversely, the slowest single month of the year, typically falling within the low season, marks the market's lowest point. In this month, revenue might dip to $573, occupancy could drop to 17.6%, and ADRs may adjust down to $199.
- Understanding both the seasonal averages and these monthly peaks and troughs in revenue, occupancy, and ADR is crucial for maximizing your Airbnb profit potential in Santa Venerina.
Seasonal Strategies for Maximizing Profit
- Peak Season: Maximize revenue through premium pricing and potentially longer minimum stays. Ensure high availability.
- Low Season: Offer competitive pricing, special promotions (e.g., extended stay discounts), and flexible cancellation policies. Target off-season travelers like remote workers or budget-conscious guests.
- Shoulder Seasons: Implement dynamic pricing that balances peak and low rates. Target weekend travelers or specific events. Offer slightly more flexible terms than peak season.
- Regularly analyze your own performance against these Santa Venerina seasonality benchmarks and adjust your pricing and availability strategy accordingly.
Best Areas for Airbnb Investment in Santa Venerina (2025)
Exploring the top neighborhoods for short-term rentals in Santa Venerina? This section highlights key areas, outlining why they are attractive for hosts and guests, along with notable local attractions. Consider these locations based on your target guest profile and investment strategy.
| Neighborhood / Area | Why Host Here? (Target Guests & Appeal) | Key Attractions & Landmarks |
|---|---|---|
| Centro di Santa Venerina | The heart of Santa Venerina with local shops, restaurants, and easy access to Mount Etna. A great spot for guests wanting to experience local culture and cuisine. | Chiesa Madre di Santa Venerina, Local markets, Mount Etna excursions, Catania and Taormina nearby |
| Piano di Lanzo | A charming suburban area known for its scenic views and tranquility. Perfect for guests looking to escape the hustle and bustle of city life. | Vineyards, Outdoor activities, Hiking trails in Mount Etna, Local agriturismos |
| Zafferana Etnea | Just a short drive from Santa Venerina, this area is known for its exquisite honey production and beautiful landscapes. Attracts nature lovers and food enthusiasts. | Honey museums, Mount Etna trails, Local eateries, Annual Honey Festival |
| Agnone Bagni | A coastal area known for its beach resorts and relaxed atmosphere. A perfect holiday spot for families and beachgoers. | Beaches, Water sports, Seaside restaurants, Scenic views |
| Santo Pietro | A serene area featuring rural charm and agricultural landscapes. Ideal for those who appreciate tranquility and rural tourism. | Agricultural tours, Local farms, Hiking paths, Cultural experiences |
| Nicolosi | Known as the gateway to Mount Etna, this area is a hotspot for adventure seekers and nature lovers looking for outdoor activities. | Etna National Park, Cable car to Mount Etna, Volcanic tours, Wine tasting |
| Caltagirone | Famous for its ceramics and Baroque architecture. Attracts visitors looking to explore artisanal crafts and cultural heritage. | Caltagirone Staircase, Ceramic workshops, Historical sites, Local cuisine |
| Taormina | A renowned tourist destination with stunning views, historical sites, and vibrant nightlife. A luxurious area attracting a high number of international tourists. | Greek Theatre, Corso Umberto, Isola Bella, Taormina beaches, Local fine dining |
Understanding Airbnb License Requirements & STR Laws in Santa Venerina (2025)
Yes, Santa Venerina, Sicily, Italy enforces high STR regulations. Obtaining a license and ensuring compliance is almost certainly required according to current 2025 STR laws. Always verify the latest short term rental regulations and Airbnb license requirements directly with local government authorities for Santa Venerina to ensure full compliance before hosting.
(Source: AirROI data, 2025, based on 51% licensed listings)
Top Performing Airbnb Properties in Santa Venerina (2025)
Benchmark your potential! Explore examples of top-performing Airbnb properties in Santa Venerinabased on Trailing Twelve Month (TTM) revenue. Analyze their characteristics, revenue, occupancy rate, and ADR to understand what drives success in this market.
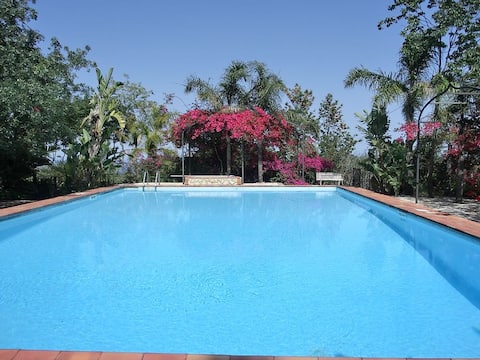
ISABELLA 'S GARDEN ancient villa with park.
Entire Place • 5 bedrooms
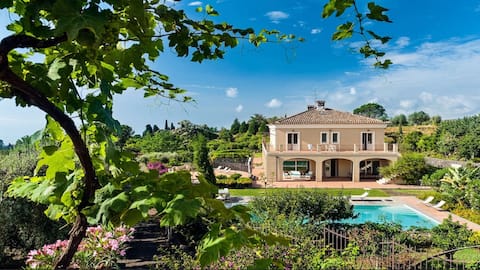
Villa Mareneve modern & elegant with private pool
Entire Place • 5 bedrooms
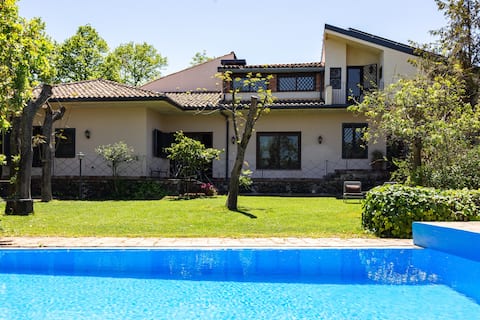
Fantastic Villa with Private Pool -Il Palmento
Entire Place • 6 bedrooms
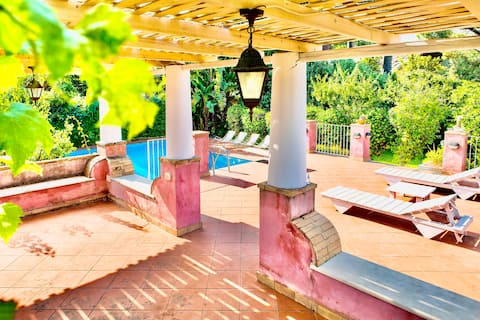
Villa EtnaSicily with Private Pool and Garden
Entire Place • 6 bedrooms
"Casa A'Ispenza"
Entire Place • 4 bedrooms
Agrume' Country House 8, Emma Villas
Entire Place • 4 bedrooms
Note: Performance varies based on location, size, amenities, seasonality, and management quality. Data reflects the past 12 months.
Top Performing Airbnb Hosts in Santa Venerina (2025)
Learn from the best! This table showcases top-performing Airbnb hosts in Santa Venerina based on the number of properties managed and estimated total revenue over the past year. Analyze their scale and performance metrics.
| Host Name | Properties | Grossing Revenue | Stay Reviews | Avg Rating |
|---|---|---|---|---|
| Mara | 2 | $157,031 | 134 | 4.80/5.0 |
| Nadia | 4 | $139,750 | 153 | 4.88/5.0 |
| Lorena | 4 | $125,354 | 304 | 4.84/5.0 |
| Francesco | 1 | $123,593 | 34 | 4.97/5.0 |
| Marco | 5 | $122,388 | 114 | 4.87/5.0 |
| Maria | 1 | $75,095 | 65 | 4.91/5.0 |
| Gabriella | 4 | $62,374 | 254 | 4.99/5.0 |
| Alfio | 5 | $51,555 | 38 | 4.92/5.0 |
| Host #223814216 | 1 | $50,300 | 0 | 0.00/5.0 |
| Agrippina | 1 | $37,905 | 19 | 4.42/5.0 |
Analyzing the strategies of top hosts, such as their property selection, pricing, and guest communication, can offer valuable lessons for optimizing your own Airbnb operations in Santa Venerina.
Dive Deeper: Advanced Santa Venerina STR Market Data (2025)
Ready to unlock more insights? AirROI provides access to advanced metrics and comprehensive Airbnb data for Santa Venerina. Explore detailed analytics beyond this report to refine your investment strategy, optimize pricing, and maximize your vacation rental profits.
Explore Advanced MetricsSanta Venerina Short-Term Rental Market Composition (2025): Property & Room Types
Room Type Distribution
Property Type Distribution
Market Composition Insights for Santa Venerina
- The Santa Venerina Airbnb market composition is heavily skewed towards Entire Home/Apt listings, which make up 88.7% of the 53 active rentals. This indicates strong guest preference for privacy and space.
- Looking at the property type distribution in Santa Venerina, House properties are the most common (49.1%), reflecting the local real estate landscape.
- Houses represent a significant 49.1% portion, catering likely to families or larger groups.
- The presence of 5.7% Hotel/Boutique listings indicates integration with traditional hospitality.
- Smaller segments like others (combined 1.9%) offer potential for unique stay experiences.
Santa Venerina Airbnb Room Capacity Analysis (2025): Bedroom Distribution
Distribution of Listings by Number of Bedrooms
Room Capacity Insights for Santa Venerina
- The dominant room capacity in Santa Venerina is 1 bedroom listings, making up 39.6% of the market. This suggests a strong demand for properties suitable for couples or solo travelers.
- Together, 1 bedroom and 2 bedrooms properties represent 60.4% of the active Airbnb listings in Santa Venerina, indicating a high concentration in these sizes.
- A significant 35.9% of listings offer 3+ bedrooms, catering to larger groups and families seeking more space in Santa Venerina.
Santa Venerina Vacation Rental Guest Capacity Trends (2025)
Distribution of Listings by Guest Capacity
Guest Capacity Insights for Santa Venerina
- The most common guest capacity trend in Santa Venerina vacation rentals is listings accommodating 4 guests (32.1%). This suggests the primary traveler segment is likely small families or groups.
- Properties designed for 4 guests and 8+ guests dominate the Santa Venerina STR market, accounting for 58.5% of listings.
- 37.7% of properties accommodate 6+ guests, serving the market segment for larger families or group travel in Santa Venerina.
- On average, properties in Santa Venerina are equipped to host 5.0 guests.
Santa Venerina Airbnb Booking Patterns (2025): Available vs. Booked Days
Available Days Distribution
Booked Days Distribution
Booking Pattern Insights for Santa Venerina
- The most common availability pattern in Santa Venerina falls within the 271-366 days range, representing 41.5% of listings. This suggests many properties have significant open periods on their calendars.
- Approximately 75.5% of listings show high availability (181+ days open annually), indicating potential for increased bookings or specific owner usage patterns.
- For booked days, the 91-180 days range is most frequent in Santa Venerina (34%), reflecting common guest stay durations or potential owner blocking patterns.
- A notable 24.5% of properties secure long booking periods (181+ days booked per year), highlighting successful long-term rental strategies or significant owner usage.
Santa Venerina Airbnb Minimum Stay Requirements Analysis
Distribution of Listings by Minimum Night Requirement
1 Night
3 listings
5.8% of total
2 Nights
23 listings
44.2% of total
3 Nights
5 listings
9.6% of total
4-6 Nights
11 listings
21.2% of total
7-29 Nights
4 listings
7.7% of total
30+ Nights
6 listings
11.5% of total
Key Insights
- The most prevalent minimum stay requirement in Santa Venerina is 2 Nights, adopted by 44.2% of listings. This highlights the market's preference for shorter, flexible bookings.
- A significant segment (11.5%) caters to monthly stays (30+ nights) in Santa Venerina, pointing to opportunities in the extended-stay market.
Recommendations
- Align with the market by considering a 2 Nights minimum stay, as 44.2% of Santa Venerina hosts use this setting.
- If feasible, allowing 1-night stays, especially midweek or during low season, could capture last-minute bookings, as only 5.8% currently do.
- A 2-night minimum appears standard (44.2%). Consider this for weekends or peak periods.
- Explore offering discounts for stays of 30+ nights to attract the 11.5% of the market seeking extended stays.
- Adjust minimum nights based on seasonality – potentially shorter during low season and longer during peak demand periods in Santa Venerina.
Santa Venerina Airbnb Cancellation Policy Trends Analysis (2025)
Flexible
8 listings
19.5% of total
Moderate
17 listings
41.5% of total
Strict
16 listings
39% of total
Cancellation Policy Insights for Santa Venerina
- The prevailing Airbnb cancellation policy trend in Santa Venerina is Moderate, used by 41.5% of listings.
- There's a relatively balanced mix between guest-friendly (61.0%) and stricter (39.0%) policies, offering choices for different guest needs.
Recommendations for Hosts
- Consider adopting a Moderate policy to align with the 41.5% market standard in Santa Venerina.
- With 39% using Strict terms, this is a viable option in Santa Venerina, particularly for high-value properties or during peak demand periods.
- Regularly review your cancellation policy against competitors and market demand shifts in Santa Venerina.
Santa Venerina STR Booking Lead Time Analysis (2025)
Average Booking Lead Time by Month
Booking Lead Time Insights for Santa Venerina
- The overall average booking lead time for vacation rentals in Santa Venerina is 79 days.
- Guests book furthest in advance for stays during September (average 121 days), likely coinciding with peak travel demand or local events.
- The shortest booking windows occur for stays in March (average 29 days), indicating more last-minute travel plans during this time.
- Seasonally, Summer (108 days avg.) sees the longest lead times, while Winter (37 days avg.) has the shortest, reflecting typical travel planning cycles.
Recommendations for Hosts
- Use the overall average lead time (79 days) as a baseline for your pricing and availability strategy in Santa Venerina.
- For September stays, consider implementing length-of-stay discounts or slightly higher rates for bookings made less than 121 days out to capitalize on advance planning.
- Target marketing efforts for the Summer season well in advance (at least 108 days) to capture early planners.
- Monitor your own booking lead times against these Santa Venerina averages to identify opportunities for dynamic pricing adjustments.
Popular & Essential Airbnb Amenities in Santa Venerina (2025)
Amenity Prevalence
Amenity Insights for Santa Venerina
- Essential amenities in Santa Venerina that guests expect include: Wifi, Air conditioning, Hair dryer, TV, Free parking on premises. Lacking these (any) could significantly impact bookings.
- Popular amenities like Washer, Heating, Kitchen are common but not universal. Offering these can provide a competitive edge.
Recommendations for Hosts
- Ensure your listing includes all essential amenities for Santa Venerina: Wifi, Air conditioning, Hair dryer, TV, Free parking on premises.
- Prioritize adding missing essentials: Air conditioning, Hair dryer, TV, Free parking on premises.
- Consider adding popular differentiators like Washer or Heating to increase appeal.
- Highlight unique or less common amenities you offer (e.g., hot tub, dedicated workspace, EV charger) in your listing description and photos.
- Regularly check competitor amenities in Santa Venerina to stay competitive.
Santa Venerina Airbnb Guest Demographics & Profile Analysis (2025)
Guest Profile Summary for Santa Venerina
- The typical guest profile for Airbnb in Santa Venerina consists of predominantly international visitors (95%), with top international origins including Germany, typically belonging to the Post-2000s (Gen Z/Alpha) group (50%), primarily speaking English or German.
- Domestic travelers account for 5.2% of guests.
- Key international markets include France (22.6%) and Germany (14.7%).
- Top languages spoken are English (41.3%) followed by German (14.9%).
- A significant demographic segment is the Post-2000s (Gen Z/Alpha) group, representing 50% of guests.
Recommendations for Hosts
- Focus marketing internationally, particularly towards travelers from Germany.
- Tailor amenities and listing descriptions to appeal to the dominant Post-2000s (Gen Z/Alpha) demographic (e.g., highlight fast WiFi, smart home features, local guides).
- Highlight unique local experiences or amenities relevant to the primary guest profile.
- Consider seasonal promotions aligned with peak travel times for key origin markets.
Nearby Short-Term Rental Market Comparison
How does the Santa Venerina Airbnb market stack up against its neighbors? Compare key performance metrics like average monthly revenue, ADR, and occupancy rates in surrounding areas to understand the broader regional STR landscape.
| Market | Active Properties | Monthly Revenue | Daily Rate | Avg. Occupancy |
|---|---|---|---|---|
| Taormina | 973 | $2,450 | $221.38 | 47% |
| Għasri | 56 | $2,339 | $216.90 | 40% |
| Graniti | 20 | $2,135 | $168.67 | 47% |
| Torregrotta | 16 | $2,105 | $267.72 | 36% |
| Viagrande | 34 | $1,921 | $196.41 | 38% |
| Gaggi | 16 | $1,892 | $190.10 | 40% |
| Xewkija | 36 | $1,766 | $167.34 | 43% |
| Cefalù | 1,003 | $1,764 | $182.13 | 48% |
| San Marco d'Alunzio | 13 | $1,726 | $174.71 | 38% |
| Tropea | 10 | $1,702 | $157.29 | 49% |