Partanna Airbnb Market Analysis 2025: Short Term Rental Data & Vacation Rental Statistics in Sicily, Italy
Is Airbnb profitable in Partanna in 2025? Explore comprehensive Airbnb analytics for Partanna, Sicily, Italy to uncover income potential. This 2025 STR market report for Partanna, based on AirROI data from April 2024 to March 2025, reveals key trends in the niche market of 23 active listings.
Whether you're considering an Airbnb investment in Partanna, optimizing your existing vacation rental, or exploring rental arbitrage opportunities, understanding the Partanna Airbnb data is crucial. Navigating the high regulation landscape is key to maximizing your short term rental income potential. Let's dive into the specifics.
Key Partanna Airbnb Performance Metrics Overview
Monthly Airbnb Revenue Variations & Income Potential in Partanna (2025)
Understanding the monthly revenue variations for Airbnb listings in Partanna is key to maximizing your short term rental income potential. Seasonality significantly impacts earnings. Our analysis, based on data from the past 12 months, shows that the peak revenue month for STRs in Partanna is typically September, while February often presents the lowest earnings, highlighting opportunities for strategic pricing adjustments during shoulder and low seasons. Explore the typical Airbnb income in Partanna across different performance tiers:
- Best-in-class properties (Top 10%) achieve $5,439+ monthly, often utilizing dynamic pricing and superior guest experiences.
- Strong performing properties (Top 25%) earn $1,558 or more, indicating effective management and desirable locations/amenities.
- Typical properties (Median) generate around $712 per month, representing the average market performance.
- Entry-level properties (Bottom 25%) see earnings around $318, often with potential for optimization.
Average Monthly Airbnb Earnings Trend in Partanna
Partanna Airbnb Occupancy Rate Trends (2025)
Maximize your bookings by understanding the Partanna STR occupancy trends. Seasonal demand shifts significantly influence how often properties are booked. Typically, Septembersees the highest demand (peak season occupancy), while February experiences the lowest (low season). Effective strategies, like adjusting minimum stays or offering promotions, can boost occupancy during slower periods. Here's how different property tiers perform in Partanna:
- Best-in-class properties (Top 10%) achieve 63%+ occupancy, indicating high desirability and potentially optimized availability.
- Strong performing properties (Top 25%) maintain 41% or higher occupancy, suggesting good market fit and guest satisfaction.
- Typical properties (Median) have an occupancy rate around 27%.
- Entry-level properties (Bottom 25%) average 14% occupancy, potentially facing higher vacancy.
Average Monthly Occupancy Rate Trend in Partanna
Average Daily Rate (ADR) Airbnb Trends in Partanna (2025)
Effective short term rental pricing strategy in Partanna involves understanding monthly ADR fluctuations. The Average Daily Rate (ADR) for Airbnb in Partanna typically peaks in August and dips lowest during March. Leveraging Airbnb dynamic pricing tools or strategies based on this seasonality can significantly boost revenue. Here's a look at the typical nightly rates achieved:
- Best-in-class properties (Top 10%) command rates of $442+ per night, often due to premium features or locations.
- Strong performing properties (Top 25%) achieve nightly rates of $115 or more.
- Typical properties (Median) charge around $74 per night.
- Entry-level properties (Bottom 25%) earn around $51 per night.
Average Daily Rate (ADR) Trend by Month in Partanna
Get Live Partanna Market Intelligence 👇

Explore Real-time Analytics
Airbnb Seasonality Analysis & Trends in Partanna (2025)
Peak Season (September, August, May)
- Revenue averages $3,648 per month
- Occupancy rates average 43.7%
- Daily rates average $164
Shoulder Season
- Revenue averages $1,989 per month
- Occupancy maintains around 28.4%
- Daily rates hold near $161
Low Season (February, March, November)
- Revenue drops to average $768 per month
- Occupancy decreases to average 20.7%
- Daily rates adjust to average $150
Seasonality Insights for Partanna
- The Airbnb seasonality in Partanna shows highly seasonal trends requiring careful strategy. While the sections above show seasonal averages, it's also insightful to look at the extremes:
- During the high season, the absolute peak month showcases Partanna's highest earning potential, with monthly revenues capable of climbing to $3,922, occupancy reaching a high of 56.9%, and ADRs peaking at $168.
- Conversely, the slowest single month of the year, typically falling within the low season, marks the market's lowest point. In this month, revenue might dip to $243, occupancy could drop to 10.7%, and ADRs may adjust down to $148.
- Understanding both the seasonal averages and these monthly peaks and troughs in revenue, occupancy, and ADR is crucial for maximizing your Airbnb profit potential in Partanna.
Seasonal Strategies for Maximizing Profit
- Peak Season: Maximize revenue through premium pricing and potentially longer minimum stays. Ensure high availability.
- Low Season: Offer competitive pricing, special promotions (e.g., extended stay discounts), and flexible cancellation policies. Target off-season travelers like remote workers or budget-conscious guests.
- Shoulder Seasons: Implement dynamic pricing that balances peak and low rates. Target weekend travelers or specific events. Offer slightly more flexible terms than peak season.
- Regularly analyze your own performance against these Partanna seasonality benchmarks and adjust your pricing and availability strategy accordingly.
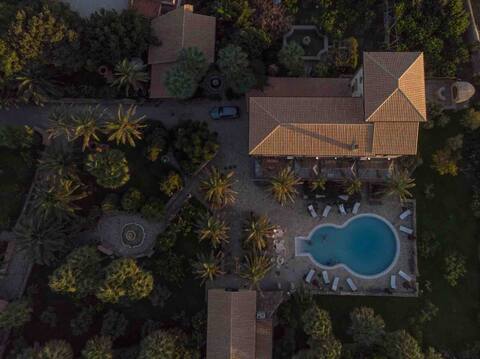
Best Areas for Airbnb Investment in Partanna (2025)
Exploring the top neighborhoods for short-term rentals in Partanna? This section highlights key areas, outlining why they are attractive for hosts and guests, along with notable local attractions. Consider these locations based on your target guest profile and investment strategy.
| Neighborhood / Area | Why Host Here? (Target Guests & Appeal) | Key Attractions & Landmarks |
|---|---|---|
| Historic Center of Partanna | Charming old town with a rich history and beautiful architecture. Ideal for tourists interested in culture and history with easy access to local sights and eateries. | Castello di Partanna, Cathedral of San Bartolomeo, Piazza A. Manzoni, Museo Civico, Church of San Giovanni Battista |
| Near Selinunte Archaeological Park | Proximity to one of Sicily's most important archaeological sites, attracting history lovers and families looking to explore ancient ruins and the nearby beach. | Selinunte Archaeological Park, Cala Rossa Beach, Temple of Hera, Temple of Athena |
| Countryside around Partanna | Scenic rural area perfect for those looking to enjoy peaceful retreats and agritourism. Great for families and couples seeking a tranquil escape from city life. | Vineyards and wineries, Olive groves, Agriturismo experiences, Nature trails, Local farms |
| Partanna Vineyards | Famous for its wine production, this region attracts wine enthusiasts and offers vineyard tours, tastings, and charming accommodations. | Wine tours, Local wine festivals, Tasting rooms, Rural accommodations |
| Marsala | A nearby city known for its wine, beautiful coastal views, and rich culture, perfect for day trips and exploring local Sicilian life. | Marsala Wine, Riserva Naturale dello Stagnone, Historic town center, Islands of the Stagnone |
| Trapani Coast | Stunning seaside area known for its beautiful beaches and proximity to the Egadi Islands for those looking to combine beach life with island hopping. | San Vito Lo Capo Beach, Reserve of Zingaro, Egadi Islands, Trapani salt pans |
| Food & Wine Tours | Offers unique experiences for tourists interested in Sicilian cuisine and local culinary workshops, appealing to food lovers and hobby chefs. | Cooking classes, Wine and food festivals, Local markets, Farmers markets, Traditional Sicilian restaurants |
| Cultural Events in Partanna | Partanna hosts various festivals and cultural events throughout the year, making it an attractive location for visitors interested in local traditions and social gatherings. | Local festivals and fairs, Artistic events, Sicilian music concerts, Tradition and folklore events |
Understanding Airbnb License Requirements & STR Laws in Partanna (2025)
Yes, Partanna, Sicily, Italy enforces high STR regulations. Obtaining a license and ensuring compliance is almost certainly required according to current 2025 STR laws. Always verify the latest short term rental regulations and Airbnb license requirements directly with local government authorities for Partanna to ensure full compliance before hosting.
(Source: AirROI data, 2025, based on 43% licensed listings)
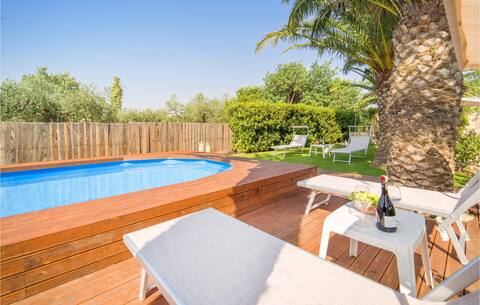
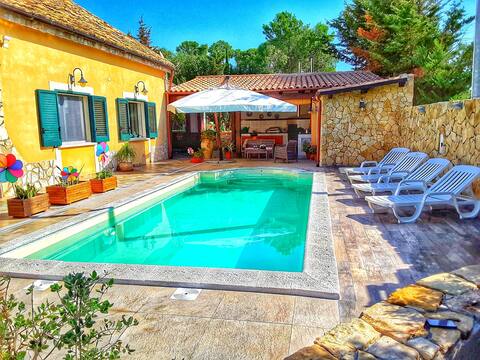
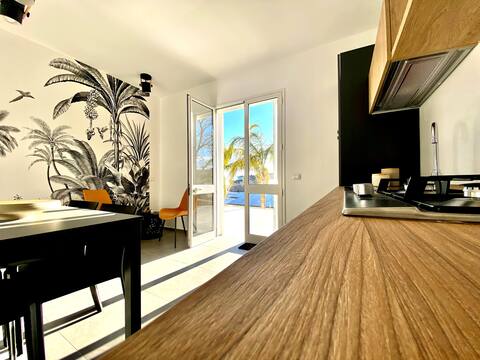
Top Performing Airbnb Properties in Partanna (2025)
Benchmark your potential! Explore examples of top-performing Airbnb properties in Partannabased on Trailing Twelve Month (TTM) revenue. Analyze their characteristics, revenue, occupancy rate, and ADR to understand what drives success in this market.
Elegant villa/heated pool /private garden/ hot tub
Entire Place • 10 bedrooms

Beautiful home in Partanna
Entire Place • 3 bedrooms
2 bedroom stunning home in Partanna
Entire Place • 2 bedrooms
Villa with pool near the beach of Selinunte
Entire Place • 3 bedrooms
Apartment Rosmarino
Entire Place • 2 bedrooms

Serena
Entire Place • 2 bedrooms
Note: Performance varies based on location, size, amenities, seasonality, and management quality. Data reflects the past 12 months.
Top Performing Airbnb Hosts in Partanna (2025)
Learn from the best! This table showcases top-performing Airbnb hosts in Partanna based on the number of properties managed and estimated total revenue over the past year. Analyze their scale and performance metrics.
| Host Name | Properties | Grossing Revenue | Stay Reviews | Avg Rating |
|---|---|---|---|---|
| Livia | 1 | $173,385 | 14 | 5.00/5.0 |
| Novasol | 1 | $66,238 | 5 | 5.00/5.0 |
| Host #137510446 | 1 | $20,308 | 0 | 0.00/5.0 |
| Fortunato | 1 | $19,923 | 55 | 4.98/5.0 |
| Rosario | 1 | $17,750 | 42 | 4.98/5.0 |
| Novasol | 1 | $17,672 | 3 | 4.67/5.0 |
| Angelo | 1 | $12,906 | 19 | 4.95/5.0 |
| Roberto | 4 | $12,728 | 22 | 3.73/5.0 |
| Francesco | 3 | $12,543 | 10 | 1.67/5.0 |
| Baldassare | 1 | $8,257 | 13 | 4.85/5.0 |
Analyzing the strategies of top hosts, such as their property selection, pricing, and guest communication, can offer valuable lessons for optimizing your own Airbnb operations in Partanna.
Dive Deeper: Advanced Partanna STR Market Data (2025)
Ready to unlock more insights? AirROI provides access to advanced metrics and comprehensive Airbnb data for Partanna. Explore detailed analytics beyond this report to refine your investment strategy, optimize pricing, and maximize your vacation rental profits.
Explore Advanced MetricsPartanna Short-Term Rental Market Composition (2025): Property & Room Types
Room Type Distribution
Property Type Distribution
Market Composition Insights for Partanna
- The Partanna Airbnb market composition is heavily skewed towards Entire Home/Apt listings, which make up 78.3% of the 23 active rentals. This indicates strong guest preference for privacy and space.
- Looking at the property type distribution in Partanna, Apartment/Condo properties are the most common (43.5%), reflecting the local real estate landscape.
- Houses represent a significant 39.1% portion, catering likely to families or larger groups.
- The presence of 13% Hotel/Boutique listings indicates integration with traditional hospitality.
- Smaller segments like outdoor/unique (combined 4.3%) offer potential for unique stay experiences.
Partanna Airbnb Room Capacity Analysis (2025): Bedroom Distribution
Distribution of Listings by Number of Bedrooms
Room Capacity Insights for Partanna
- The dominant room capacity in Partanna is 2 bedrooms listings, making up 43.5% of the market. This suggests a strong demand for properties suitable for couples or solo travelers.
- Together, 2 bedrooms and 1 bedroom properties represent 69.6% of the active Airbnb listings in Partanna, indicating a high concentration in these sizes.
Partanna Vacation Rental Guest Capacity Trends (2025)
Distribution of Listings by Guest Capacity
Guest Capacity Insights for Partanna
- The most common guest capacity trend in Partanna vacation rentals is listings accommodating 4 guests (30.4%). This suggests the primary traveler segment is likely small families or groups.
- Properties designed for 4 guests and 5 guests dominate the Partanna STR market, accounting for 47.8% of listings.
- 30.3% of properties accommodate 6+ guests, serving the market segment for larger families or group travel in Partanna.
- On average, properties in Partanna are equipped to host 4.4 guests.
Partanna Airbnb Booking Patterns (2025): Available vs. Booked Days
Available Days Distribution
Booked Days Distribution
Booking Pattern Insights for Partanna
- The most common availability pattern in Partanna falls within the 271-366 days range, representing 65.2% of listings. This suggests many properties have significant open periods on their calendars.
- Approximately 95.6% of listings show high availability (181+ days open annually), indicating potential for increased bookings or specific owner usage patterns.
- For booked days, the 91-180 days range is most frequent in Partanna (34.8%), reflecting common guest stay durations or potential owner blocking patterns.
- A notable 4.3% of properties secure long booking periods (181+ days booked per year), highlighting successful long-term rental strategies or significant owner usage.
Partanna Airbnb Minimum Stay Requirements Analysis
Distribution of Listings by Minimum Night Requirement
1 Night
9 listings
40.9% of total
2 Nights
6 listings
27.3% of total
3 Nights
1 listings
4.5% of total
4-6 Nights
2 listings
9.1% of total
7-29 Nights
1 listings
4.5% of total
30+ Nights
3 listings
13.6% of total
Key Insights
- The most prevalent minimum stay requirement in Partanna is 1 Night, adopted by 40.9% of listings. This highlights the market's preference for shorter, flexible bookings.
- A strong majority (68.2%) of the Partanna Airbnb data shows acceptance of very short stays (1-2 nights), indicating a dynamic, high-turnover market.
- A significant segment (13.6%) caters to monthly stays (30+ nights) in Partanna, pointing to opportunities in the extended-stay market.
Recommendations
- Align with the market by considering a 1 Night minimum stay, as 40.9% of Partanna hosts use this setting.
- Explore offering discounts for stays of 30+ nights to attract the 13.6% of the market seeking extended stays.
- Adjust minimum nights based on seasonality – potentially shorter during low season and longer during peak demand periods in Partanna.
Partanna Airbnb Cancellation Policy Trends Analysis (2025)
Super Strict 60 Days
2 listings
12.5% of total
Flexible
6 listings
37.5% of total
Moderate
6 listings
37.5% of total
Strict
2 listings
12.5% of total
Cancellation Policy Insights for Partanna
- The prevailing Airbnb cancellation policy trend in Partanna is Flexible, used by 37.5% of listings.
- The market strongly favors guest-friendly terms, with 75.0% of listings offering Flexible or Moderate policies. This suggests guests in Partanna may expect booking flexibility.
Recommendations for Hosts
- Consider adopting a Flexible policy to align with the 37.5% market standard in Partanna.
- Using a Strict policy might deter some guests, as only 12.5% of listings use it. Evaluate if potential revenue protection outweighs possible lower booking rates.
- Regularly review your cancellation policy against competitors and market demand shifts in Partanna.
Partanna STR Booking Lead Time Analysis (2025)
Average Booking Lead Time by Month
Booking Lead Time Insights for Partanna
- The overall average booking lead time for vacation rentals in Partanna is 50 days.
- Guests book furthest in advance for stays during March (average 140 days), likely coinciding with peak travel demand or local events.
- The shortest booking windows occur for stays in January (average 34 days), indicating more last-minute travel plans during this time.
- Seasonally, Spring (122 days avg.) sees the longest lead times, while Winter (58 days avg.) has the shortest, reflecting typical travel planning cycles.
Recommendations for Hosts
- Use the overall average lead time (50 days) as a baseline for your pricing and availability strategy in Partanna.
- For March stays, consider implementing length-of-stay discounts or slightly higher rates for bookings made less than 140 days out to capitalize on advance planning.
- Target marketing efforts for the Spring season well in advance (at least 122 days) to capture early planners.
- Monitor your own booking lead times against these Partanna averages to identify opportunities for dynamic pricing adjustments.
Popular & Essential Airbnb Amenities in Partanna (2025)
Amenity Prevalence
Amenity Insights for Partanna
- Essential amenities in Partanna that guests expect include: TV, Washer, Air conditioning, Kitchen, Heating. Lacking these (any) could significantly impact bookings.
- Popular amenities like Essentials, Hot water, Wifi are common but not universal. Offering these can provide a competitive edge.
- Warning: Wifi is not universally provided but is considered essential globally. Ensure reliable Wifi is offered.
Recommendations for Hosts
- Ensure your listing includes all essential amenities for Partanna: TV, Washer, Air conditioning, Kitchen, Heating.
- Prioritize adding missing essentials: Heating.
- Consider adding popular differentiators like Essentials or Hot water to increase appeal.
- Highlight unique or less common amenities you offer (e.g., hot tub, dedicated workspace, EV charger) in your listing description and photos.
- Regularly check competitor amenities in Partanna to stay competitive.
Partanna Airbnb Guest Demographics & Profile Analysis (2025)
Guest Profile Summary for Partanna
- The typical guest profile for Airbnb in Partanna consists of predominantly international visitors (83%), with top international origins including Italy, typically belonging to the Post-2000s (Gen Z/Alpha) group (50%), primarily speaking English or French.
- Domestic travelers account for 16.9% of guests.
- Key international markets include France (18.6%) and Italy (16.9%).
- Top languages spoken are English (40.2%) followed by French (18.3%).
- A significant demographic segment is the Post-2000s (Gen Z/Alpha) group, representing 50% of guests.
Recommendations for Hosts
- Focus marketing internationally, particularly towards travelers from Italy.
- Tailor amenities and listing descriptions to appeal to the dominant Post-2000s (Gen Z/Alpha) demographic (e.g., highlight fast WiFi, smart home features, local guides).
- Highlight unique local experiences or amenities relevant to the primary guest profile.
- Consider seasonal promotions aligned with peak travel times for key origin markets.
Nearby Short-Term Rental Market Comparison
How does the Partanna Airbnb market stack up against its neighbors? Compare key performance metrics like average monthly revenue, ADR, and occupancy rates in surrounding areas to understand the broader regional STR landscape.
| Market | Active Properties | Monthly Revenue | Daily Rate | Avg. Occupancy |
|---|---|---|---|---|
| Partinico | 112 | $2,077 | $283.49 | 39% |
| Santa Flavia | 189 | $1,866 | $165.16 | 47% |
| Collesano | 47 | $1,716 | $240.89 | 35% |
| Buseto Palizzolo | 31 | $1,683 | $218.18 | 38% |
| Altavilla Milicia | 79 | $1,568 | $210.58 | 42% |
| Borgetto | 15 | $1,425 | $168.70 | 43% |
| Montallegro | 26 | $1,390 | $159.24 | 43% |
| Marausa | 15 | $1,366 | $207.22 | 30% |
| Alcamo | 300 | $1,330 | $161.45 | 43% |
| Lascari | 84 | $1,311 | $230.42 | 40% |