Palermo Airbnb Market Analysis 2025: Short Term Rental Data & Vacation Rental Statistics in Sicily, Italy
Is Airbnb profitable in Palermo in 2025? Explore comprehensive Airbnb analytics for Palermo, Sicily, Italy to uncover income potential. This 2025 STR market report for Palermo, based on AirROI data from April 2024 to March 2025, reveals key trends in the bustling market of 4,625 active listings.
Whether you're considering an Airbnb investment in Palermo, optimizing your existing vacation rental, or exploring rental arbitrage opportunities, understanding the Palermo Airbnb data is crucial. Navigating the high regulation landscape is key to maximizing your short term rental income potential. Let's dive into the specifics.
Key Palermo Airbnb Performance Metrics Overview
Monthly Airbnb Revenue Variations & Income Potential in Palermo (2025)
Understanding the monthly revenue variations for Airbnb listings in Palermo is key to maximizing your short term rental income potential. Seasonality significantly impacts earnings. Our analysis, based on data from the past 12 months, shows that the peak revenue month for STRs in Palermo is typically May, while January often presents the lowest earnings, highlighting opportunities for strategic pricing adjustments during shoulder and low seasons. Explore the typical Airbnb income in Palermo across different performance tiers:
- Best-in-class properties (Top 10%) achieve $3,106+ monthly, often utilizing dynamic pricing and superior guest experiences.
- Strong performing properties (Top 25%) earn $2,021 or more, indicating effective management and desirable locations/amenities.
- Typical properties (Median) generate around $1,254 per month, representing the average market performance.
- Entry-level properties (Bottom 25%) see earnings around $641, often with potential for optimization.
Average Monthly Airbnb Earnings Trend in Palermo
Palermo Airbnb Occupancy Rate Trends (2025)
Maximize your bookings by understanding the Palermo STR occupancy trends. Seasonal demand shifts significantly influence how often properties are booked. Typically, Augustsees the highest demand (peak season occupancy), while January experiences the lowest (low season). Effective strategies, like adjusting minimum stays or offering promotions, can boost occupancy during slower periods. Here's how different property tiers perform in Palermo:
- Best-in-class properties (Top 10%) achieve 82%+ occupancy, indicating high desirability and potentially optimized availability.
- Strong performing properties (Top 25%) maintain 67% or higher occupancy, suggesting good market fit and guest satisfaction.
- Typical properties (Median) have an occupancy rate around 45%.
- Entry-level properties (Bottom 25%) average 20% occupancy, potentially facing higher vacancy.
Average Monthly Occupancy Rate Trend in Palermo
Average Daily Rate (ADR) Airbnb Trends in Palermo (2025)
Effective short term rental pricing strategy in Palermo involves understanding monthly ADR fluctuations. The Average Daily Rate (ADR) for Airbnb in Palermo typically peaks in August and dips lowest during February. Leveraging Airbnb dynamic pricing tools or strategies based on this seasonality can significantly boost revenue. Here's a look at the typical nightly rates achieved:
- Best-in-class properties (Top 10%) command rates of $177+ per night, often due to premium features or locations.
- Strong performing properties (Top 25%) achieve nightly rates of $120 or more.
- Typical properties (Median) charge around $85 per night.
- Entry-level properties (Bottom 25%) earn around $63 per night.
Average Daily Rate (ADR) Trend by Month in Palermo
Get Live Palermo Market Intelligence 👇

Explore Real-time Analytics
Airbnb Seasonality Analysis & Trends in Palermo (2025)
Peak Season (May, August, July)
- Revenue averages $2,244 per month
- Occupancy rates average 57.4%
- Daily rates average $117
Shoulder Season
- Revenue averages $1,624 per month
- Occupancy maintains around 45.3%
- Daily rates hold near $111
Low Season (January, February, March)
- Revenue drops to average $842 per month
- Occupancy decreases to average 31.4%
- Daily rates adjust to average $102
Seasonality Insights for Palermo
- The Airbnb seasonality in Palermo shows highly seasonal trends requiring careful strategy. While the sections above show seasonal averages, it's also insightful to look at the extremes:
- During the high season, the absolute peak month showcases Palermo's highest earning potential, with monthly revenues capable of climbing to $2,339, occupancy reaching a high of 60.3%, and ADRs peaking at $120.
- Conversely, the slowest single month of the year, typically falling within the low season, marks the market's lowest point. In this month, revenue might dip to $788, occupancy could drop to 27.3%, and ADRs may adjust down to $101.
- Understanding both the seasonal averages and these monthly peaks and troughs in revenue, occupancy, and ADR is crucial for maximizing your Airbnb profit potential in Palermo.
Seasonal Strategies for Maximizing Profit
- Peak Season: Maximize revenue through premium pricing and potentially longer minimum stays. Ensure high availability.
- Low Season: Offer competitive pricing, special promotions (e.g., extended stay discounts), and flexible cancellation policies. Target off-season travelers like remote workers or budget-conscious guests.
- Shoulder Seasons: Implement dynamic pricing that balances peak and low rates. Target weekend travelers or specific events. Offer slightly more flexible terms than peak season.
- Regularly analyze your own performance against these Palermo seasonality benchmarks and adjust your pricing and availability strategy accordingly.
Best Areas for Airbnb Investment in Palermo (2025)
Exploring the top neighborhoods for short-term rentals in Palermo? This section highlights key areas, outlining why they are attractive for hosts and guests, along with notable local attractions. Consider these locations based on your target guest profile and investment strategy.
| Neighborhood / Area | Why Host Here? (Target Guests & Appeal) | Key Attractions & Landmarks |
|---|---|---|
| Centro Storico | The historic city center of Palermo, rich in culture and history, attracting tourists looking to explore its beautiful architecture and vibrant local life. | Palermo Cathedral, Teatro Massimo, Quattro Canti, Piazza Pretoria, Church of the Gesu |
| Mondello | A picturesque beach suburb known for its stunning coastline and clear waters, popular among tourists and locals alike for summer holidays and water sports. | Mondello Beach, Capo Gallo Nature Reserve, Lido di Mondello, Restaurants and beach clubs on the promenade |
| Kalsa | An emerging neighborhood in Palermo that combines historic charm with a trendy atmosphere, favored by young travelers and artists. | Orto Botanico, Cappella Palatina, Piazza Marina, Cielo di Palermo |
| Uditore | A quieter residential area that offers good access to major roads and attractions, ideal for those seeking a more local experience. | La Fiera di Palermo, Fiume Oreto, Local eateries |
| Via Roma | This street connects the central train station to the main shopping areas, making it ideal for tourists who want to be close to shopping and dining options. | Shopping venues, Cafes, Palermo's main market areas |
| Castellammare | Located near the waterfront, this area is known for its nightlife and entertainment, appealing to younger crowds. | Foro Italico, View of the harbor, Clubbing venues |
| Palermo Waterfront | Offers scenic views and is close to several popular tourist destinations, making it a sought-after area for visitors. | Port of Palermo, Restaurants with sea views, Historical monuments along the promenade |
| Sferracavallo | A charming fishing village on the outskirts of Palermo, known for its seafood and beautiful landscape, attracting those looking for a more peaceful stay. | Beaches, Restaurants featuring fresh seafood, Views of Monte Pellegrino |
Understanding Airbnb License Requirements & STR Laws in Palermo (2025)
Yes, Palermo, Sicily, Italy enforces high STR regulations. Obtaining a license and ensuring compliance is almost certainly required according to current 2025 STR laws. Always verify the latest short term rental regulations and Airbnb license requirements directly with local government authorities for Palermo to ensure full compliance before hosting.
(Source: AirROI data, 2025, based on 64% licensed listings)
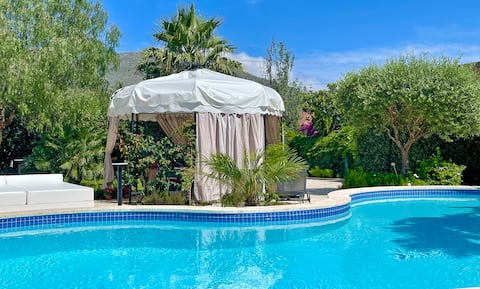
Top Performing Airbnb Properties in Palermo (2025)
Benchmark your potential! Explore examples of top-performing Airbnb properties in Palermobased on Trailing Twelve Month (TTM) revenue. Analyze their characteristics, revenue, occupancy rate, and ADR to understand what drives success in this market.
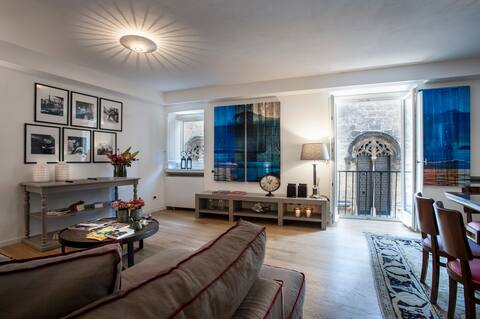
BB22 Palace - Charming rooms and apartments
Entire Place • 4 bedrooms

Sea view villa with private pool in Mondello
Entire Place • 5 bedrooms
Lille, Art Nouveau villa a few steps from Mondello.
Entire Place • 4 bedrooms
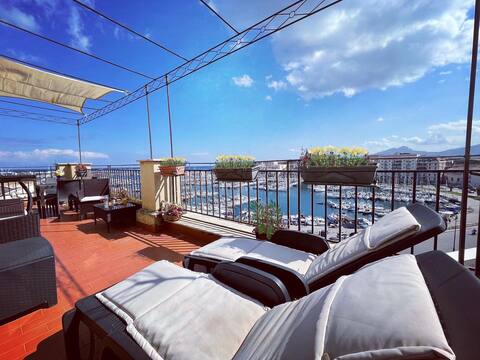
Apartments Vista Mare for Groups
Entire Place • 8 bedrooms

Villa Sul Mare Vicino Il Centro di Palermo
Entire Place • 6 bedrooms

open space independent conterrazze Teatro Massimo
Entire Place • 5 bedrooms
Note: Performance varies based on location, size, amenities, seasonality, and management quality. Data reflects the past 12 months.
Top Performing Airbnb Hosts in Palermo (2025)
Learn from the best! This table showcases top-performing Airbnb hosts in Palermo based on the number of properties managed and estimated total revenue over the past year. Analyze their scale and performance metrics.
| Host Name | Properties | Grossing Revenue | Stay Reviews | Avg Rating |
|---|---|---|---|---|
| Wonderful Italy Sicilia | 168 | $3,277,466 | 3724 | 3.73/5.0 |
| Welcome To Italy | 91 | $1,628,070 | 2429 | 4.08/5.0 |
| DomuSicily | 31 | $918,000 | 597 | 3.70/5.0 |
| Fabian | 37 | $492,553 | 516 | 4.25/5.0 |
| Rosario | 16 | $444,634 | 1779 | 4.95/5.0 |
| DomuSicily | 22 | $430,562 | 323 | 3.50/5.0 |
| Sofia'S House | 35 | $337,145 | 578 | 2.05/5.0 |
| Beniamino | 14 | $257,405 | 214 | 3.64/5.0 |
| Nicoletta | 6 | $248,360 | 400 | 4.88/5.0 |
| Marco | 3 | $235,787 | 51 | 4.76/5.0 |
Analyzing the strategies of top hosts, such as their property selection, pricing, and guest communication, can offer valuable lessons for optimizing your own Airbnb operations in Palermo.
Dive Deeper: Advanced Palermo STR Market Data (2025)
Ready to unlock more insights? AirROI provides access to advanced metrics and comprehensive Airbnb data for Palermo. Explore detailed analytics beyond this report to refine your investment strategy, optimize pricing, and maximize your vacation rental profits.
Explore Advanced MetricsPalermo Short-Term Rental Market Composition (2025): Property & Room Types
Room Type Distribution
Property Type Distribution
Market Composition Insights for Palermo
- The Palermo Airbnb market composition is heavily skewed towards Entire Home/Apt listings, which make up 80.5% of the 4,625 active rentals. This indicates strong guest preference for privacy and space.
- Looking at the property type distribution in Palermo, Apartment/Condo properties are the most common (75.7%), reflecting the local real estate landscape.
- Houses represent a significant 18% portion, catering likely to families or larger groups.
- The presence of 5.3% Hotel/Boutique listings indicates integration with traditional hospitality.
- Smaller segments like others, outdoor/unique (combined 0.9%) offer potential for unique stay experiences.
Palermo Airbnb Room Capacity Analysis (2025): Bedroom Distribution
Distribution of Listings by Number of Bedrooms
Room Capacity Insights for Palermo
- The dominant room capacity in Palermo is 1 bedroom listings, making up 51.4% of the market. This suggests a strong demand for properties suitable for couples or solo travelers.
- Together, 1 bedroom and 2 bedrooms properties represent 77.3% of the active Airbnb listings in Palermo, indicating a high concentration in these sizes.
- With over half the market (51.4%) consisting of studios or 1-bedroom units, Palermo is particularly well-suited for individuals or couples.
Palermo Vacation Rental Guest Capacity Trends (2025)
Distribution of Listings by Guest Capacity
Guest Capacity Insights for Palermo
- The most common guest capacity trend in Palermo vacation rentals is listings accommodating 4 guests (32.4%). This suggests the primary traveler segment is likely small families or groups.
- Properties designed for 4 guests and 2 guests dominate the Palermo STR market, accounting for 52.3% of listings.
- 16.5% of properties accommodate 6+ guests, serving the market segment for larger families or group travel in Palermo.
- On average, properties in Palermo are equipped to host 3.6 guests.
Palermo Airbnb Booking Patterns (2025): Available vs. Booked Days
Available Days Distribution
Booked Days Distribution
Booking Pattern Insights for Palermo
- The most common availability pattern in Palermo falls within the 271-366 days range, representing 39.8% of listings. This suggests many properties have significant open periods on their calendars.
- Approximately 70.6% of listings show high availability (181+ days open annually), indicating potential for increased bookings or specific owner usage patterns.
- For booked days, the 91-180 days range is most frequent in Palermo (30.6%), reflecting common guest stay durations or potential owner blocking patterns.
- A notable 31.0% of properties secure long booking periods (181+ days booked per year), highlighting successful long-term rental strategies or significant owner usage.
Palermo Airbnb Minimum Stay Requirements Analysis
Distribution of Listings by Minimum Night Requirement
1 Night
1040 listings
24% of total
2 Nights
1579 listings
36.4% of total
3 Nights
662 listings
15.3% of total
4-6 Nights
205 listings
4.7% of total
7-29 Nights
356 listings
8.2% of total
30+ Nights
492 listings
11.4% of total
Key Insights
- The most prevalent minimum stay requirement in Palermo is 2 Nights, adopted by 36.4% of listings. This highlights the market's preference for shorter, flexible bookings.
- A strong majority (60.4%) of the Palermo Airbnb data shows acceptance of very short stays (1-2 nights), indicating a dynamic, high-turnover market.
- A significant segment (11.4%) caters to monthly stays (30+ nights) in Palermo, pointing to opportunities in the extended-stay market.
Recommendations
- Align with the market by considering a 2 Nights minimum stay, as 36.4% of Palermo hosts use this setting.
- If feasible, allowing 1-night stays, especially midweek or during low season, could capture last-minute bookings, as only 24% currently do.
- Explore offering discounts for stays of 30+ nights to attract the 11.4% of the market seeking extended stays.
- Adjust minimum nights based on seasonality – potentially shorter during low season and longer during peak demand periods in Palermo.
Palermo Airbnb Cancellation Policy Trends Analysis (2025)
Super Strict 30 Days
47 listings
1.2% of total
Super Strict 60 Days
18 listings
0.5% of total
Flexible
1240 listings
32.7% of total
Moderate
1934 listings
51% of total
Strict
554 listings
14.6% of total
Cancellation Policy Insights for Palermo
- The prevailing Airbnb cancellation policy trend in Palermo is Moderate, used by 51% of listings.
- The market strongly favors guest-friendly terms, with 83.7% of listings offering Flexible or Moderate policies. This suggests guests in Palermo may expect booking flexibility.
Recommendations for Hosts
- Consider adopting a Moderate policy to align with the 51% market standard in Palermo.
- Using a Strict policy might deter some guests, as only 14.6% of listings use it. Evaluate if potential revenue protection outweighs possible lower booking rates.
- Regularly review your cancellation policy against competitors and market demand shifts in Palermo.
Palermo STR Booking Lead Time Analysis (2025)
Average Booking Lead Time by Month
Booking Lead Time Insights for Palermo
- The overall average booking lead time for vacation rentals in Palermo is 44 days.
- Guests book furthest in advance for stays during May (average 66 days), likely coinciding with peak travel demand or local events.
- The shortest booking windows occur for stays in February (average 37 days), indicating more last-minute travel plans during this time.
- Seasonally, Summer (61 days avg.) sees the longest lead times, while Winter (38 days avg.) has the shortest, reflecting typical travel planning cycles.
Recommendations for Hosts
- Use the overall average lead time (44 days) as a baseline for your pricing and availability strategy in Palermo.
- For May stays, consider implementing length-of-stay discounts or slightly higher rates for bookings made less than 66 days out to capitalize on advance planning.
- Target marketing efforts for the Summer season well in advance (at least 61 days) to capture early planners.
- Monitor your own booking lead times against these Palermo averages to identify opportunities for dynamic pricing adjustments.
Popular & Essential Airbnb Amenities in Palermo (2025)
Amenity Prevalence
Amenity Insights for Palermo
- Essential amenities in Palermo that guests expect include: Wifi, Air conditioning. Lacking these (any) could significantly impact bookings.
- Popular amenities like Hot water, Essentials, Hair dryer are common but not universal. Offering these can provide a competitive edge.
Recommendations for Hosts
- Ensure your listing includes all essential amenities for Palermo: Wifi, Air conditioning.
- Prioritize adding missing essentials: Wifi, Air conditioning.
- Consider adding popular differentiators like Hot water or Essentials to increase appeal.
- Highlight unique or less common amenities you offer (e.g., hot tub, dedicated workspace, EV charger) in your listing description and photos.
- Regularly check competitor amenities in Palermo to stay competitive.
Palermo Airbnb Guest Demographics & Profile Analysis (2025)
Guest Profile Summary for Palermo
- The typical guest profile for Airbnb in Palermo consists of predominantly international visitors (90%), with top international origins including Germany, typically belonging to the Post-2000s (Gen Z/Alpha) group (50%), primarily speaking English or French.
- Domestic travelers account for 10.5% of guests.
- Key international markets include France (15.2%) and Germany (14.5%).
- Top languages spoken are English (40.6%) followed by French (13.4%).
- A significant demographic segment is the Post-2000s (Gen Z/Alpha) group, representing 50% of guests.
Recommendations for Hosts
- Focus marketing internationally, particularly towards travelers from Germany.
- Tailor amenities and listing descriptions to appeal to the dominant Post-2000s (Gen Z/Alpha) demographic (e.g., highlight fast WiFi, smart home features, local guides).
- Highlight unique local experiences or amenities relevant to the primary guest profile.
- Consider seasonal promotions aligned with peak travel times for key origin markets.
Nearby Short-Term Rental Market Comparison
How does the Palermo Airbnb market stack up against its neighbors? Compare key performance metrics like average monthly revenue, ADR, and occupancy rates in surrounding areas to understand the broader regional STR landscape.
| Market | Active Properties | Monthly Revenue | Daily Rate | Avg. Occupancy |
|---|---|---|---|---|
| Partinico | 112 | $2,077 | $283.49 | 39% |
| Santa Flavia | 189 | $1,866 | $165.16 | 47% |
| Cefalù | 1,003 | $1,764 | $182.13 | 48% |
| San Marco d'Alunzio | 13 | $1,726 | $174.71 | 38% |
| Collesano | 47 | $1,716 | $240.89 | 35% |
| Buseto Palizzolo | 31 | $1,683 | $218.18 | 38% |
| Caronia | 41 | $1,674 | $178.18 | 44% |
| Mistretta | 10 | $1,627 | $153.31 | 39% |
| Altavilla Milicia | 79 | $1,568 | $210.58 | 42% |
| Acquedolci | 28 | $1,512 | $195.95 | 40% |