Mascali Airbnb Market Analysis 2025: Short Term Rental Data & Vacation Rental Statistics in Sicily, Italy
Is Airbnb profitable in Mascali in 2025? Explore comprehensive Airbnb analytics for Mascali, Sicily, Italy to uncover income potential. This 2025 STR market report for Mascali, based on AirROI data from April 2024 to March 2025, reveals key trends in the market of 242 active listings.
Whether you're considering an Airbnb investment in Mascali, optimizing your existing vacation rental, or exploring rental arbitrage opportunities, understanding the Mascali Airbnb data is crucial. Navigating the high regulation landscape is key to maximizing your short term rental income potential. Let's dive into the specifics.
Key Mascali Airbnb Performance Metrics Overview
Monthly Airbnb Revenue Variations & Income Potential in Mascali (2025)
Understanding the monthly revenue variations for Airbnb listings in Mascali is key to maximizing your short term rental income potential. Seasonality significantly impacts earnings. Our analysis, based on data from the past 12 months, shows that the peak revenue month for STRs in Mascali is typically August, while January often presents the lowest earnings, highlighting opportunities for strategic pricing adjustments during shoulder and low seasons. Explore the typical Airbnb income in Mascali across different performance tiers:
- Best-in-class properties (Top 10%) achieve $3,513+ monthly, often utilizing dynamic pricing and superior guest experiences.
- Strong performing properties (Top 25%) earn $1,939 or more, indicating effective management and desirable locations/amenities.
- Typical properties (Median) generate around $1,001 per month, representing the average market performance.
- Entry-level properties (Bottom 25%) see earnings around $417, often with potential for optimization.
Average Monthly Airbnb Earnings Trend in Mascali
Mascali Airbnb Occupancy Rate Trends (2025)
Maximize your bookings by understanding the Mascali STR occupancy trends. Seasonal demand shifts significantly influence how often properties are booked. Typically, Augustsees the highest demand (peak season occupancy), while January experiences the lowest (low season). Effective strategies, like adjusting minimum stays or offering promotions, can boost occupancy during slower periods. Here's how different property tiers perform in Mascali:
- Best-in-class properties (Top 10%) achieve 67%+ occupancy, indicating high desirability and potentially optimized availability.
- Strong performing properties (Top 25%) maintain 53% or higher occupancy, suggesting good market fit and guest satisfaction.
- Typical properties (Median) have an occupancy rate around 29%.
- Entry-level properties (Bottom 25%) average 13% occupancy, potentially facing higher vacancy.
Average Monthly Occupancy Rate Trend in Mascali
Average Daily Rate (ADR) Airbnb Trends in Mascali (2025)
Effective short term rental pricing strategy in Mascali involves understanding monthly ADR fluctuations. The Average Daily Rate (ADR) for Airbnb in Mascali typically peaks in August and dips lowest during February. Leveraging Airbnb dynamic pricing tools or strategies based on this seasonality can significantly boost revenue. Here's a look at the typical nightly rates achieved:
- Best-in-class properties (Top 10%) command rates of $217+ per night, often due to premium features or locations.
- Strong performing properties (Top 25%) achieve nightly rates of $130 or more.
- Typical properties (Median) charge around $95 per night.
- Entry-level properties (Bottom 25%) earn around $69 per night.
Average Daily Rate (ADR) Trend by Month in Mascali
Get Live Mascali Market Intelligence 👇

Explore Real-time Analytics
Airbnb Seasonality Analysis & Trends in Mascali (2025)
Peak Season (August, July, May)
- Revenue averages $2,492 per month
- Occupancy rates average 46.1%
- Daily rates average $138
Shoulder Season
- Revenue averages $1,658 per month
- Occupancy maintains around 34.8%
- Daily rates hold near $129
Low Season (January, February, December)
- Revenue drops to average $779 per month
- Occupancy decreases to average 21.9%
- Daily rates adjust to average $126
Seasonality Insights for Mascali
- The Airbnb seasonality in Mascali shows highly seasonal trends requiring careful strategy. While the sections above show seasonal averages, it's also insightful to look at the extremes:
- During the high season, the absolute peak month showcases Mascali's highest earning potential, with monthly revenues capable of climbing to $2,696, occupancy reaching a high of 50.2%, and ADRs peaking at $144.
- Conversely, the slowest single month of the year, typically falling within the low season, marks the market's lowest point. In this month, revenue might dip to $677, occupancy could drop to 19.4%, and ADRs may adjust down to $125.
- Understanding both the seasonal averages and these monthly peaks and troughs in revenue, occupancy, and ADR is crucial for maximizing your Airbnb profit potential in Mascali.
Seasonal Strategies for Maximizing Profit
- Peak Season: Maximize revenue through premium pricing and potentially longer minimum stays. Ensure high availability.
- Low Season: Offer competitive pricing, special promotions (e.g., extended stay discounts), and flexible cancellation policies. Target off-season travelers like remote workers or budget-conscious guests.
- Shoulder Seasons: Implement dynamic pricing that balances peak and low rates. Target weekend travelers or specific events. Offer slightly more flexible terms than peak season.
- Regularly analyze your own performance against these Mascali seasonality benchmarks and adjust your pricing and availability strategy accordingly.
Best Areas for Airbnb Investment in Mascali (2025)
Exploring the top neighborhoods for short-term rentals in Mascali? This section highlights key areas, outlining why they are attractive for hosts and guests, along with notable local attractions. Consider these locations based on your target guest profile and investment strategy.
| Neighborhood / Area | Why Host Here? (Target Guests & Appeal) | Key Attractions & Landmarks |
|---|---|---|
| Mascali Centro | The historical center of Mascali with charming streets and local cafes. It's a great place for travelers looking for authenticity and convenience to local attractions. | Chiesa Madre di Mascali, Parco dell'Etna, local markets, Museo della Civiltà Contadina |
| Marina di Cottone | A popular seaside area with beautiful beaches and a variety of water sports. Ideal for families and beach lovers looking for a relaxing vacation. | Cottone Beach, Water sports activities, Beach clubs, Restaurants along the coast |
| Etna National Park | A major natural attraction featuring hiking trails and stunning views of Mount Etna. Perfect for eco-tourists and adventure seekers. | Mount Etna, Hiking trails, Wine tasting tours, Cable cars to the summit |
| Taormina | A nearby luxury destination well-known for its ancient theatre and stunning views. Many tourists from Mascali visit for day trips. | Teatro Antico di Taormina, Isola Bella, Corso Umberto, Villa Comunale |
| Letojanni | A picturesque beach town located close to Mascali, great for those wanting beach access with a less crowded atmosphere. | Letojanni Beach, Seafront promenade, Local seafood restaurants |
| Riposto | Famous for its marina and fishing activities, a great choice for those looking to explore the Sicilian coast. | Riposto Marina, Fish market, Torre Archirafi beach |
| Fiumefreddo di Sicilia | A small town with lovely landscapes and easy access to the beach. Ideal for budget travelers looking for tranquility. | Fiumefreddo beach, Local wineries, Historic churches |
| Giarre | A charming town close to Mascali with shops and restaurants, offering a more local experience for visitors. | Church of St. Isidore, Via Garibaldi shops, Local festivals |
Understanding Airbnb License Requirements & STR Laws in Mascali (2025)
Yes, Mascali, Sicily, Italy enforces high STR regulations. Obtaining a license and ensuring compliance is almost certainly required according to current 2025 STR laws. Always verify the latest short term rental regulations and Airbnb license requirements directly with local government authorities for Mascali to ensure full compliance before hosting.
(Source: AirROI data, 2025, based on 45% licensed listings)
Top Performing Airbnb Properties in Mascali (2025)
Benchmark your potential! Explore examples of top-performing Airbnb properties in Mascalibased on Trailing Twelve Month (TTM) revenue. Analyze their characteristics, revenue, occupancy rate, and ADR to understand what drives success in this market.

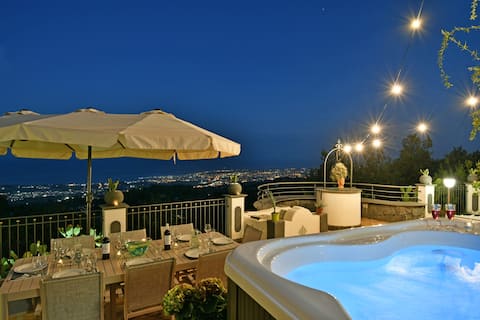
Mediterranean Charm Villa with Pool by the Sea
Entire Place • 6 bedrooms
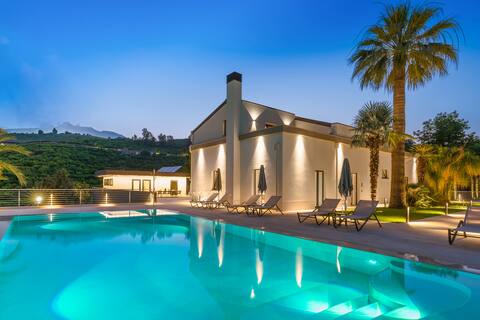
Bellavista Etna 320 SQM VILLA,POOL + JACUZZI
Entire Place • 6 bedrooms
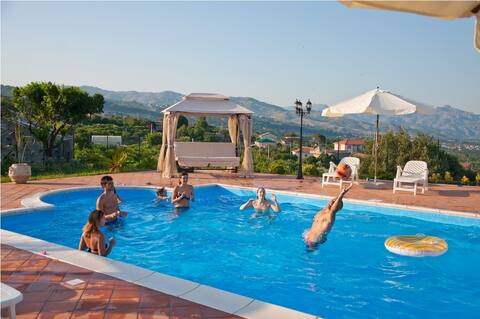
Gianos Villa
Entire Place • 6 bedrooms

Villa infinity pool zeezicht Taormina Etna*****
Entire Place • 3 bedrooms
Villa Trinacria - Taormina, Sea and Etna - SunTrip
Entire Place • 5 bedrooms
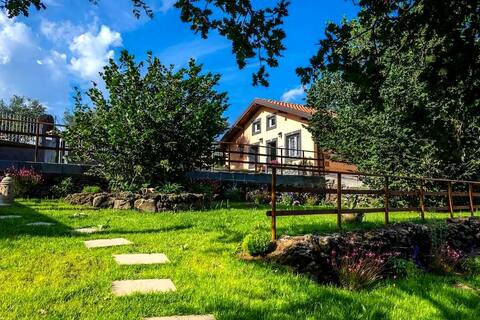
Villa del Gelso - Chalet in Etna Park
Entire Place • 4 bedrooms
Note: Performance varies based on location, size, amenities, seasonality, and management quality. Data reflects the past 12 months.
Top Performing Airbnb Hosts in Mascali (2025)
Learn from the best! This table showcases top-performing Airbnb hosts in Mascali based on the number of properties managed and estimated total revenue over the past year. Analyze their scale and performance metrics.
| Host Name | Properties | Grossing Revenue | Stay Reviews | Avg Rating |
|---|---|---|---|---|
| Salvo | 2 | $219,296 | 169 | 4.84/5.0 |
| Studio In | 11 | $217,333 | 97 | 2.94/5.0 |
| Salvatore | 6 | $199,428 | 154 | 4.15/5.0 |
| Sicily Pool Chalet | 3 | $129,977 | 36 | 3.28/5.0 |
| Alberto Vincenzo | 1 | $112,504 | 169 | 4.93/5.0 |
| Antonio | 1 | $89,370 | 3 | 5.00/5.0 |
| Sandra | 1 | $87,797 | 52 | 4.96/5.0 |
| Giuseppe | 3 | $83,311 | 219 | 4.73/5.0 |
| Cinzia | 6 | $81,703 | 320 | 4.82/5.0 |
| Giovanni | 1 | $79,360 | 83 | 4.60/5.0 |
Analyzing the strategies of top hosts, such as their property selection, pricing, and guest communication, can offer valuable lessons for optimizing your own Airbnb operations in Mascali.
Dive Deeper: Advanced Mascali STR Market Data (2025)
Ready to unlock more insights? AirROI provides access to advanced metrics and comprehensive Airbnb data for Mascali. Explore detailed analytics beyond this report to refine your investment strategy, optimize pricing, and maximize your vacation rental profits.
Explore Advanced MetricsMascali Short-Term Rental Market Composition (2025): Property & Room Types
Room Type Distribution
Property Type Distribution
Market Composition Insights for Mascali
- The Mascali Airbnb market composition is heavily skewed towards Entire Home/Apt listings, which make up 94.6% of the 242 active rentals. This indicates strong guest preference for privacy and space.
- Looking at the property type distribution in Mascali, Apartment/Condo properties are the most common (49.6%), reflecting the local real estate landscape.
- Houses represent a significant 40.5% portion, catering likely to families or larger groups.
- Smaller segments like hotel/boutique (combined 3.3%) offer potential for unique stay experiences.
Mascali Airbnb Room Capacity Analysis (2025): Bedroom Distribution
Distribution of Listings by Number of Bedrooms
Room Capacity Insights for Mascali
- The dominant room capacity in Mascali is 1 bedroom listings, making up 43% of the market. This suggests a strong demand for properties suitable for couples or solo travelers.
- Together, 1 bedroom and 2 bedrooms properties represent 76.1% of the active Airbnb listings in Mascali, indicating a high concentration in these sizes.
- A significant 20.2% of listings offer 3+ bedrooms, catering to larger groups and families seeking more space in Mascali.
Mascali Vacation Rental Guest Capacity Trends (2025)
Distribution of Listings by Guest Capacity
Guest Capacity Insights for Mascali
- The most common guest capacity trend in Mascali vacation rentals is listings accommodating 4 guests (32.6%). This suggests the primary traveler segment is likely small families or groups.
- Properties designed for 4 guests and 6 guests dominate the Mascali STR market, accounting for 52.4% of listings.
- 34.3% of properties accommodate 6+ guests, serving the market segment for larger families or group travel in Mascali.
- On average, properties in Mascali are equipped to host 4.8 guests.
Mascali Airbnb Booking Patterns (2025): Available vs. Booked Days
Available Days Distribution
Booked Days Distribution
Booking Pattern Insights for Mascali
- The most common availability pattern in Mascali falls within the 271-366 days range, representing 66.5% of listings. This suggests many properties have significant open periods on their calendars.
- Approximately 88.4% of listings show high availability (181+ days open annually), indicating potential for increased bookings or specific owner usage patterns.
- For booked days, the 31-90 days range is most frequent in Mascali (32.2%), reflecting common guest stay durations or potential owner blocking patterns.
- A notable 14.0% of properties secure long booking periods (181+ days booked per year), highlighting successful long-term rental strategies or significant owner usage.
Mascali Airbnb Minimum Stay Requirements Analysis
Distribution of Listings by Minimum Night Requirement
1 Night
25 listings
11.4% of total
2 Nights
44 listings
20.1% of total
3 Nights
47 listings
21.5% of total
4-6 Nights
43 listings
19.6% of total
7-29 Nights
41 listings
18.7% of total
30+ Nights
19 listings
8.7% of total
Key Insights
- The most prevalent minimum stay requirement in Mascali is 3 Nights, adopted by 21.5% of listings. This highlights the market's preference for longer commitments.
Recommendations
- Align with the market by considering a 3 Nights minimum stay, as 21.5% of Mascali hosts use this setting.
- If feasible, allowing 1-night stays, especially midweek or during low season, could capture last-minute bookings, as only 11.4% currently do.
- Explore offering discounts for stays of 30+ nights to attract the 8.7% of the market seeking extended stays.
- Adjust minimum nights based on seasonality – potentially shorter during low season and longer during peak demand periods in Mascali.
Mascali Airbnb Cancellation Policy Trends Analysis (2025)
Super Strict 30 Days
11 listings
6.3% of total
Super Strict 60 Days
1 listings
0.6% of total
Flexible
38 listings
21.8% of total
Moderate
88 listings
50.6% of total
Strict
36 listings
20.7% of total
Cancellation Policy Insights for Mascali
- The prevailing Airbnb cancellation policy trend in Mascali is Moderate, used by 50.6% of listings.
- The market strongly favors guest-friendly terms, with 72.4% of listings offering Flexible or Moderate policies. This suggests guests in Mascali may expect booking flexibility.
Recommendations for Hosts
- Consider adopting a Moderate policy to align with the 50.6% market standard in Mascali.
- Regularly review your cancellation policy against competitors and market demand shifts in Mascali.
Mascali STR Booking Lead Time Analysis (2025)
Average Booking Lead Time by Month
Booking Lead Time Insights for Mascali
- The overall average booking lead time for vacation rentals in Mascali is 55 days.
- Guests book furthest in advance for stays during May (average 88 days), likely coinciding with peak travel demand or local events.
- The shortest booking windows occur for stays in February (average 36 days), indicating more last-minute travel plans during this time.
- Seasonally, Summer (74 days avg.) sees the longest lead times, while Winter (43 days avg.) has the shortest, reflecting typical travel planning cycles.
Recommendations for Hosts
- Use the overall average lead time (55 days) as a baseline for your pricing and availability strategy in Mascali.
- For May stays, consider implementing length-of-stay discounts or slightly higher rates for bookings made less than 88 days out to capitalize on advance planning.
- Target marketing efforts for the Summer season well in advance (at least 74 days) to capture early planners.
- Monitor your own booking lead times against these Mascali averages to identify opportunities for dynamic pricing adjustments.
Popular & Essential Airbnb Amenities in Mascali (2025)
Amenity Prevalence
Amenity Insights for Mascali
- Essential amenities in Mascali that guests expect include: Essentials. Lacking these (this) could significantly impact bookings.
- Popular amenities like Kitchen, Hot water, TV are common but not universal. Offering these can provide a competitive edge.
- Warning: Wifi is not universally provided but is considered essential globally. Ensure reliable Wifi is offered.
Recommendations for Hosts
- Ensure your listing includes all essential amenities for Mascali: Essentials.
- Prioritize adding missing essentials: Essentials.
- Consider adding popular differentiators like Kitchen or Hot water to increase appeal.
- Highlight unique or less common amenities you offer (e.g., hot tub, dedicated workspace, EV charger) in your listing description and photos.
- Regularly check competitor amenities in Mascali to stay competitive.
Mascali Airbnb Guest Demographics & Profile Analysis (2025)
Guest Profile Summary for Mascali
- The typical guest profile for Airbnb in Mascali consists of predominantly international visitors (90%), with top international origins including Germany, typically belonging to the Post-2000s (Gen Z/Alpha) group (50%), primarily speaking English or French.
- Domestic travelers account for 10.5% of guests.
- Key international markets include France (21%) and Germany (16.1%).
- Top languages spoken are English (35.8%) followed by French (14.2%).
- A significant demographic segment is the Post-2000s (Gen Z/Alpha) group, representing 50% of guests.
Recommendations for Hosts
- Focus marketing internationally, particularly towards travelers from Germany.
- Tailor amenities and listing descriptions to appeal to the dominant Post-2000s (Gen Z/Alpha) demographic (e.g., highlight fast WiFi, smart home features, local guides).
- Highlight unique local experiences or amenities relevant to the primary guest profile.
- Consider seasonal promotions aligned with peak travel times for key origin markets.
Nearby Short-Term Rental Market Comparison
How does the Mascali Airbnb market stack up against its neighbors? Compare key performance metrics like average monthly revenue, ADR, and occupancy rates in surrounding areas to understand the broader regional STR landscape.
| Market | Active Properties | Monthly Revenue | Daily Rate | Avg. Occupancy |
|---|---|---|---|---|
| Taormina | 973 | $2,450 | $221.38 | 47% |
| Għasri | 56 | $2,339 | $216.90 | 40% |
| Graniti | 20 | $2,135 | $168.67 | 47% |
| Torregrotta | 16 | $2,105 | $267.72 | 36% |
| Viagrande | 34 | $1,921 | $196.41 | 38% |
| Gaggi | 16 | $1,892 | $190.10 | 40% |
| Santa Venerina | 53 | $1,872 | $219.97 | 41% |
| Xewkija | 36 | $1,766 | $167.34 | 43% |
| Cefalù | 1,003 | $1,764 | $182.13 | 48% |
| San Marco d'Alunzio | 13 | $1,726 | $174.71 | 38% |