Lipari Airbnb Market Analysis 2025: Short Term Rental Data & Vacation Rental Statistics in Sicily, Italy
Is Airbnb profitable in Lipari in 2025? Explore comprehensive Airbnb analytics for Lipari, Sicily, Italy to uncover income potential. This 2025 STR market report for Lipari, based on AirROI data from April 2024 to March 2025, reveals key trends in the market of 899 active listings.
Whether you're considering an Airbnb investment in Lipari, optimizing your existing vacation rental, or exploring rental arbitrage opportunities, understanding the Lipari Airbnb data is crucial. Navigating the high regulation landscape is key to maximizing your short term rental income potential. Let's dive into the specifics.
Key Lipari Airbnb Performance Metrics Overview
Monthly Airbnb Revenue Variations & Income Potential in Lipari (2025)
Understanding the monthly revenue variations for Airbnb listings in Lipari is key to maximizing your short term rental income potential. Seasonality significantly impacts earnings. Our analysis, based on data from the past 12 months, shows that the peak revenue month for STRs in Lipari is typically August, while February often presents the lowest earnings, highlighting opportunities for strategic pricing adjustments during shoulder and low seasons. Explore the typical Airbnb income in Lipari across different performance tiers:
- Best-in-class properties (Top 10%) achieve $3,028+ monthly, often utilizing dynamic pricing and superior guest experiences.
- Strong performing properties (Top 25%) earn $1,815 or more, indicating effective management and desirable locations/amenities.
- Typical properties (Median) generate around $999 per month, representing the average market performance.
- Entry-level properties (Bottom 25%) see earnings around $484, often with potential for optimization.
Average Monthly Airbnb Earnings Trend in Lipari
Lipari Airbnb Occupancy Rate Trends (2025)
Maximize your bookings by understanding the Lipari STR occupancy trends. Seasonal demand shifts significantly influence how often properties are booked. Typically, Augustsees the highest demand (peak season occupancy), while December experiences the lowest (low season). Effective strategies, like adjusting minimum stays or offering promotions, can boost occupancy during slower periods. Here's how different property tiers perform in Lipari:
- Best-in-class properties (Top 10%) achieve 65%+ occupancy, indicating high desirability and potentially optimized availability.
- Strong performing properties (Top 25%) maintain 45% or higher occupancy, suggesting good market fit and guest satisfaction.
- Typical properties (Median) have an occupancy rate around 27%.
- Entry-level properties (Bottom 25%) average 12% occupancy, potentially facing higher vacancy.
Average Monthly Occupancy Rate Trend in Lipari
Average Daily Rate (ADR) Airbnb Trends in Lipari (2025)
Effective short term rental pricing strategy in Lipari involves understanding monthly ADR fluctuations. The Average Daily Rate (ADR) for Airbnb in Lipari typically peaks in August and dips lowest during March. Leveraging Airbnb dynamic pricing tools or strategies based on this seasonality can significantly boost revenue. Here's a look at the typical nightly rates achieved:
- Best-in-class properties (Top 10%) command rates of $307+ per night, often due to premium features or locations.
- Strong performing properties (Top 25%) achieve nightly rates of $183 or more.
- Typical properties (Median) charge around $115 per night.
- Entry-level properties (Bottom 25%) earn around $79 per night.
Average Daily Rate (ADR) Trend by Month in Lipari
Get Live Lipari Market Intelligence 👇

Explore Real-time Analytics
Airbnb Seasonality Analysis & Trends in Lipari (2025)
Peak Season (August, July, September)
- Revenue averages $2,498 per month
- Occupancy rates average 47.1%
- Daily rates average $188
Shoulder Season
- Revenue averages $1,184 per month
- Occupancy maintains around 29.1%
- Daily rates hold near $161
Low Season (January, February, December)
- Revenue drops to average $735 per month
- Occupancy decreases to average 20.4%
- Daily rates adjust to average $144
Seasonality Insights for Lipari
- The Airbnb seasonality in Lipari shows highly seasonal trends requiring careful strategy. While the sections above show seasonal averages, it's also insightful to look at the extremes:
- During the high season, the absolute peak month showcases Lipari's highest earning potential, with monthly revenues capable of climbing to $3,358, occupancy reaching a high of 56.5%, and ADRs peaking at $201.
- Conversely, the slowest single month of the year, typically falling within the low season, marks the market's lowest point. In this month, revenue might dip to $677, occupancy could drop to 19.4%, and ADRs may adjust down to $141.
- Understanding both the seasonal averages and these monthly peaks and troughs in revenue, occupancy, and ADR is crucial for maximizing your Airbnb profit potential in Lipari.
Seasonal Strategies for Maximizing Profit
- Peak Season: Maximize revenue through premium pricing and potentially longer minimum stays. Ensure high availability.
- Low Season: Offer competitive pricing, special promotions (e.g., extended stay discounts), and flexible cancellation policies. Target off-season travelers like remote workers or budget-conscious guests.
- Shoulder Seasons: Implement dynamic pricing that balances peak and low rates. Target weekend travelers or specific events. Offer slightly more flexible terms than peak season.
- Regularly analyze your own performance against these Lipari seasonality benchmarks and adjust your pricing and availability strategy accordingly.
Best Areas for Airbnb Investment in Lipari (2025)
Exploring the top neighborhoods for short-term rentals in Lipari? This section highlights key areas, outlining why they are attractive for hosts and guests, along with notable local attractions. Consider these locations based on your target guest profile and investment strategy.
| Neighborhood / Area | Why Host Here? (Target Guests & Appeal) | Key Attractions & Landmarks |
|---|---|---|
| Marina Corta | Charming harbor area with picturesque views of the sea and boats. Perfect for guests who want to explore the local culture and enjoy seafood restaurants and cafes. | Marina Corta, Church of San Bartolomeo, Lidia's Statue, Seafood Restaurants, Boat Tours |
| Lipari Town | The main town on the island, offering a mix of history, culture, and vibrant local life. Great base for travelers looking to explore Lipari's historical sites and local shops. | Castello di Lipari, Museo Archeologico Eoliano, Piazza di Lipari, Local Markets, Cathedral of San Bartolomeo |
| Canneto | A beautiful beach area known for its sandy shores and shallow waters, ideal for families and sun-seekers. Attractive for guests wanting a beach holiday experience. | Spiaggia di Canneto, Beachfront Restaurants, Water Sports, Beach Bars, Sunset Views |
| Porticello | A quiet coastal area with small beaches and stunning views, perfect for visitors looking for relaxation away from the crowds. | Porticello Beach, Scenic Walking Trails, Fishing Opportunities, Quiet Cafes, Local Craft Shops |
| Valle Muria | Known for its pristine natural landscapes and hiking opportunities, this area attracts nature lovers and those looking to escape into nature while still being close to the amenities. | Hiking Trails, Secluded Beaches, Breathtaking Cliffs, Wildlife Viewing, Scenic Picnic Spots |
| Acquacalda | A peaceful beach village with a laid-back vibe, perfect for travelers seeking tranquility, beach activities, and beautiful sunsets. | Acquacalda Beach, Café and Gelato Shops, Local Fish Tacos, Coastal Walks, Relaxing Atmosphere |
| Punta Spadillo | Offers stunning views of the coast and the nearby islands, appealing to hikers and scenic view seekers. Excellent for those looking to relax and enjoy nature. | Lighthouse, Beautiful Hiking Paths, Viewpoints, Nature Photography, Wildflowers |
| Quattropani | Rich in natural beauty and less crowded, ideal for those wanting to enjoy hiking and the outdoor experience while being close to the main attractions of Lipari. | Hiking Trails, Local Flora and Fauna, Community Farms, Historic Sites, Panoramic Views |
Understanding Airbnb License Requirements & STR Laws in Lipari (2025)
Yes, Lipari, Sicily, Italy enforces high STR regulations. Obtaining a license and ensuring compliance is almost certainly required according to current 2025 STR laws. Always verify the latest short term rental regulations and Airbnb license requirements directly with local government authorities for Lipari to ensure full compliance before hosting.
(Source: AirROI data, 2025, based on 47% licensed listings)
Top Performing Airbnb Properties in Lipari (2025)
Benchmark your potential! Explore examples of top-performing Airbnb properties in Liparibased on Trailing Twelve Month (TTM) revenue. Analyze their characteristics, revenue, occupancy rate, and ADR to understand what drives success in this market.
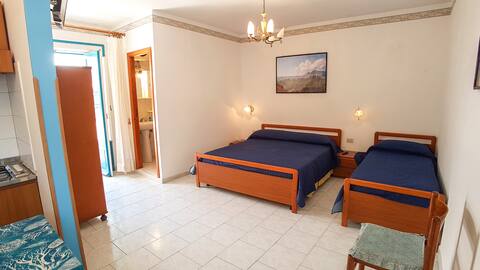
appartamento DBl terrazzo
Private Room • 1 bedroom
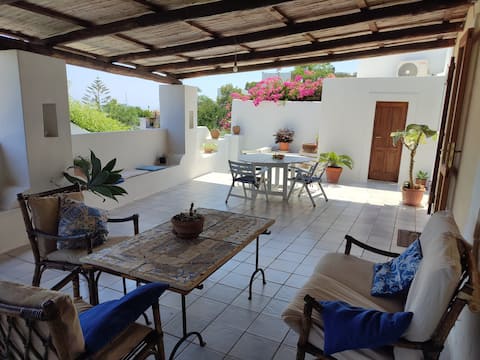
Casa Panarea
Entire Place • 2 bedrooms

Casa 34 Dec
Entire Place • 2 bedrooms
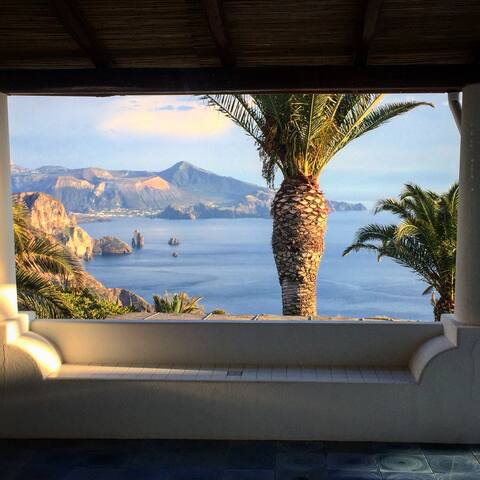
villa fully equipped 2BR terrace sea&vulcano view
Entire Place • 2 bedrooms
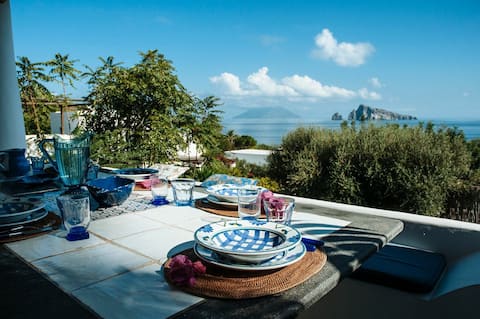
Typical Aeolian Villa with seaview
Entire Place • 3 bedrooms
GIL'S DREAM travel & work(super-WiFi) in paradise
Entire Place • 3 bedrooms
Note: Performance varies based on location, size, amenities, seasonality, and management quality. Data reflects the past 12 months.
Top Performing Airbnb Hosts in Lipari (2025)
Learn from the best! This table showcases top-performing Airbnb hosts in Lipari based on the number of properties managed and estimated total revenue over the past year. Analyze their scale and performance metrics.
| Host Name | Properties | Grossing Revenue | Stay Reviews | Avg Rating |
|---|---|---|---|---|
| Giuseppe | 21 | $259,487 | 97 | 1.35/5.0 |
| Claudio | 11 | $169,309 | 631 | 4.89/5.0 |
| Susanna | 7 | $119,367 | 25 | 2.14/5.0 |
| Carlo | 6 | $118,997 | 267 | 4.92/5.0 |
| Valentina | 7 | $104,731 | 55 | 4.19/5.0 |
| Massimiliano | 2 | $99,961 | 74 | 4.94/5.0 |
| Giuseppe | 5 | $98,906 | 433 | 4.91/5.0 |
| Giusi Emanuela | 4 | $97,943 | 22 | 3.58/5.0 |
| Luca | 3 | $95,471 | 164 | 4.94/5.0 |
| Marco | 4 | $94,358 | 180 | 4.83/5.0 |
Analyzing the strategies of top hosts, such as their property selection, pricing, and guest communication, can offer valuable lessons for optimizing your own Airbnb operations in Lipari.
Dive Deeper: Advanced Lipari STR Market Data (2025)
Ready to unlock more insights? AirROI provides access to advanced metrics and comprehensive Airbnb data for Lipari. Explore detailed analytics beyond this report to refine your investment strategy, optimize pricing, and maximize your vacation rental profits.
Explore Advanced MetricsLipari Short-Term Rental Market Composition (2025): Property & Room Types
Room Type Distribution
Property Type Distribution
Market Composition Insights for Lipari
- The Lipari Airbnb market composition is heavily skewed towards Entire Home/Apt listings, which make up 85% of the 899 active rentals. This indicates strong guest preference for privacy and space.
- Looking at the property type distribution in Lipari, House properties are the most common (54.4%), reflecting the local real estate landscape.
- Houses represent a significant 54.4% portion, catering likely to families or larger groups.
- Smaller segments like hotel/boutique, outdoor/unique, others, unique stays (combined 5.4%) offer potential for unique stay experiences.
Lipari Airbnb Room Capacity Analysis (2025): Bedroom Distribution
Distribution of Listings by Number of Bedrooms
Room Capacity Insights for Lipari
- The dominant room capacity in Lipari is 1 bedroom listings, making up 50.8% of the market. This suggests a strong demand for properties suitable for couples or solo travelers.
- Together, 1 bedroom and 2 bedrooms properties represent 77.2% of the active Airbnb listings in Lipari, indicating a high concentration in these sizes.
- With over half the market (50.8%) consisting of studios or 1-bedroom units, Lipari is particularly well-suited for individuals or couples.
Lipari Vacation Rental Guest Capacity Trends (2025)
Distribution of Listings by Guest Capacity
Guest Capacity Insights for Lipari
- The most common guest capacity trend in Lipari vacation rentals is listings accommodating 4 guests (26.3%). This suggests the primary traveler segment is likely small families or groups.
- Properties designed for 4 guests and 2 guests dominate the Lipari STR market, accounting for 49.8% of listings.
- 20.3% of properties accommodate 6+ guests, serving the market segment for larger families or group travel in Lipari.
- On average, properties in Lipari are equipped to host 3.8 guests.
Lipari Airbnb Booking Patterns (2025): Available vs. Booked Days
Available Days Distribution
Booked Days Distribution
Booking Pattern Insights for Lipari
- The most common availability pattern in Lipari falls within the 271-366 days range, representing 72.2% of listings. This suggests many properties have significant open periods on their calendars.
- Approximately 96.6% of listings show high availability (181+ days open annually), indicating potential for increased bookings or specific owner usage patterns.
- For booked days, the 31-90 days range is most frequent in Lipari (37.2%), reflecting common guest stay durations or potential owner blocking patterns.
- A notable 4.1% of properties secure long booking periods (181+ days booked per year), highlighting successful long-term rental strategies or significant owner usage.
Lipari Airbnb Minimum Stay Requirements Analysis
Distribution of Listings by Minimum Night Requirement
1 Night
128 listings
15% of total
2 Nights
174 listings
20.4% of total
3 Nights
206 listings
24.2% of total
4-6 Nights
160 listings
18.8% of total
7-29 Nights
155 listings
18.2% of total
30+ Nights
28 listings
3.3% of total
Key Insights
- The most prevalent minimum stay requirement in Lipari is 3 Nights, adopted by 24.2% of listings. This highlights the market's preference for longer commitments.
Recommendations
- Align with the market by considering a 3 Nights minimum stay, as 24.2% of Lipari hosts use this setting.
- If feasible, allowing 1-night stays, especially midweek or during low season, could capture last-minute bookings, as only 15% currently do.
- Adjust minimum nights based on seasonality – potentially shorter during low season and longer during peak demand periods in Lipari.
Lipari Airbnb Cancellation Policy Trends Analysis (2025)
Super Strict 60 Days
1 listings
0.1% of total
Super Strict 30 Days
12 listings
1.6% of total
Flexible
106 listings
14.3% of total
Moderate
286 listings
38.6% of total
Strict
335 listings
45.3% of total
Cancellation Policy Insights for Lipari
- The prevailing Airbnb cancellation policy trend in Lipari is Strict, used by 45.3% of listings.
- There's a relatively balanced mix between guest-friendly (52.9%) and stricter (45.3%) policies, offering choices for different guest needs.
Recommendations for Hosts
- Consider adopting a Strict policy to align with the 45.3% market standard in Lipari.
- With 45.3% using Strict terms, this is a viable option in Lipari, particularly for high-value properties or during peak demand periods.
- Regularly review your cancellation policy against competitors and market demand shifts in Lipari.
Lipari STR Booking Lead Time Analysis (2025)
Average Booking Lead Time by Month
Booking Lead Time Insights for Lipari
- The overall average booking lead time for vacation rentals in Lipari is 64 days.
- Guests book furthest in advance for stays during August (average 86 days), likely coinciding with peak travel demand or local events.
- The shortest booking windows occur for stays in January (average 32 days), indicating more last-minute travel plans during this time.
- Seasonally, Summer (77 days avg.) sees the longest lead times, while Winter (35 days avg.) has the shortest, reflecting typical travel planning cycles.
Recommendations for Hosts
- Use the overall average lead time (64 days) as a baseline for your pricing and availability strategy in Lipari.
- For August stays, consider implementing length-of-stay discounts or slightly higher rates for bookings made less than 86 days out to capitalize on advance planning.
- Target marketing efforts for the Summer season well in advance (at least 77 days) to capture early planners.
- Monitor your own booking lead times against these Lipari averages to identify opportunities for dynamic pricing adjustments.
Popular & Essential Airbnb Amenities in Lipari (2025)
Amenity Prevalence
Amenity Insights for Lipari
- Popular amenities like Kitchen, Essentials, Hot water are common but not universal. Offering these can provide a competitive edge.
Recommendations for Hosts
- Consider adding popular differentiators like Kitchen or Essentials to increase appeal.
- Highlight unique or less common amenities you offer (e.g., hot tub, dedicated workspace, EV charger) in your listing description and photos.
- Regularly check competitor amenities in Lipari to stay competitive.
Lipari Airbnb Guest Demographics & Profile Analysis (2025)
Guest Profile Summary for Lipari
- The typical guest profile for Airbnb in Lipari consists of predominantly international visitors (70%), with top international origins including France, typically belonging to the Post-2000s (Gen Z/Alpha) group (50%), primarily speaking English or Italian.
- Domestic travelers account for 30.5% of guests.
- Key international markets include Italy (30.5%) and France (21.1%).
- Top languages spoken are English (36.6%) followed by Italian (19.2%).
- A significant demographic segment is the Post-2000s (Gen Z/Alpha) group, representing 50% of guests.
Recommendations for Hosts
- Focus marketing internationally, particularly towards travelers from France.
- Tailor amenities and listing descriptions to appeal to the dominant Post-2000s (Gen Z/Alpha) demographic (e.g., highlight fast WiFi, smart home features, local guides).
- Highlight unique local experiences or amenities relevant to the primary guest profile.
- Consider seasonal promotions aligned with peak travel times for key origin markets.
Nearby Short-Term Rental Market Comparison
How does the Lipari Airbnb market stack up against its neighbors? Compare key performance metrics like average monthly revenue, ADR, and occupancy rates in surrounding areas to understand the broader regional STR landscape.
| Market | Active Properties | Monthly Revenue | Daily Rate | Avg. Occupancy |
|---|---|---|---|---|
| Taormina | 973 | $2,450 | $221.38 | 47% |
| Graniti | 20 | $2,135 | $168.67 | 47% |
| Torregrotta | 16 | $2,105 | $267.72 | 36% |
| Partinico | 112 | $2,077 | $283.49 | 39% |
| Viagrande | 34 | $1,921 | $196.41 | 38% |
| Gaggi | 16 | $1,892 | $190.10 | 40% |
| Santa Venerina | 53 | $1,872 | $219.97 | 41% |
| Santa Flavia | 189 | $1,866 | $165.16 | 47% |
| Cefalù | 1,003 | $1,764 | $182.13 | 48% |
| San Marco d'Alunzio | 13 | $1,726 | $174.71 | 38% |