Lascari Airbnb Market Analysis 2025: Short Term Rental Data & Vacation Rental Statistics in Sicily, Italy
Is Airbnb profitable in Lascari in 2025? Explore comprehensive Airbnb analytics for Lascari, Sicily, Italy to uncover income potential. This 2025 STR market report for Lascari, based on AirROI data from April 2024 to March 2025, reveals key trends in the niche market of 84 active listings.
Whether you're considering an Airbnb investment in Lascari, optimizing your existing vacation rental, or exploring rental arbitrage opportunities, understanding the Lascari Airbnb data is crucial. Navigating the high regulation landscape is key to maximizing your short term rental income potential. Let's dive into the specifics.
Key Lascari Airbnb Performance Metrics Overview
Monthly Airbnb Revenue Variations & Income Potential in Lascari (2025)
Understanding the monthly revenue variations for Airbnb listings in Lascari is key to maximizing your short term rental income potential. Seasonality significantly impacts earnings. Our analysis, based on data from the past 12 months, shows that the peak revenue month for STRs in Lascari is typically August, while March often presents the lowest earnings, highlighting opportunities for strategic pricing adjustments during shoulder and low seasons. Explore the typical Airbnb income in Lascari across different performance tiers:
- Best-in-class properties (Top 10%) achieve $4,465+ monthly, often utilizing dynamic pricing and superior guest experiences.
- Strong performing properties (Top 25%) earn $2,555 or more, indicating effective management and desirable locations/amenities.
- Typical properties (Median) generate around $1,184 per month, representing the average market performance.
- Entry-level properties (Bottom 25%) see earnings around $532, often with potential for optimization.
Average Monthly Airbnb Earnings Trend in Lascari
Lascari Airbnb Occupancy Rate Trends (2025)
Maximize your bookings by understanding the Lascari STR occupancy trends. Seasonal demand shifts significantly influence how often properties are booked. Typically, Augustsees the highest demand (peak season occupancy), while December experiences the lowest (low season). Effective strategies, like adjusting minimum stays or offering promotions, can boost occupancy during slower periods. Here's how different property tiers perform in Lascari:
- Best-in-class properties (Top 10%) achieve 71%+ occupancy, indicating high desirability and potentially optimized availability.
- Strong performing properties (Top 25%) maintain 52% or higher occupancy, suggesting good market fit and guest satisfaction.
- Typical properties (Median) have an occupancy rate around 30%.
- Entry-level properties (Bottom 25%) average 14% occupancy, potentially facing higher vacancy.
Average Monthly Occupancy Rate Trend in Lascari
Average Daily Rate (ADR) Airbnb Trends in Lascari (2025)
Effective short term rental pricing strategy in Lascari involves understanding monthly ADR fluctuations. The Average Daily Rate (ADR) for Airbnb in Lascari typically peaks in November and dips lowest during April. Leveraging Airbnb dynamic pricing tools or strategies based on this seasonality can significantly boost revenue. Here's a look at the typical nightly rates achieved:
- Best-in-class properties (Top 10%) command rates of $533+ per night, often due to premium features or locations.
- Strong performing properties (Top 25%) achieve nightly rates of $217 or more.
- Typical properties (Median) charge around $118 per night.
- Entry-level properties (Bottom 25%) earn around $82 per night.
Average Daily Rate (ADR) Trend by Month in Lascari
Get Live Lascari Market Intelligence 👇
Explore Real-time Analytics
Airbnb Seasonality Analysis & Trends in Lascari (2025)
Peak Season (August, October, July)
- Revenue averages $3,291 per month
- Occupancy rates average 44.8%
- Daily rates average $189
Shoulder Season
- Revenue averages $1,913 per month
- Occupancy maintains around 35.0%
- Daily rates hold near $202
Low Season (January, February, March)
- Revenue drops to average $913 per month
- Occupancy decreases to average 23.9%
- Daily rates adjust to average $269
Seasonality Insights for Lascari
- The Airbnb seasonality in Lascari shows highly seasonal trends requiring careful strategy. While the sections above show seasonal averages, it's also insightful to look at the extremes:
- During the high season, the absolute peak month showcases Lascari's highest earning potential, with monthly revenues capable of climbing to $4,025, occupancy reaching a high of 49.6%, and ADRs peaking at $309.
- Conversely, the slowest single month of the year, typically falling within the low season, marks the market's lowest point. In this month, revenue might dip to $773, occupancy could drop to 20.8%, and ADRs may adjust down to $142.
- Understanding both the seasonal averages and these monthly peaks and troughs in revenue, occupancy, and ADR is crucial for maximizing your Airbnb profit potential in Lascari.
Seasonal Strategies for Maximizing Profit
- Peak Season: Maximize revenue through premium pricing and potentially longer minimum stays. Ensure high availability.
- Low Season: Offer competitive pricing, special promotions (e.g., extended stay discounts), and flexible cancellation policies. Target off-season travelers like remote workers or budget-conscious guests.
- Shoulder Seasons: Implement dynamic pricing that balances peak and low rates. Target weekend travelers or specific events. Offer slightly more flexible terms than peak season.
- Regularly analyze your own performance against these Lascari seasonality benchmarks and adjust your pricing and availability strategy accordingly.
Best Areas for Airbnb Investment in Lascari (2025)
Exploring the top neighborhoods for short-term rentals in Lascari? This section highlights key areas, outlining why they are attractive for hosts and guests, along with notable local attractions. Consider these locations based on your target guest profile and investment strategy.
| Neighborhood / Area | Why Host Here? (Target Guests & Appeal) | Key Attractions & Landmarks |
|---|---|---|
| Lascari Beach | A beautiful stretch of sandy coastline ideal for sunbathers and water sports enthusiasts. Popular among families and tourists looking to enjoy the Mediterranean sun and sea. | Lascari Beach, Lido delle Nazionali, Tonnara di Lascari, water sports activities, local seafood restaurants |
| Cefalù | Just a short drive from Lascari, this historic town is famous for its stunning medieval architecture, beautiful beaches, and vibrant nightlife. A must-visit for cultural tourists and beachgoers alike. | Cefalù Cathedral, La Rocca, Cefalù Beach, Museo Mandralisca, Old town of Cefalù |
| Madonie Regional Park | A natural park offering breathtaking landscapes, hiking trails, and a chance to experience the local flora and fauna. Perfect for nature lovers and those seeking peace and tranquility. | Pizzo Carbonara, Cascate delle Due Rocche, Local wildlife trails, hiking and trekking routes |
| San Marco dei Cavoti | Known for its picturesque views and charm, this small town attracts visitors looking for a peaceful retreat and local culture. A hidden gem in the area. | Historic churches, Local festivals, Spectacular landscapes, Quiet village atmosphere |
| Santa Flavia | A charming town with historical sites and proximity to beautiful beaches. It's a great base for exploring nearby attractions and enjoying coastal activities. | Villa Filippina, Solunto Archaeological Site, local beaches, traditional Sicilian cuisine |
| Termini Imerese | This town boasts a rich history and several archaeological sites, attracting visitors who are interested in history and culture. A less touristy alternative to Cefalù. | Theater of Termini Imerese, Castello di Termini Imerese, Historic town center, Local markets |
| Palermo | The capital city of Sicily, known for its rich culture, historic architecture, and bustling markets. A vibrant city that attracts many tourists seeking urban adventures. | Palermo Cathedral, Teatro Massimo, Ballarò Market, Quattro Canti, Norman Palace |
| Ficuzza | Nestled in the Madonie mountains, this area offers natural beauty and the popular Royal Palace. Ideal for those seeking mountain activities and nature exploration. | Royal Palace of Ficuzza, Nature trails, Birdwatching, Beautiful panoramas |
Understanding Airbnb License Requirements & STR Laws in Lascari (2025)
Yes, Lascari, Sicily, Italy enforces high STR regulations. Obtaining a license and ensuring compliance is almost certainly required according to current 2025 STR laws. Always verify the latest short term rental regulations and Airbnb license requirements directly with local government authorities for Lascari to ensure full compliance before hosting.
(Source: AirROI data, 2025, based on 56% licensed listings)
Top Performing Airbnb Properties in Lascari (2025)
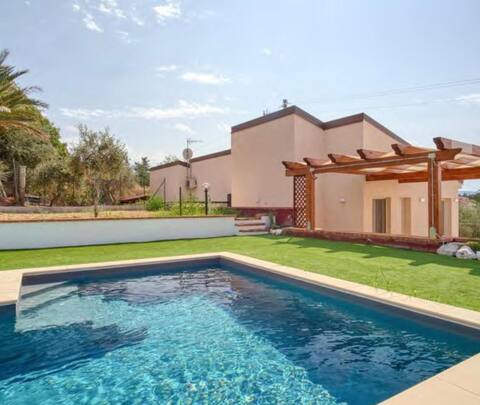
Benchmark your potential! Explore examples of top-performing Airbnb properties in Lascaribased on Trailing Twelve Month (TTM) revenue. Analyze their characteristics, revenue, occupancy rate, and ADR to understand what drives success in this market.
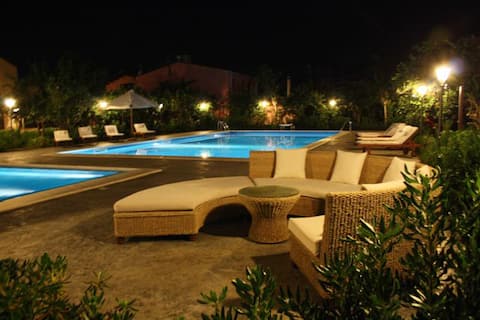
Ville dell'Eden sul mare with 26 beds
Entire Place • 9 bedrooms
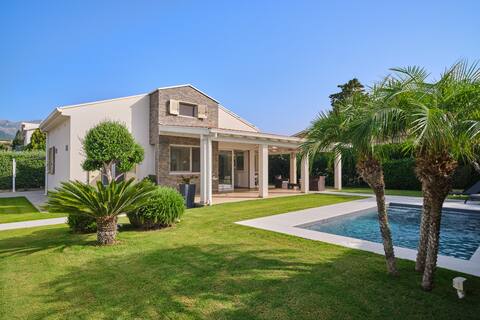
Villa with private pool by the sea | Cefalù
Entire Place • 4 bedrooms
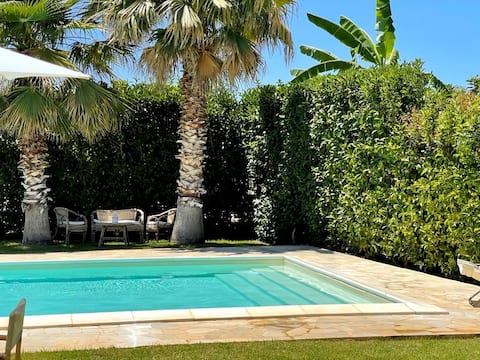
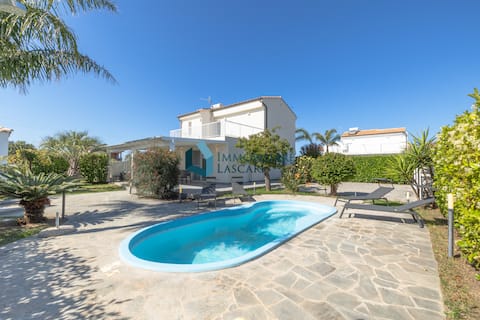
Villa Giardino Paradiso Cefalù, heated pool
Entire Place • 6 bedrooms
Villa Laura alle Salinelle
Entire Place • 3 bedrooms
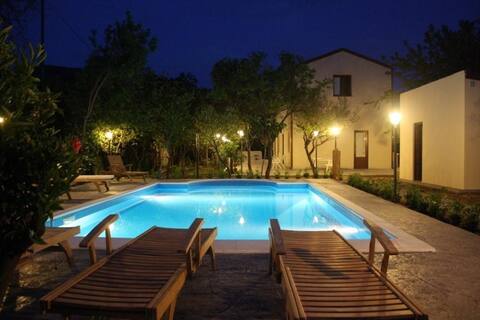
Solemar Sicilia - Villa Sicilia by the sea
Entire Place • 3 bedrooms
Villa Bianca 3 with private pool
Entire Place • 4 bedrooms
Note: Performance varies based on location, size, amenities, seasonality, and management quality. Data reflects the past 12 months.
Top Performing Airbnb Hosts in Lascari (2025)
Learn from the best! This table showcases top-performing Airbnb hosts in Lascari based on the number of properties managed and estimated total revenue over the past year. Analyze their scale and performance metrics.
| Host Name | Properties | Grossing Revenue | Stay Reviews | Avg Rating |
|---|---|---|---|---|
| Benedetto | 3 | $172,606 | 18 | 4.91/5.0 |
| Vincenzo | 11 | $145,275 | 186 | 3.00/5.0 |
| Ap Service Sas Di Polizzotto | 7 | $103,087 | 35 | 4.35/5.0 |
| Emanuele | 1 | $83,938 | 70 | 4.97/5.0 |
| Case Vacanze Le Zagare Srls | 5 | $81,377 | 158 | 4.66/5.0 |
| F.Lli Incao | 3 | $74,771 | 67 | 4.89/5.0 |
| Giovanna | 4 | $65,373 | 20 | 3.71/5.0 |
| Tiziana | 1 | $64,320 | 30 | 4.93/5.0 |
| Giuseppe | 1 | $62,221 | 49 | 4.86/5.0 |
| Dario | 2 | $57,738 | 91 | 4.94/5.0 |
Analyzing the strategies of top hosts, such as their property selection, pricing, and guest communication, can offer valuable lessons for optimizing your own Airbnb operations in Lascari.
Dive Deeper: Advanced Lascari STR Market Data (2025)
Ready to unlock more insights? AirROI provides access to advanced metrics and comprehensive Airbnb data for Lascari. Explore detailed analytics beyond this report to refine your investment strategy, optimize pricing, and maximize your vacation rental profits.
Explore Advanced MetricsLascari Short-Term Rental Market Composition (2025): Property & Room Types
Room Type Distribution
Property Type Distribution
Market Composition Insights for Lascari
- The Lascari Airbnb market composition is heavily skewed towards Entire Home/Apt listings, which make up 71.4% of the 84 active rentals. This indicates strong guest preference for privacy and space.
- Looking at the property type distribution in Lascari, House properties are the most common (50%), reflecting the local real estate landscape.
- Houses represent a significant 50% portion, catering likely to families or larger groups.
- The presence of 17.9% Hotel/Boutique listings indicates integration with traditional hospitality.
Lascari Airbnb Room Capacity Analysis (2025): Bedroom Distribution
Distribution of Listings by Number of Bedrooms
Room Capacity Insights for Lascari
- The dominant room capacity in Lascari is 1 bedroom listings, making up 36.9% of the market. This suggests a strong demand for properties suitable for couples or solo travelers.
- Together, 1 bedroom and 2 bedrooms properties represent 54.8% of the active Airbnb listings in Lascari, indicating a high concentration in these sizes.
- A significant 28.7% of listings offer 3+ bedrooms, catering to larger groups and families seeking more space in Lascari.
Lascari Vacation Rental Guest Capacity Trends (2025)
Distribution of Listings by Guest Capacity
Guest Capacity Insights for Lascari
- The most common guest capacity trend in Lascari vacation rentals is listings accommodating 6 guests (22.6%). This suggests the primary traveler segment is likely larger groups.
- Properties designed for 6 guests and 2 guests dominate the Lascari STR market, accounting for 39.3% of listings.
- 36.9% of properties accommodate 6+ guests, serving the market segment for larger families or group travel in Lascari.
- On average, properties in Lascari are equipped to host 4.0 guests.
Lascari Airbnb Booking Patterns (2025): Available vs. Booked Days
Available Days Distribution
Booked Days Distribution
Booking Pattern Insights for Lascari
- The most common availability pattern in Lascari falls within the 271-366 days range, representing 63.1% of listings. This suggests many properties have significant open periods on their calendars.
- Approximately 88.1% of listings show high availability (181+ days open annually), indicating potential for increased bookings or specific owner usage patterns.
- For booked days, the 31-90 days range is most frequent in Lascari (34.5%), reflecting common guest stay durations or potential owner blocking patterns.
- A notable 11.9% of properties secure long booking periods (181+ days booked per year), highlighting successful long-term rental strategies or significant owner usage.
Lascari Airbnb Minimum Stay Requirements Analysis
Distribution of Listings by Minimum Night Requirement
1 Night
30 listings
36.6% of total
2 Nights
11 listings
13.4% of total
3 Nights
13 listings
15.9% of total
4-6 Nights
10 listings
12.2% of total
7-29 Nights
16 listings
19.5% of total
30+ Nights
2 listings
2.4% of total
Key Insights
- The most prevalent minimum stay requirement in Lascari is 1 Night, adopted by 36.6% of listings. This highlights the market's preference for shorter, flexible bookings.
- Dedicated monthly rentals (30+ nights) represent a small niche (2.4%), possibly an untapped area for hosts.
Recommendations
- Align with the market by considering a 1 Night minimum stay, as 36.6% of Lascari hosts use this setting.
- Adjust minimum nights based on seasonality – potentially shorter during low season and longer during peak demand periods in Lascari.
Lascari Airbnb Cancellation Policy Trends Analysis (2025)
Super Strict 30 Days
1 listings
1.4% of total
Super Strict 60 Days
4 listings
5.8% of total
Flexible
10 listings
14.5% of total
Moderate
32 listings
46.4% of total
Strict
22 listings
31.9% of total
Cancellation Policy Insights for Lascari
- The prevailing Airbnb cancellation policy trend in Lascari is Moderate, used by 46.4% of listings.
- There's a relatively balanced mix between guest-friendly (60.9%) and stricter (31.9%) policies, offering choices for different guest needs.
Recommendations for Hosts
- Consider adopting a Moderate policy to align with the 46.4% market standard in Lascari.
- With 31.9% using Strict terms, this is a viable option in Lascari, particularly for high-value properties or during peak demand periods.
- Regularly review your cancellation policy against competitors and market demand shifts in Lascari.
Lascari STR Booking Lead Time Analysis (2025)
Average Booking Lead Time by Month
Booking Lead Time Insights for Lascari
- The overall average booking lead time for vacation rentals in Lascari is 68 days.
- Guests book furthest in advance for stays during September (average 99 days), likely coinciding with peak travel demand or local events.
- The shortest booking windows occur for stays in March (average 32 days), indicating more last-minute travel plans during this time.
- Seasonally, Summer (81 days avg.) sees the longest lead times, while Spring (53 days avg.) has the shortest, reflecting typical travel planning cycles.
Recommendations for Hosts
- Use the overall average lead time (68 days) as a baseline for your pricing and availability strategy in Lascari.
- For September stays, consider implementing length-of-stay discounts or slightly higher rates for bookings made less than 99 days out to capitalize on advance planning.
- Target marketing efforts for the Summer season well in advance (at least 81 days) to capture early planners.
- Monitor your own booking lead times against these Lascari averages to identify opportunities for dynamic pricing adjustments.
Popular & Essential Airbnb Amenities in Lascari (2025)
Amenity Prevalence
Amenity Insights for Lascari
- Popular amenities like Air conditioning, TV, Hot water are common but not universal. Offering these can provide a competitive edge.
- Warning: Wifi is not universally provided but is considered essential globally. Ensure reliable Wifi is offered.
Recommendations for Hosts
- Consider adding popular differentiators like Air conditioning or TV to increase appeal.
- Highlight unique or less common amenities you offer (e.g., hot tub, dedicated workspace, EV charger) in your listing description and photos.
- Regularly check competitor amenities in Lascari to stay competitive.
Lascari Airbnb Guest Demographics & Profile Analysis (2025)
Guest Profile Summary for Lascari
- The typical guest profile for Airbnb in Lascari consists of predominantly international visitors (93%), with top international origins including Germany, typically belonging to the Post-2000s (Gen Z/Alpha) group (50%), primarily speaking English or French.
- Domestic travelers account for 6.6% of guests.
- Key international markets include France (27%) and Germany (16%).
- Top languages spoken are English (38.1%) followed by French (17.9%).
- A significant demographic segment is the Post-2000s (Gen Z/Alpha) group, representing 50% of guests.
Recommendations for Hosts
- Focus marketing internationally, particularly towards travelers from Germany.
- Tailor amenities and listing descriptions to appeal to the dominant Post-2000s (Gen Z/Alpha) demographic (e.g., highlight fast WiFi, smart home features, local guides).
- Highlight unique local experiences or amenities relevant to the primary guest profile.
- Consider seasonal promotions aligned with peak travel times for key origin markets.
Nearby Short-Term Rental Market Comparison
How does the Lascari Airbnb market stack up against its neighbors? Compare key performance metrics like average monthly revenue, ADR, and occupancy rates in surrounding areas to understand the broader regional STR landscape.
| Market | Active Properties | Monthly Revenue | Daily Rate | Avg. Occupancy |
|---|---|---|---|---|
| Partinico | 112 | $2,077 | $283.49 | 39% |
| Santa Flavia | 189 | $1,866 | $165.16 | 47% |
| Cefalù | 1,003 | $1,764 | $182.13 | 48% |
| San Marco d'Alunzio | 13 | $1,726 | $174.71 | 38% |
| Collesano | 47 | $1,716 | $240.89 | 35% |
| Buseto Palizzolo | 31 | $1,683 | $218.18 | 38% |
| Caronia | 41 | $1,674 | $178.18 | 44% |
| Mistretta | 10 | $1,627 | $153.31 | 39% |
| Altavilla Milicia | 79 | $1,568 | $210.58 | 42% |
| Acquedolci | 28 | $1,512 | $195.95 | 40% |