Graniti Airbnb Market Analysis 2025: Short Term Rental Data & Vacation Rental Statistics in Sicily, Italy
Is Airbnb profitable in Graniti in 2025? Explore comprehensive Airbnb analytics for Graniti, Sicily, Italy to uncover income potential. This 2025 STR market report for Graniti, based on AirROI data from April 2024 to March 2025, reveals key trends in the niche market of 20 active listings.
Whether you're considering an Airbnb investment in Graniti, optimizing your existing vacation rental, or exploring rental arbitrage opportunities, understanding the Graniti Airbnb data is crucial. Navigating the high regulation landscape is key to maximizing your short term rental income potential. Let's dive into the specifics.
Key Graniti Airbnb Performance Metrics Overview
Monthly Airbnb Revenue Variations & Income Potential in Graniti (2025)
Understanding the monthly revenue variations for Airbnb listings in Graniti is key to maximizing your short term rental income potential. Seasonality significantly impacts earnings. Our analysis, based on data from the past 12 months, shows that the peak revenue month for STRs in Graniti is typically August, while February often presents the lowest earnings, highlighting opportunities for strategic pricing adjustments during shoulder and low seasons. Explore the typical Airbnb income in Graniti across different performance tiers:
- Best-in-class properties (Top 10%) achieve $7,444+ monthly, often utilizing dynamic pricing and superior guest experiences.
- Strong performing properties (Top 25%) earn $3,680 or more, indicating effective management and desirable locations/amenities.
- Typical properties (Median) generate around $1,511 per month, representing the average market performance.
- Entry-level properties (Bottom 25%) see earnings around $701, often with potential for optimization.
Average Monthly Airbnb Earnings Trend in Graniti
Graniti Airbnb Occupancy Rate Trends (2025)
Maximize your bookings by understanding the Graniti STR occupancy trends. Seasonal demand shifts significantly influence how often properties are booked. Typically, Augustsees the highest demand (peak season occupancy), while March experiences the lowest (low season). Effective strategies, like adjusting minimum stays or offering promotions, can boost occupancy during slower periods. Here's how different property tiers perform in Graniti:
- Best-in-class properties (Top 10%) achieve 78%+ occupancy, indicating high desirability and potentially optimized availability.
- Strong performing properties (Top 25%) maintain 63% or higher occupancy, suggesting good market fit and guest satisfaction.
- Typical properties (Median) have an occupancy rate around 38%.
- Entry-level properties (Bottom 25%) average 22% occupancy, potentially facing higher vacancy.
Average Monthly Occupancy Rate Trend in Graniti
Average Daily Rate (ADR) Airbnb Trends in Graniti (2025)
Effective short term rental pricing strategy in Graniti involves understanding monthly ADR fluctuations. The Average Daily Rate (ADR) for Airbnb in Graniti typically peaks in August and dips lowest during April. Leveraging Airbnb dynamic pricing tools or strategies based on this seasonality can significantly boost revenue. Here's a look at the typical nightly rates achieved:
- Best-in-class properties (Top 10%) command rates of $310+ per night, often due to premium features or locations.
- Strong performing properties (Top 25%) achieve nightly rates of $199 or more.
- Typical properties (Median) charge around $70 per night.
- Entry-level properties (Bottom 25%) earn around $56 per night.
Average Daily Rate (ADR) Trend by Month in Graniti
Get Live Graniti Market Intelligence 👇
Explore Real-time Analytics
Airbnb Seasonality Analysis & Trends in Graniti (2025)
Peak Season (August, July, October)
- Revenue averages $4,493 per month
- Occupancy rates average 63.5%
- Daily rates average $145
Shoulder Season
- Revenue averages $3,018 per month
- Occupancy maintains around 43.9%
- Daily rates hold near $134
Low Season (January, February, March)
- Revenue drops to average $450 per month
- Occupancy decreases to average 22.6%
- Daily rates adjust to average $144
Seasonality Insights for Graniti
- The Airbnb seasonality in Graniti shows highly seasonal trends requiring careful strategy. While the sections above show seasonal averages, it's also insightful to look at the extremes:
- During the high season, the absolute peak month showcases Graniti's highest earning potential, with monthly revenues capable of climbing to $5,252, occupancy reaching a high of 69.2%, and ADRs peaking at $166.
- Conversely, the slowest single month of the year, typically falling within the low season, marks the market's lowest point. In this month, revenue might dip to $255, occupancy could drop to 17.9%, and ADRs may adjust down to $118.
- Understanding both the seasonal averages and these monthly peaks and troughs in revenue, occupancy, and ADR is crucial for maximizing your Airbnb profit potential in Graniti.
Seasonal Strategies for Maximizing Profit
- Peak Season: Maximize revenue through premium pricing and potentially longer minimum stays. Ensure high availability.
- Low Season: Offer competitive pricing, special promotions (e.g., extended stay discounts), and flexible cancellation policies. Target off-season travelers like remote workers or budget-conscious guests.
- Shoulder Seasons: Implement dynamic pricing that balances peak and low rates. Target weekend travelers or specific events. Offer slightly more flexible terms than peak season.
- Regularly analyze your own performance against these Graniti seasonality benchmarks and adjust your pricing and availability strategy accordingly.
Best Areas for Airbnb Investment in Graniti (2025)
Exploring the top neighborhoods for short-term rentals in Graniti? This section highlights key areas, outlining why they are attractive for hosts and guests, along with notable local attractions. Consider these locations based on your target guest profile and investment strategy.
| Neighborhood / Area | Why Host Here? (Target Guests & Appeal) | Key Attractions & Landmarks |
|---|---|---|
| Graniti Town Center | Charming central area with easy access to local shops and restaurants. It's a great spot for visitors who want to experience authentic Sicilian culture in a quaint town setting. | Graniti's main square, Local markets, Church of San Giovanni Battista |
| Etna National Park | Stunning natural park known for its volcano and outdoor activities. Attracts adventure seekers and nature lovers looking to hike and explore the unique landscape. | Mount Etna, Hiking trails, Botanical gardens, Wine tasting tours |
| Taormina | A famous tourist destination known for its ancient theater and beautiful beaches. A perfect place for high-end travelers seeking luxury and spectacular views. | Greek Theatre, Isola Bella, Corso Umberto, Villa Comunale, Public Gardens |
| Castelmola | Picturesque hilltop village with stunning views of Taormina and the coast. It's a quieter area that attracts visitors looking for a relaxing getaway. | Castelmola Castle, Piazza Sant'Antonio, Local wineries, Viewpoints |
| Naxos Beach | Popular beach area with resorts and vibrant nightlife. Ideal for visitors wanting beach access and entertainment. | Giardini Naxos Beach, Water sports, Restaurants and bars, Nightlife |
| Savoca | Beautiful medieval village that is known for its role in The Godfather films. It attracts tourists interested in film history and charming scenery. | Bar Vitelli, Savoca's historical sites, St. Lucia Church, Scenic views |
| Fiumefreddo | Gateway to the Alcantara Gorges and a more low-key beach experience. Perfect for those looking for a quieter vacation while still being near exciting attractions. | Alcantara Gorges, Local beaches, Nature trails |
| Forza d'Agrò | Another quaint village steeped in history, offering panoramic views and a peaceful atmosphere. Ideal for those seeking tranquility and scenic landscapes. | Norman Castle, Church of San Domenico, Historic center |
Understanding Airbnb License Requirements & STR Laws in Graniti (2025)
Yes, Graniti, Sicily, Italy enforces high STR regulations. Obtaining a license and ensuring compliance is almost certainly required according to current 2025 STR laws. Always verify the latest short term rental regulations and Airbnb license requirements directly with local government authorities for Graniti to ensure full compliance before hosting.
(Source: AirROI data, 2025, based on 60% licensed listings)
Top Performing Airbnb Properties in Graniti (2025)
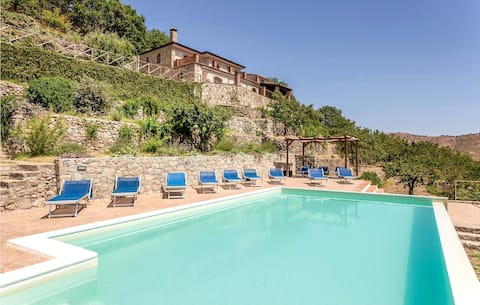
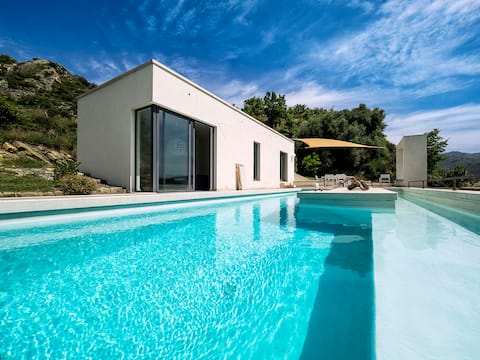
Benchmark your potential! Explore examples of top-performing Airbnb properties in Granitibased on Trailing Twelve Month (TTM) revenue. Analyze their characteristics, revenue, occupancy rate, and ADR to understand what drives success in this market.
Marianna
Entire Place • 5 bedrooms
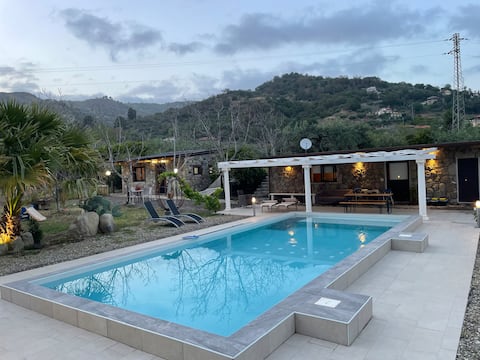
Villa with pool in perfect natural setting
Entire Place • 3 bedrooms
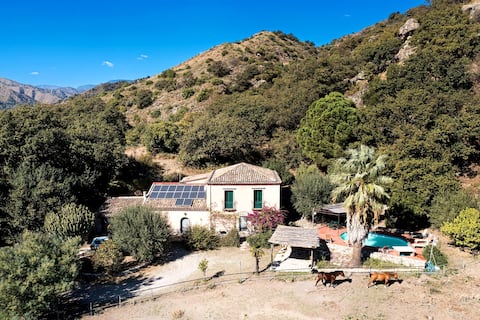
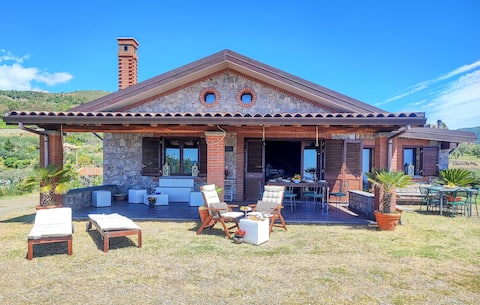
Sicilian country house with panoramic views
Entire Place • 4 bedrooms
Sicily Stone Cottage
Entire Place • 2 bedrooms
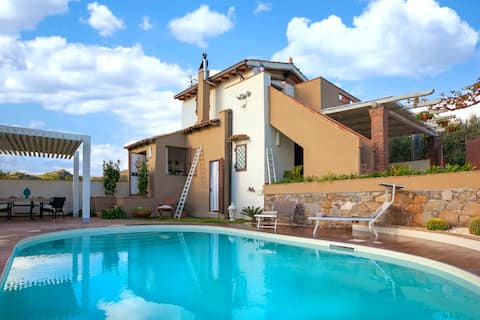
Villa Alcantara of Charme- Villa near Taormina
Entire Place • 2 bedrooms
Villa Aura
Entire Place • 3 bedrooms
Note: Performance varies based on location, size, amenities, seasonality, and management quality. Data reflects the past 12 months.
Top Performing Airbnb Hosts in Graniti (2025)
Learn from the best! This table showcases top-performing Airbnb hosts in Graniti based on the number of properties managed and estimated total revenue over the past year. Analyze their scale and performance metrics.
| Host Name | Properties | Grossing Revenue | Stay Reviews | Avg Rating |
|---|---|---|---|---|
| Giulia | 3 | $173,621 | 110 | 4.70/5.0 |
| Novasol | 1 | $129,839 | 28 | 4.68/5.0 |
| Host #324860521 | 1 | $36,033 | 34 | 4.97/5.0 |
| Yosef | 3 | $34,122 | 50 | 4.76/5.0 |
| Vanessa | 1 | $31,568 | 7 | 5.00/5.0 |
| Isidoro | 4 | $31,486 | 292 | 4.74/5.0 |
| Novasol | 1 | $31,172 | 4 | 5.00/5.0 |
| Laura | 1 | $17,434 | 130 | 4.81/5.0 |
| Miriam | 1 | $11,958 | 65 | 4.88/5.0 |
| Francesco | 1 | $8,692 | 33 | 4.94/5.0 |
Analyzing the strategies of top hosts, such as their property selection, pricing, and guest communication, can offer valuable lessons for optimizing your own Airbnb operations in Graniti.
Dive Deeper: Advanced Graniti STR Market Data (2025)
Ready to unlock more insights? AirROI provides access to advanced metrics and comprehensive Airbnb data for Graniti. Explore detailed analytics beyond this report to refine your investment strategy, optimize pricing, and maximize your vacation rental profits.
Explore Advanced MetricsGraniti Short-Term Rental Market Composition (2025): Property & Room Types
Room Type Distribution
Property Type Distribution
Market Composition Insights for Graniti
- The Graniti Airbnb market composition is heavily skewed towards Entire Home/Apt listings, which make up 95% of the 20 active rentals. This indicates strong guest preference for privacy and space.
- Looking at the property type distribution in Graniti, House properties are the most common (75%), reflecting the local real estate landscape.
- Houses represent a significant 75% portion, catering likely to families or larger groups.
Graniti Airbnb Room Capacity Analysis (2025): Bedroom Distribution
Distribution of Listings by Number of Bedrooms
Room Capacity Insights for Graniti
- The dominant room capacity in Graniti is 2 bedrooms listings, making up 35% of the market. This suggests a strong demand for properties suitable for couples or solo travelers.
- Together, 2 bedrooms and 1 bedroom properties represent 65.0% of the active Airbnb listings in Graniti, indicating a high concentration in these sizes.
- A significant 35.0% of listings offer 3+ bedrooms, catering to larger groups and families seeking more space in Graniti.
Graniti Vacation Rental Guest Capacity Trends (2025)
Distribution of Listings by Guest Capacity
Guest Capacity Insights for Graniti
- The most common guest capacity trend in Graniti vacation rentals is listings accommodating 8+ guests (25%). This suggests the primary traveler segment is likely larger groups.
- Properties designed for 8+ guests and 4 guests dominate the Graniti STR market, accounting for 45.0% of listings.
- 45.0% of properties accommodate 6+ guests, serving the market segment for larger families or group travel in Graniti.
- On average, properties in Graniti are equipped to host 5.3 guests.
Graniti Airbnb Booking Patterns (2025): Available vs. Booked Days
Available Days Distribution
Booked Days Distribution
Booking Pattern Insights for Graniti
- The most common availability pattern in Graniti falls within the 271-366 days range, representing 45% of listings. This suggests many properties have significant open periods on their calendars.
- Approximately 70.0% of listings show high availability (181+ days open annually), indicating potential for increased bookings or specific owner usage patterns.
- For booked days, the 181-270 days range is most frequent in Graniti (35%), reflecting common guest stay durations or potential owner blocking patterns.
- A notable 35.0% of properties secure long booking periods (181+ days booked per year), highlighting successful long-term rental strategies or significant owner usage.
Graniti Airbnb Minimum Stay Requirements Analysis
Distribution of Listings by Minimum Night Requirement
1 Night
6 listings
31.6% of total
2 Nights
2 listings
10.5% of total
3 Nights
3 listings
15.8% of total
4-6 Nights
7 listings
36.8% of total
7-29 Nights
1 listings
5.3% of total
Key Insights
- The most prevalent minimum stay requirement in Graniti is 4-6 Nights, adopted by 36.8% of listings. This highlights the market's preference for longer commitments.
Recommendations
- Align with the market by considering a 4-6 Nights minimum stay, as 36.8% of Graniti hosts use this setting.
- Adjust minimum nights based on seasonality – potentially shorter during low season and longer during peak demand periods in Graniti.
Graniti Airbnb Cancellation Policy Trends Analysis (2025)
Super Strict 60 Days
5 listings
29.4% of total
Flexible
6 listings
35.3% of total
Moderate
5 listings
29.4% of total
Strict
1 listings
5.9% of total
Cancellation Policy Insights for Graniti
- The prevailing Airbnb cancellation policy trend in Graniti is Flexible, used by 35.3% of listings.
- There's a relatively balanced mix between guest-friendly (64.7%) and stricter (5.9%) policies, offering choices for different guest needs.
- Strict cancellation policies are quite rare (5.9%), potentially making listings with this policy less competitive unless justified by high demand or property type.
Recommendations for Hosts
- Consider adopting a Flexible policy to align with the 35.3% market standard in Graniti.
- Using a Strict policy might deter some guests, as only 5.9% of listings use it. Evaluate if potential revenue protection outweighs possible lower booking rates.
- Regularly review your cancellation policy against competitors and market demand shifts in Graniti.
Graniti STR Booking Lead Time Analysis (2025)
Average Booking Lead Time by Month
Booking Lead Time Insights for Graniti
- The overall average booking lead time for vacation rentals in Graniti is 58 days.
- Guests book furthest in advance for stays during July (average 98 days), likely coinciding with peak travel demand or local events.
- The shortest booking windows occur for stays in March (average 34 days), indicating more last-minute travel plans during this time.
- Seasonally, Summer (83 days avg.) sees the longest lead times, while Winter (46 days avg.) has the shortest, reflecting typical travel planning cycles.
Recommendations for Hosts
- Use the overall average lead time (58 days) as a baseline for your pricing and availability strategy in Graniti.
- For July stays, consider implementing length-of-stay discounts or slightly higher rates for bookings made less than 98 days out to capitalize on advance planning.
- Target marketing efforts for the Summer season well in advance (at least 83 days) to capture early planners.
- Monitor your own booking lead times against these Graniti averages to identify opportunities for dynamic pricing adjustments.
Popular & Essential Airbnb Amenities in Graniti (2025)
Amenity Prevalence
Amenity Insights for Graniti
- Essential amenities in Graniti that guests expect include: Air conditioning. Lacking these (this) could significantly impact bookings.
- Popular amenities like Refrigerator, Hair dryer, Coffee maker are common but not universal. Offering these can provide a competitive edge.
- Warning: Wifi is not universally provided but is considered essential globally. Ensure reliable Wifi is offered.
Recommendations for Hosts
- Ensure your listing includes all essential amenities for Graniti: Air conditioning.
- Consider adding popular differentiators like Refrigerator or Hair dryer to increase appeal.
- Highlight unique or less common amenities you offer (e.g., hot tub, dedicated workspace, EV charger) in your listing description and photos.
- Regularly check competitor amenities in Graniti to stay competitive.
Graniti Airbnb Guest Demographics & Profile Analysis (2025)
Guest Profile Summary for Graniti
- The typical guest profile for Airbnb in Graniti consists of predominantly international visitors (88%), with top international origins including Italy, typically belonging to the Post-2000s (Gen Z/Alpha) group (50%), primarily speaking English or French.
- Domestic travelers account for 11.7% of guests.
- Key international markets include France (30.4%) and Italy (11.7%).
- Top languages spoken are English (37.1%) followed by French (21.8%).
- A significant demographic segment is the Post-2000s (Gen Z/Alpha) group, representing 50% of guests.
Recommendations for Hosts
- Focus marketing internationally, particularly towards travelers from Italy.
- Tailor amenities and listing descriptions to appeal to the dominant Post-2000s (Gen Z/Alpha) demographic (e.g., highlight fast WiFi, smart home features, local guides).
- Highlight unique local experiences or amenities relevant to the primary guest profile.
- Consider seasonal promotions aligned with peak travel times for key origin markets.
Nearby Short-Term Rental Market Comparison
How does the Graniti Airbnb market stack up against its neighbors? Compare key performance metrics like average monthly revenue, ADR, and occupancy rates in surrounding areas to understand the broader regional STR landscape.
| Market | Active Properties | Monthly Revenue | Daily Rate | Avg. Occupancy |
|---|---|---|---|---|
| Taormina | 973 | $2,450 | $221.38 | 47% |
| Għasri | 56 | $2,339 | $216.90 | 40% |
| Torregrotta | 16 | $2,105 | $267.72 | 36% |
| Viagrande | 34 | $1,921 | $196.41 | 38% |
| Gaggi | 16 | $1,892 | $190.10 | 40% |
| Santa Venerina | 53 | $1,872 | $219.97 | 41% |
| Xewkija | 36 | $1,766 | $167.34 | 43% |
| Cefalù | 1,003 | $1,764 | $182.13 | 48% |
| San Marco d'Alunzio | 13 | $1,726 | $174.71 | 38% |
| Tropea | 10 | $1,702 | $157.29 | 49% |