Favara Airbnb Market Analysis 2025: Short Term Rental Data & Vacation Rental Statistics in Sicily, Italy
Is Airbnb profitable in Favara in 2025? Explore comprehensive Airbnb analytics for Favara, Sicily, Italy to uncover income potential. This 2025 STR market report for Favara, based on AirROI data from April 2024 to March 2025, reveals key trends in the niche market of 49 active listings.
Whether you're considering an Airbnb investment in Favara, optimizing your existing vacation rental, or exploring rental arbitrage opportunities, understanding the Favara Airbnb data is crucial. Understanding the local regulations is key to maximizing your short term rental income potential. Let's dive into the specifics.
Key Favara Airbnb Performance Metrics Overview
Monthly Airbnb Revenue Variations & Income Potential in Favara (2025)
Understanding the monthly revenue variations for Airbnb listings in Favara is key to maximizing your short term rental income potential. Seasonality significantly impacts earnings. Our analysis, based on data from the past 12 months, shows that the peak revenue month for STRs in Favara is typically August, while February often presents the lowest earnings, highlighting opportunities for strategic pricing adjustments during shoulder and low seasons. Explore the typical Airbnb income in Favara across different performance tiers:
- Best-in-class properties (Top 10%) achieve $2,350+ monthly, often utilizing dynamic pricing and superior guest experiences.
- Strong performing properties (Top 25%) earn $1,090 or more, indicating effective management and desirable locations/amenities.
- Typical properties (Median) generate around $593 per month, representing the average market performance.
- Entry-level properties (Bottom 25%) see earnings around $240, often with potential for optimization.
Average Monthly Airbnb Earnings Trend in Favara
Favara Airbnb Occupancy Rate Trends (2025)
Maximize your bookings by understanding the Favara STR occupancy trends. Seasonal demand shifts significantly influence how often properties are booked. Typically, Julysees the highest demand (peak season occupancy), while January experiences the lowest (low season). Effective strategies, like adjusting minimum stays or offering promotions, can boost occupancy during slower periods. Here's how different property tiers perform in Favara:
- Best-in-class properties (Top 10%) achieve 47%+ occupancy, indicating high desirability and potentially optimized availability.
- Strong performing properties (Top 25%) maintain 32% or higher occupancy, suggesting good market fit and guest satisfaction.
- Typical properties (Median) have an occupancy rate around 17%.
- Entry-level properties (Bottom 25%) average 8% occupancy, potentially facing higher vacancy.
Average Monthly Occupancy Rate Trend in Favara
Average Daily Rate (ADR) Airbnb Trends in Favara (2025)
Effective short term rental pricing strategy in Favara involves understanding monthly ADR fluctuations. The Average Daily Rate (ADR) for Airbnb in Favara typically peaks in January and dips lowest during October. Leveraging Airbnb dynamic pricing tools or strategies based on this seasonality can significantly boost revenue. Here's a look at the typical nightly rates achieved:
- Best-in-class properties (Top 10%) command rates of $206+ per night, often due to premium features or locations.
- Strong performing properties (Top 25%) achieve nightly rates of $129 or more.
- Typical properties (Median) charge around $81 per night.
- Entry-level properties (Bottom 25%) earn around $61 per night.
Average Daily Rate (ADR) Trend by Month in Favara
Get Live Favara Market Intelligence 👇

Explore Real-time Analytics
Airbnb Seasonality Analysis & Trends in Favara (2025)
Peak Season (August, July, June)
- Revenue averages $1,892 per month
- Occupancy rates average 37.8%
- Daily rates average $108
Shoulder Season
- Revenue averages $821 per month
- Occupancy maintains around 20.9%
- Daily rates hold near $104
Low Season (January, February, December)
- Revenue drops to average $342 per month
- Occupancy decreases to average 11.7%
- Daily rates adjust to average $126
Seasonality Insights for Favara
- The Airbnb seasonality in Favara shows highly seasonal trends requiring careful strategy. While the sections above show seasonal averages, it's also insightful to look at the extremes:
- During the high season, the absolute peak month showcases Favara's highest earning potential, with monthly revenues capable of climbing to $1,945, occupancy reaching a high of 40.1%, and ADRs peaking at $155.
- Conversely, the slowest single month of the year, typically falling within the low season, marks the market's lowest point. In this month, revenue might dip to $262, occupancy could drop to 9.5%, and ADRs may adjust down to $99.
- Understanding both the seasonal averages and these monthly peaks and troughs in revenue, occupancy, and ADR is crucial for maximizing your Airbnb profit potential in Favara.
Seasonal Strategies for Maximizing Profit
- Peak Season: Maximize revenue through premium pricing and potentially longer minimum stays. Ensure high availability.
- Low Season: Offer competitive pricing, special promotions (e.g., extended stay discounts), and flexible cancellation policies. Target off-season travelers like remote workers or budget-conscious guests.
- Shoulder Seasons: Implement dynamic pricing that balances peak and low rates. Target weekend travelers or specific events. Offer slightly more flexible terms than peak season.
- Regularly analyze your own performance against these Favara seasonality benchmarks and adjust your pricing and availability strategy accordingly.
Best Areas for Airbnb Investment in Favara (2025)
Exploring the top neighborhoods for short-term rentals in Favara? This section highlights key areas, outlining why they are attractive for hosts and guests, along with notable local attractions. Consider these locations based on your target guest profile and investment strategy.
| Neighborhood / Area | Why Host Here? (Target Guests & Appeal) | Key Attractions & Landmarks |
|---|---|---|
| Historic Centre | Favara's Historic Centre is renowned for its beautiful architecture, historical sites, and charming streets. It's a prime spot for tourists interested in authentic Sicilian culture and history. | Church of San Francesco di Paula, Castle of Favara, Museo della Buffalo, Historic Squares, Local Artisan Shops |
| Farm Cultural Park | This contemporary art venue and cultural hub attracts many visitors, especially art enthusiasts and families. It's a vibrant area filled with unique installations and workshops. | Art Exhibitions, Workshops, Cafés, Events and Festivals, Street Art |
| Pozzo di Mazza | A quiet neighborhood with beautiful views of the surrounding countryside. It’s great for visitors looking for a peaceful retreat close to nature. | Nature Trails, Local Farms, Rural Landscapes |
| Viale della Libertà | This main avenue is lined with shops, restaurants, and cafés, making it perfect for tourists who want to experience local life and cuisine. | Shopping District, Restaurants, Cafés, Local Markets |
| Agrigento Beach | Nearby beaches attract visitors looking for sun and relaxation. Favara's proximity to the coast makes it an ideal base for beachgoers. | Beaches, Water Sports, Beach Bars, Scenic Views |
| Valley of the Temples | A UNESCO World Heritage site located just a short drive away, this archaeological site is a must-visit for anyone staying in Favara. | Ancient Greek Temples, Archaeological Museum, Guided Tours, Scenic Walks |
| Local Vineyards | Favara is surrounded by vineyards, offering guests the chance to partake in wine tasting and learn about Sicilian viticulture. | Wine Tours, Vineyard Tastings, Countryside Views |
| Cultural Events | Favara hosts various cultural events throughout the year, attracting visitors interested in local traditions and festivals. | Local Festivals, Art Exhibitions, Food Markets, Music Events |
Understanding Airbnb License Requirements & STR Laws in Favara (2025)
With 22% of listings showing registration in 2025, understanding potential Airbnb license requirements is crucial in Favara. Always verify the latest short term rental regulations and Airbnb license requirements directly with local government authorities for Favara to ensure full compliance before hosting.
(Source: AirROI data, 2025, based on 22% licensed listings)
Top Performing Airbnb Properties in Favara (2025)
Benchmark your potential! Explore examples of top-performing Airbnb properties in Favarabased on Trailing Twelve Month (TTM) revenue. Analyze their characteristics, revenue, occupancy rate, and ADR to understand what drives success in this market.
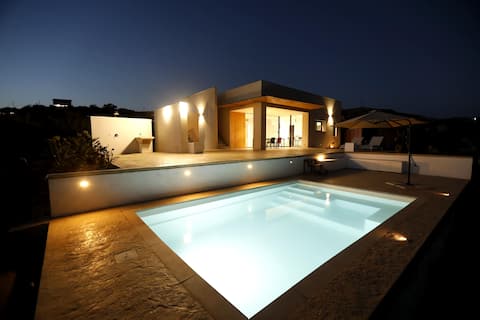
Contemporary Retreat
Entire Place • 3 bedrooms
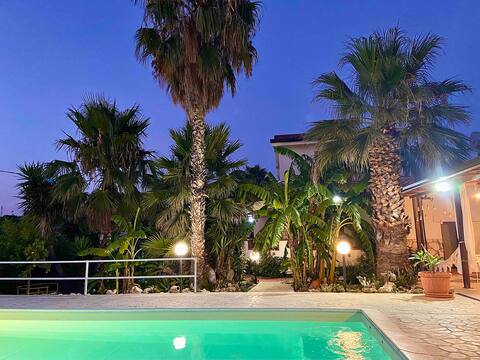
Casa Vacanze Favara (Agrigento)
Entire Place • 3 bedrooms
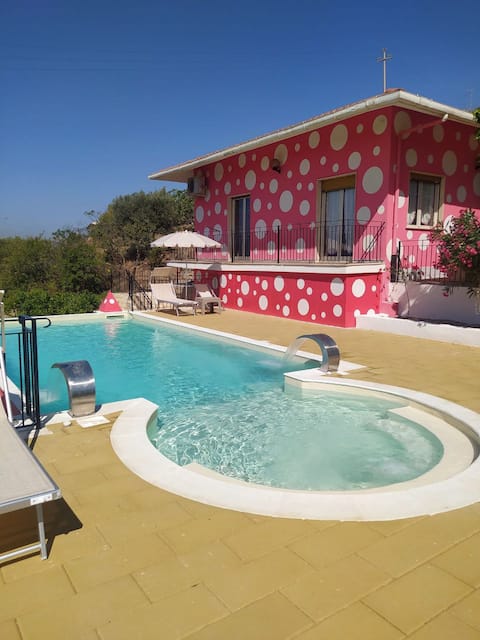
B&B Vento di Scirocco - Entire Villa
Entire Place �• 4 bedrooms

Villa Dell 'Aria !!! NATURE - ART - SEA
Entire Place • 3 bedrooms
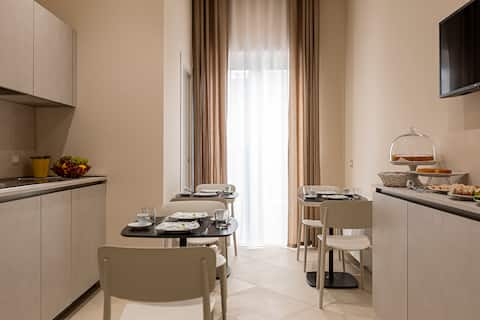
Palazzo Albergamo
Entire Place • 3 bedrooms
Villa Paola - pool surrounded by greenery
Entire Place • 4 bedrooms
Note: Performance varies based on location, size, amenities, seasonality, and management quality. Data reflects the past 12 months.
Top Performing Airbnb Hosts in Favara (2025)
Learn from the best! This table showcases top-performing Airbnb hosts in Favara based on the number of properties managed and estimated total revenue over the past year. Analyze their scale and performance metrics.
| Host Name | Properties | Grossing Revenue | Stay Reviews | Avg Rating |
|---|---|---|---|---|
| Giuseppe | 1 | $53,346 | 11 | 5.00/5.0 |
| Giuseppe | 2 | $42,418 | 81 | 4.76/5.0 |
| Host #32340603 | 1 | $42,287 | 59 | 4.85/5.0 |
| Tania | 4 | $37,377 | 14 | 5.00/5.0 |
| Stefano | 4 | $33,533 | 4 | 1.25/5.0 |
| Antonio | 1 | $29,578 | 39 | 4.95/5.0 |
| Silvia Dominique | 4 | $24,978 | 24 | 3.52/5.0 |
| Gaetano | 4 | $20,249 | 42 | 4.70/5.0 |
| Manuela | 1 | $17,288 | 39 | 4.77/5.0 |
| Giuseppe | 2 | $17,116 | 49 | 4.75/5.0 |
Analyzing the strategies of top hosts, such as their property selection, pricing, and guest communication, can offer valuable lessons for optimizing your own Airbnb operations in Favara.
Dive Deeper: Advanced Favara STR Market Data (2025)
Ready to unlock more insights? AirROI provides access to advanced metrics and comprehensive Airbnb data for Favara. Explore detailed analytics beyond this report to refine your investment strategy, optimize pricing, and maximize your vacation rental profits.
Explore Advanced MetricsFavara Short-Term Rental Market Composition (2025): Property & Room Types
Room Type Distribution
Property Type Distribution
Market Composition Insights for Favara
- The Favara Airbnb market composition is heavily skewed towards Private Room listings, which make up 57.1% of the 49 active rentals. This indicates strong guest preference for privacy and space.
- Looking at the property type distribution in Favara, House properties are the most common (46.9%), reflecting the local real estate landscape.
- Houses represent a significant 46.9% portion, catering likely to families or larger groups.
- The presence of 26.5% Hotel/Boutique listings indicates integration with traditional hospitality.
Favara Airbnb Room Capacity Analysis (2025): Bedroom Distribution
Distribution of Listings by Number of Bedrooms
Room Capacity Insights for Favara
- The dominant room capacity in Favara is 1 bedroom listings, making up 42.9% of the market. This suggests a strong demand for properties suitable for couples or solo travelers.
- Together, 1 bedroom and 2 bedrooms properties represent 59.2% of the active Airbnb listings in Favara, indicating a high concentration in these sizes.
- A significant 20.4% of listings offer 3+ bedrooms, catering to larger groups and families seeking more space in Favara.
Favara Vacation Rental Guest Capacity Trends (2025)
Distribution of Listings by Guest Capacity
Guest Capacity Insights for Favara
- The most common guest capacity trend in Favara vacation rentals is listings accommodating 2 guests (28.6%). This suggests the primary traveler segment is likely couples or solo travelers.
- Properties designed for 2 guests and 8+ guests dominate the Favara STR market, accounting for 42.9% of listings.
- 24.5% of properties accommodate 6+ guests, serving the market segment for larger families or group travel in Favara.
- On average, properties in Favara are equipped to host 3.3 guests.
Favara Airbnb Booking Patterns (2025): Available vs. Booked Days
Available Days Distribution
Booked Days Distribution
Booking Pattern Insights for Favara
- The most common availability pattern in Favara falls within the 271-366 days range, representing 75.5% of listings. This suggests many properties have significant open periods on their calendars.
- Approximately 100.0% of listings show high availability (181+ days open annually), indicating potential for increased bookings or specific owner usage patterns.
- For booked days, the 31-90 days range is most frequent in Favara (46.9%), reflecting common guest stay durations or potential owner blocking patterns.
Favara Airbnb Minimum Stay Requirements Analysis
Distribution of Listings by Minimum Night Requirement
1 Night
20 listings
41.7% of total
2 Nights
4 listings
8.3% of total
3 Nights
4 listings
8.3% of total
4-6 Nights
1 listings
2.1% of total
7-29 Nights
19 listings
39.6% of total
Key Insights
- The most prevalent minimum stay requirement in Favara is 1 Night, adopted by 41.7% of listings. This highlights the market's preference for shorter, flexible bookings.
Recommendations
- Align with the market by considering a 1 Night minimum stay, as 41.7% of Favara hosts use this setting.
- Adjust minimum nights based on seasonality – potentially shorter during low season and longer during peak demand periods in Favara.
Favara Airbnb Cancellation Policy Trends Analysis (2025)
Flexible
20 listings
51.3% of total
Moderate
16 listings
41% of total
Strict
3 listings
7.7% of total
Cancellation Policy Insights for Favara
- The prevailing Airbnb cancellation policy trend in Favara is Flexible, used by 51.3% of listings.
- The market strongly favors guest-friendly terms, with 92.3% of listings offering Flexible or Moderate policies. This suggests guests in Favara may expect booking flexibility.
- Strict cancellation policies are quite rare (7.7%), potentially making listings with this policy less competitive unless justified by high demand or property type.
Recommendations for Hosts
- Consider adopting a Flexible policy to align with the 51.3% market standard in Favara.
- Given the high prevalence of Flexible policies (51.3%), offering this can enhance booking appeal, especially during shoulder seasons.
- Using a Strict policy might deter some guests, as only 7.7% of listings use it. Evaluate if potential revenue protection outweighs possible lower booking rates.
- Regularly review your cancellation policy against competitors and market demand shifts in Favara.
Favara STR Booking Lead Time Analysis (2025)
Average Booking Lead Time by Month
Booking Lead Time Insights for Favara
- The overall average booking lead time for vacation rentals in Favara is 44 days.
- Guests book furthest in advance for stays during May (average 82 days), likely coinciding with peak travel demand or local events.
- The shortest booking windows occur for stays in December (average 33 days), indicating more last-minute travel plans during this time.
- Seasonally, Summer (68 days avg.) sees the longest lead times, while Winter (36 days avg.) has the shortest, reflecting typical travel planning cycles.
Recommendations for Hosts
- Use the overall average lead time (44 days) as a baseline for your pricing and availability strategy in Favara.
- For May stays, consider implementing length-of-stay discounts or slightly higher rates for bookings made less than 82 days out to capitalize on advance planning.
- Target marketing efforts for the Summer season well in advance (at least 68 days) to capture early planners.
- Monitor your own booking lead times against these Favara averages to identify opportunities for dynamic pricing adjustments.
Popular & Essential Airbnb Amenities in Favara (2025)
Amenity Prevalence
Amenity Insights for Favara
- Essential amenities in Favara that guests expect include: Air conditioning, Wifi. Lacking these (any) could significantly impact bookings.
- Popular amenities like TV, Essentials, Heating are common but not universal. Offering these can provide a competitive edge.
Recommendations for Hosts
- Ensure your listing includes all essential amenities for Favara: Air conditioning, Wifi.
- Prioritize adding missing essentials: Wifi.
- Consider adding popular differentiators like TV or Essentials to increase appeal.
- Highlight unique or less common amenities you offer (e.g., hot tub, dedicated workspace, EV charger) in your listing description and photos.
- Regularly check competitor amenities in Favara to stay competitive.
Favara Airbnb Guest Demographics & Profile Analysis (2025)
Guest Profile Summary for Favara
- The typical guest profile for Airbnb in Favara consists of predominantly international visitors (78%), with top international origins including Italy, typically belonging to the Post-2000s (Gen Z/Alpha) group (50%), primarily speaking English or French.
- Domestic travelers account for 22.1% of guests.
- Key international markets include France (24.6%) and Italy (22.1%).
- Top languages spoken are English (37.3%) followed by French (16.9%).
- A significant demographic segment is the Post-2000s (Gen Z/Alpha) group, representing 50% of guests.
Recommendations for Hosts
- Focus marketing internationally, particularly towards travelers from Italy.
- Tailor amenities and listing descriptions to appeal to the dominant Post-2000s (Gen Z/Alpha) demographic (e.g., highlight fast WiFi, smart home features, local guides).
- Highlight unique local experiences or amenities relevant to the primary guest profile.
- Consider seasonal promotions aligned with peak travel times for key origin markets.
Nearby Short-Term Rental Market Comparison
How does the Favara Airbnb market stack up against its neighbors? Compare key performance metrics like average monthly revenue, ADR, and occupancy rates in surrounding areas to understand the broader regional STR landscape.
| Market | Active Properties | Monthly Revenue | Daily Rate | Avg. Occupancy |
|---|---|---|---|---|
| Għasri | 56 | $2,339 | $216.90 | 40% |
| Partinico | 112 | $2,077 | $283.49 | 39% |
| Santa Flavia | 189 | $1,866 | $165.16 | 47% |
| Xewkija | 36 | $1,766 | $167.34 | 43% |
| Cefalù | 1,003 | $1,764 | $182.13 | 48% |
| San Marco d'Alunzio | 13 | $1,726 | $174.71 | 38% |
| Collesano | 47 | $1,716 | $240.89 | 35% |
| Għarb | 92 | $1,685 | $194.52 | 38% |
| Buseto Palizzolo | 31 | $1,683 | $218.18 | 38% |
| Caronia | 41 | $1,674 | $178.18 | 44% |