Capaci Airbnb Market Analysis 2025: Short Term Rental Data & Vacation Rental Statistics in Sicily, Italy
Is Airbnb profitable in Capaci in 2025? Explore comprehensive Airbnb analytics for Capaci, Sicily, Italy to uncover income potential. This 2025 STR market report for Capaci, based on AirROI data from April 2024 to March 2025, reveals key trends in the niche market of 57 active listings.
Whether you're considering an Airbnb investment in Capaci, optimizing your existing vacation rental, or exploring rental arbitrage opportunities, understanding the Capaci Airbnb data is crucial. Navigating the high regulation landscape is key to maximizing your short term rental income potential. Let's dive into the specifics.
Key Capaci Airbnb Performance Metrics Overview
Monthly Airbnb Revenue Variations & Income Potential in Capaci (2025)
Understanding the monthly revenue variations for Airbnb listings in Capaci is key to maximizing your short term rental income potential. Seasonality significantly impacts earnings. Our analysis, based on data from the past 12 months, shows that the peak revenue month for STRs in Capaci is typically July, while February often presents the lowest earnings, highlighting opportunities for strategic pricing adjustments during shoulder and low seasons. Explore the typical Airbnb income in Capaci across different performance tiers:
- Best-in-class properties (Top 10%) achieve $2,954+ monthly, often utilizing dynamic pricing and superior guest experiences.
- Strong performing properties (Top 25%) earn $1,902 or more, indicating effective management and desirable locations/amenities.
- Typical properties (Median) generate around $1,031 per month, representing the average market performance.
- Entry-level properties (Bottom 25%) see earnings around $483, often with potential for optimization.
Average Monthly Airbnb Earnings Trend in Capaci
Capaci Airbnb Occupancy Rate Trends (2025)
Maximize your bookings by understanding the Capaci STR occupancy trends. Seasonal demand shifts significantly influence how often properties are booked. Typically, Julysees the highest demand (peak season occupancy), while January experiences the lowest (low season). Effective strategies, like adjusting minimum stays or offering promotions, can boost occupancy during slower periods. Here's how different property tiers perform in Capaci:
- Best-in-class properties (Top 10%) achieve 69%+ occupancy, indicating high desirability and potentially optimized availability.
- Strong performing properties (Top 25%) maintain 55% or higher occupancy, suggesting good market fit and guest satisfaction.
- Typical properties (Median) have an occupancy rate around 37%.
- Entry-level properties (Bottom 25%) average 16% occupancy, potentially facing higher vacancy.
Average Monthly Occupancy Rate Trend in Capaci
Average Daily Rate (ADR) Airbnb Trends in Capaci (2025)
Effective short term rental pricing strategy in Capaci involves understanding monthly ADR fluctuations. The Average Daily Rate (ADR) for Airbnb in Capaci typically peaks in August and dips lowest during March. Leveraging Airbnb dynamic pricing tools or strategies based on this seasonality can significantly boost revenue. Here's a look at the typical nightly rates achieved:
- Best-in-class properties (Top 10%) command rates of $157+ per night, often due to premium features or locations.
- Strong performing properties (Top 25%) achieve nightly rates of $116 or more.
- Typical properties (Median) charge around $90 per night.
- Entry-level properties (Bottom 25%) earn around $63 per night.
Average Daily Rate (ADR) Trend by Month in Capaci
Get Live Capaci Market Intelligence 👇

Explore Real-time Analytics
Airbnb Seasonality Analysis & Trends in Capaci (2025)
Peak Season (July, August, May)
- Revenue averages $2,292 per month
- Occupancy rates average 53.7%
- Daily rates average $114
Shoulder Season
- Revenue averages $1,273 per month
- Occupancy maintains around 36.3%
- Daily rates hold near $104
Low Season (January, February, March)
- Revenue drops to average $608 per month
- Occupancy decreases to average 23.4%
- Daily rates adjust to average $94
Seasonality Insights for Capaci
- The Airbnb seasonality in Capaci shows highly seasonal trends requiring careful strategy. While the sections above show seasonal averages, it's also insightful to look at the extremes:
- During the high season, the absolute peak month showcases Capaci's highest earning potential, with monthly revenues capable of climbing to $2,443, occupancy reaching a high of 57.5%, and ADRs peaking at $119.
- Conversely, the slowest single month of the year, typically falling within the low season, marks the market's lowest point. In this month, revenue might dip to $565, occupancy could drop to 19.2%, and ADRs may adjust down to $93.
- Understanding both the seasonal averages and these monthly peaks and troughs in revenue, occupancy, and ADR is crucial for maximizing your Airbnb profit potential in Capaci.
Seasonal Strategies for Maximizing Profit
- Peak Season: Maximize revenue through premium pricing and potentially longer minimum stays. Ensure high availability.
- Low Season: Offer competitive pricing, special promotions (e.g., extended stay discounts), and flexible cancellation policies. Target off-season travelers like remote workers or budget-conscious guests.
- Shoulder Seasons: Implement dynamic pricing that balances peak and low rates. Target weekend travelers or specific events. Offer slightly more flexible terms than peak season.
- Regularly analyze your own performance against these Capaci seasonality benchmarks and adjust your pricing and availability strategy accordingly.
Best Areas for Airbnb Investment in Capaci (2025)
Exploring the top neighborhoods for short-term rentals in Capaci? This section highlights key areas, outlining why they are attractive for hosts and guests, along with notable local attractions. Consider these locations based on your target guest profile and investment strategy.
| Neighborhood / Area | Why Host Here? (Target Guests & Appeal) | Key Attractions & Landmarks |
|---|---|---|
| Capaci Town Center | The heart of Capaci, known for its charming streets and local culture. Ideal for visitors wanting to experience the authentic Sicilian lifestyle and easy access to local shops and restaurants. | Capaci Beach, Tonnara di Capaci, Local restaurants, Historical center, Via Roma |
| Capaci Beach | A popular destination for beach lovers, offering golden sands and beautiful views of the Mediterranean. Attracts tourists looking for a seaside getaway with water activities. | Capaci Beach, Water sports, Beach clubs, Restaurants along the coast |
| Palermo (nearby) | Just a short drive from Capaci, Palermo offers rich history and culture. Easy access to the city's numerous attractions makes it a desirable spot for travelers. | Palermo Cathedral, Teatro Massimo, Quattro Canti, Capuchin Catacombs, Mercato di Ballarò |
| Isola delle Femmine | A nearby picturesque beach town known for its stunning coastline and calm waters. Popular for families and those seeking a tranquil retreat away from the larger cities. | Isola delle Femmine Beach, Nature Reserve, Local seafood restaurants, Scuba diving spots |
| Monreale | Famous for its cathedral and stunning views over Palermo, Monreale is perfect for culture seekers and architecture enthusiasts. A day trip from Capaci, yet highly attractive for visitors. | Monreale Cathedral, Benedictine Cloister, Views of Palermo, Local artisans |
| Sferracavallo | A charming fishing village close to Capaci, known for its fresh seafood and beautiful inlets. Great for travelers looking for authentic Sicilian experiences and local cuisine. | Fishing port, Local fish markets, Restaurants by the sea, Natural reserve nearby |
| Cinisi | Another nearby town with beautiful beaches and cultural significance, Cinisi is known for its artistic heritage and is an excellent spot for visitors looking to explore Sicilian traditions. | Beach of Magaggiari, Casa Memoria Felicia E Peppino Impastato, Local wineries |
| Uditore | A quiet residential area not far from Capaci, Uditore offers a more laid-back atmosphere for those seeking a peaceful getaway while still being close to Palermo's attractions. | Local parks, Residential charm, Cultural festivals, Accessibility to Palermo |
Understanding Airbnb License Requirements & STR Laws in Capaci (2025)
Yes, Capaci, Sicily, Italy enforces high STR regulations. Obtaining a license and ensuring compliance is almost certainly required according to current 2025 STR laws. Always verify the latest short term rental regulations and Airbnb license requirements directly with local government authorities for Capaci to ensure full compliance before hosting.
(Source: AirROI data, 2025, based on 54% licensed listings)
Top Performing Airbnb Properties in Capaci (2025)
Benchmark your potential! Explore examples of top-performing Airbnb properties in Capacibased on Trailing Twelve Month (TTM) revenue. Analyze their characteristics, revenue, occupancy rate, and ADR to understand what drives success in this market.
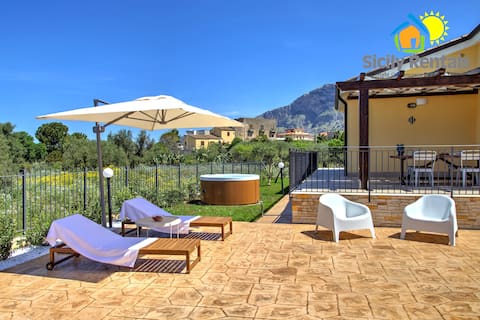
Jacuzzi villa and sauna near the beach
Entire Place • 5 bedrooms
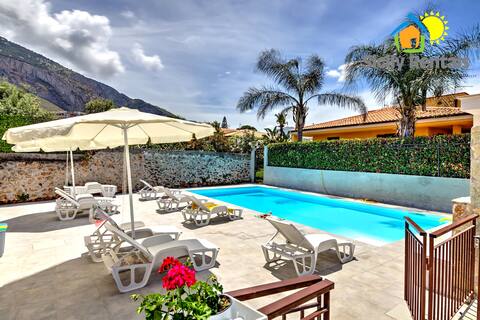
Maiolica - Pool Apartment by the Sea
Entire Place • 3 bedrooms
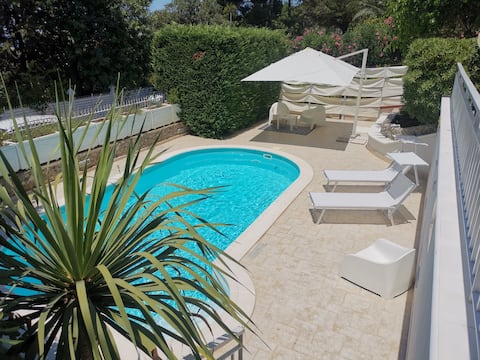
Villa Palladio
Entire Place • 2 bedrooms
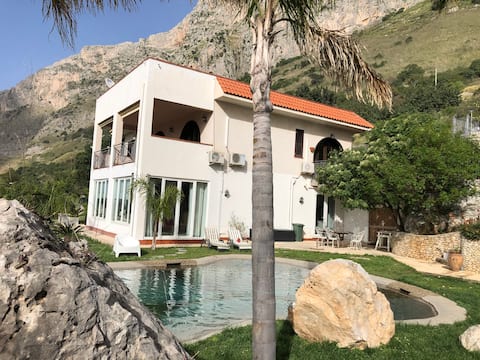
Villa Bologna with private pool
Entire Place • 4 bedrooms
Fico d 'India, Apartment with Pool
Entire Place • 3 bedrooms
Villa Grasta Nuova, exclusive, with pool
Entire Place • 5 bedrooms
Note: Performance varies based on location, size, amenities, seasonality, and management quality. Data reflects the past 12 months.
Top Performing Airbnb Hosts in Capaci (2025)
Learn from the best! This table showcases top-performing Airbnb hosts in Capaci based on the number of properties managed and estimated total revenue over the past year. Analyze their scale and performance metrics.
| Host Name | Properties | Grossing Revenue | Stay Reviews | Avg Rating |
|---|---|---|---|---|
| Francesco Paolo | 9 | $220,952 | 323 | 4.76/5.0 |
| Rosalia | 2 | $37,308 | 6 | 2.38/5.0 |
| Vincenzo | 1 | $30,419 | 59 | 4.97/5.0 |
| Vincenzo | 1 | $29,854 | 23 | 4.39/5.0 |
| Enzo | 3 | $29,037 | 32 | 4.94/5.0 |
| Silvana | 1 | $25,496 | 8 | 4.50/5.0 |
| Domenico | 2 | $23,207 | 92 | 4.95/5.0 |
| Veronica | 1 | $19,677 | 44 | 4.89/5.0 |
| Salvatore | 2 | $17,975 | 74 | 4.50/5.0 |
| Host #463454938 | 3 | $17,804 | 0 | 0.00/5.0 |
Analyzing the strategies of top hosts, such as their property selection, pricing, and guest communication, can offer valuable lessons for optimizing your own Airbnb operations in Capaci.
Dive Deeper: Advanced Capaci STR Market Data (2025)
Ready to unlock more insights? AirROI provides access to advanced metrics and comprehensive Airbnb data for Capaci. Explore detailed analytics beyond this report to refine your investment strategy, optimize pricing, and maximize your vacation rental profits.
Explore Advanced MetricsCapaci Short-Term Rental Market Composition (2025): Property & Room Types
Room Type Distribution
Property Type Distribution
Market Composition Insights for Capaci
- The Capaci Airbnb market composition is heavily skewed towards Entire Home/Apt listings, which make up 96.5% of the 57 active rentals. This indicates strong guest preference for privacy and space.
- Looking at the property type distribution in Capaci, Apartment/Condo properties are the most common (49.1%), reflecting the local real estate landscape.
- Houses represent a significant 43.9% portion, catering likely to families or larger groups.
- Smaller segments like outdoor/unique, hotel/boutique (combined 7.0%) offer potential for unique stay experiences.
Capaci Airbnb Room Capacity Analysis (2025): Bedroom Distribution
Distribution of Listings by Number of Bedrooms
Room Capacity Insights for Capaci
- The dominant room capacity in Capaci is 1 bedroom listings, making up 49.1% of the market. This suggests a strong demand for properties suitable for couples or solo travelers.
- Together, 1 bedroom and 2 bedrooms properties represent 82.4% of the active Airbnb listings in Capaci, indicating a high concentration in these sizes.
Capaci Vacation Rental Guest Capacity Trends (2025)
Distribution of Listings by Guest Capacity
Guest Capacity Insights for Capaci
- The most common guest capacity trend in Capaci vacation rentals is listings accommodating 4 guests (29.8%). This suggests the primary traveler segment is likely small families or groups.
- Properties designed for 4 guests and 5 guests dominate the Capaci STR market, accounting for 49.1% of listings.
- 28.1% of properties accommodate 6+ guests, serving the market segment for larger families or group travel in Capaci.
- On average, properties in Capaci are equipped to host 4.6 guests.
Capaci Airbnb Booking Patterns (2025): Available vs. Booked Days
Available Days Distribution
Booked Days Distribution
Booking Pattern Insights for Capaci
- The most common availability pattern in Capaci falls within the 271-366 days range, representing 57.9% of listings. This suggests many properties have significant open periods on their calendars.
- Approximately 93.0% of listings show high availability (181+ days open annually), indicating potential for increased bookings or specific owner usage patterns.
- For booked days, the 91-180 days range is most frequent in Capaci (40.4%), reflecting common guest stay durations or potential owner blocking patterns.
- A notable 7.0% of properties secure long booking periods (181+ days booked per year), highlighting successful long-term rental strategies or significant owner usage.
Capaci Airbnb Minimum Stay Requirements Analysis
Distribution of Listings by Minimum Night Requirement
1 Night
4 listings
8% of total
2 Nights
11 listings
22% of total
3 Nights
20 listings
40% of total
4-6 Nights
8 listings
16% of total
7-29 Nights
6 listings
12% of total
30+ Nights
1 listings
2% of total
Key Insights
- The most prevalent minimum stay requirement in Capaci is 3 Nights, adopted by 40% of listings. This highlights the market's preference for longer commitments.
- Dedicated monthly rentals (30+ nights) represent a small niche (2%), possibly an untapped area for hosts.
Recommendations
- Align with the market by considering a 3 Nights minimum stay, as 40% of Capaci hosts use this setting.
- If feasible, allowing 1-night stays, especially midweek or during low season, could capture last-minute bookings, as only 8% currently do.
- Adjust minimum nights based on seasonality – potentially shorter during low season and longer during peak demand periods in Capaci.
Capaci Airbnb Cancellation Policy Trends Analysis (2025)
Flexible
5 listings
11.6% of total
Moderate
24 listings
55.8% of total
Strict
14 listings
32.6% of total
Cancellation Policy Insights for Capaci
- The prevailing Airbnb cancellation policy trend in Capaci is Moderate, used by 55.8% of listings.
- There's a relatively balanced mix between guest-friendly (67.4%) and stricter (32.6%) policies, offering choices for different guest needs.
Recommendations for Hosts
- Consider adopting a Moderate policy to align with the 55.8% market standard in Capaci.
- With 32.6% using Strict terms, this is a viable option in Capaci, particularly for high-value properties or during peak demand periods.
- Regularly review your cancellation policy against competitors and market demand shifts in Capaci.
Capaci STR Booking Lead Time Analysis (2025)
Average Booking Lead Time by Month
Booking Lead Time Insights for Capaci
- The overall average booking lead time for vacation rentals in Capaci is 57 days.
- Guests book furthest in advance for stays during August (average 94 days), likely coinciding with peak travel demand or local events.
- The shortest booking windows occur for stays in January (average 25 days), indicating more last-minute travel plans during this time.
- Seasonally, Summer (80 days avg.) sees the longest lead times, while Winter (31 days avg.) has the shortest, reflecting typical travel planning cycles.
Recommendations for Hosts
- Use the overall average lead time (57 days) as a baseline for your pricing and availability strategy in Capaci.
- For August stays, consider implementing length-of-stay discounts or slightly higher rates for bookings made less than 94 days out to capitalize on advance planning.
- Target marketing efforts for the Summer season well in advance (at least 80 days) to capture early planners.
- Monitor your own booking lead times against these Capaci averages to identify opportunities for dynamic pricing adjustments.
Popular & Essential Airbnb Amenities in Capaci (2025)
Amenity Prevalence
Amenity Insights for Capaci
- Essential amenities in Capaci that guests expect include: Kitchen, TV, Air conditioning, Hot water, Washer. Lacking these (any) could significantly impact bookings.
- Popular amenities like Heating, Hangers, Hair dryer are common but not universal. Offering these can provide a competitive edge.
Recommendations for Hosts
- Ensure your listing includes all essential amenities for Capaci: Kitchen, TV, Air conditioning, Hot water, Washer.
- Prioritize adding missing essentials: Air conditioning, Hot water, Washer.
- Consider adding popular differentiators like Heating or Hangers to increase appeal.
- Highlight unique or less common amenities you offer (e.g., hot tub, dedicated workspace, EV charger) in your listing description and photos.
- Regularly check competitor amenities in Capaci to stay competitive.
Capaci Airbnb Guest Demographics & Profile Analysis (2025)
Guest Profile Summary for Capaci
- The typical guest profile for Airbnb in Capaci consists of predominantly international visitors (86%), with top international origins including France, typically belonging to the Post-2000s (Gen Z/Alpha) group (50%), primarily speaking English or German.
- Domestic travelers account for 13.9% of guests.
- Key international markets include Germany (22.2%) and France (20.4%).
- Top languages spoken are English (38%) followed by German (14%).
- A significant demographic segment is the Post-2000s (Gen Z/Alpha) group, representing 50% of guests.
Recommendations for Hosts
- Focus marketing internationally, particularly towards travelers from France.
- Tailor amenities and listing descriptions to appeal to the dominant Post-2000s (Gen Z/Alpha) demographic (e.g., highlight fast WiFi, smart home features, local guides).
- Highlight unique local experiences or amenities relevant to the primary guest profile.
- Consider seasonal promotions aligned with peak travel times for key origin markets.
Nearby Short-Term Rental Market Comparison
How does the Capaci Airbnb market stack up against its neighbors? Compare key performance metrics like average monthly revenue, ADR, and occupancy rates in surrounding areas to understand the broader regional STR landscape.
| Market | Active Properties | Monthly Revenue | Daily Rate | Avg. Occupancy |
|---|---|---|---|---|
| Partinico | 112 | $2,077 | $283.49 | 39% |
| Santa Flavia | 189 | $1,866 | $165.16 | 47% |
| Cefalù | 1,003 | $1,764 | $182.13 | 48% |
| San Marco d'Alunzio | 13 | $1,726 | $174.71 | 38% |
| Collesano | 47 | $1,716 | $240.89 | 35% |
| Buseto Palizzolo | 31 | $1,683 | $218.18 | 38% |
| Caronia | 41 | $1,674 | $178.18 | 44% |
| Mistretta | 10 | $1,627 | $153.31 | 39% |
| Altavilla Milicia | 79 | $1,568 | $210.58 | 42% |
| Acquedolci | 28 | $1,512 | $195.95 | 40% |