Teulada Airbnb Market Analysis 2025: Short Term Rental Data & Vacation Rental Statistics in Sardinia, Italy
Is Airbnb profitable in Teulada in 2025? Explore comprehensive Airbnb analytics for Teulada, Sardinia, Italy to uncover income potential. This 2025 STR market report for Teulada, based on AirROI data from April 2024 to March 2025, reveals key trends in the niche market of 127 active listings.
Whether you're considering an Airbnb investment in Teulada, optimizing your existing vacation rental, or exploring rental arbitrage opportunities, understanding the Teulada Airbnb data is crucial. Navigating the high regulation landscape is key to maximizing your short term rental income potential. Let's dive into the specifics.
Key Teulada Airbnb Performance Metrics Overview
Monthly Airbnb Revenue Variations & Income Potential in Teulada (2025)
Understanding the monthly revenue variations for Airbnb listings in Teulada is key to maximizing your short term rental income potential. Seasonality significantly impacts earnings. Our analysis, based on data from the past 12 months, shows that the peak revenue month for STRs in Teulada is typically August, while January often presents the lowest earnings, highlighting opportunities for strategic pricing adjustments during shoulder and low seasons. Explore the typical Airbnb income in Teulada across different performance tiers:
- Best-in-class properties (Top 10%) achieve $2,780+ monthly, often utilizing dynamic pricing and superior guest experiences.
- Strong performing properties (Top 25%) earn $1,734 or more, indicating effective management and desirable locations/amenities.
- Typical properties (Median) generate around $1,029 per month, representing the average market performance.
- Entry-level properties (Bottom 25%) see earnings around $558, often with potential for optimization.
Average Monthly Airbnb Earnings Trend in Teulada
Teulada Airbnb Occupancy Rate Trends (2025)
Maximize your bookings by understanding the Teulada STR occupancy trends. Seasonal demand shifts significantly influence how often properties are booked. Typically, Augustsees the highest demand (peak season occupancy), while February experiences the lowest (low season). Effective strategies, like adjusting minimum stays or offering promotions, can boost occupancy during slower periods. Here's how different property tiers perform in Teulada:
- Best-in-class properties (Top 10%) achieve 69%+ occupancy, indicating high desirability and potentially optimized availability.
- Strong performing properties (Top 25%) maintain 53% or higher occupancy, suggesting good market fit and guest satisfaction.
- Typical properties (Median) have an occupancy rate around 33%.
- Entry-level properties (Bottom 25%) average 17% occupancy, potentially facing higher vacancy.
Average Monthly Occupancy Rate Trend in Teulada
Average Daily Rate (ADR) Airbnb Trends in Teulada (2025)
Effective short term rental pricing strategy in Teulada involves understanding monthly ADR fluctuations. The Average Daily Rate (ADR) for Airbnb in Teulada typically peaks in August and dips lowest during April. Leveraging Airbnb dynamic pricing tools or strategies based on this seasonality can significantly boost revenue. Here's a look at the typical nightly rates achieved:
- Best-in-class properties (Top 10%) command rates of $208+ per night, often due to premium features or locations.
- Strong performing properties (Top 25%) achieve nightly rates of $128 or more.
- Typical properties (Median) charge around $95 per night.
- Entry-level properties (Bottom 25%) earn around $77 per night.
Average Daily Rate (ADR) Trend by Month in Teulada
Get Live Teulada Market Intelligence 👇

Explore Real-time Analytics
Airbnb Seasonality Analysis & Trends in Teulada (2025)
Peak Season (August, July, September)
- Revenue averages $2,444 per month
- Occupancy rates average 59.7%
- Daily rates average $134
Shoulder Season
- Revenue averages $1,252 per month
- Occupancy maintains around 34.3%
- Daily rates hold near $126
Low Season (January, February, March)
- Revenue drops to average $493 per month
- Occupancy decreases to average 15.9%
- Daily rates adjust to average $130
Seasonality Insights for Teulada
- The Airbnb seasonality in Teulada shows highly seasonal trends requiring careful strategy. While the sections above show seasonal averages, it's also insightful to look at the extremes:
- During the high season, the absolute peak month showcases Teulada's highest earning potential, with monthly revenues capable of climbing to $2,966, occupancy reaching a high of 70.9%, and ADRs peaking at $139.
- Conversely, the slowest single month of the year, typically falling within the low season, marks the market's lowest point. In this month, revenue might dip to $401, occupancy could drop to 11.4%, and ADRs may adjust down to $121.
- Understanding both the seasonal averages and these monthly peaks and troughs in revenue, occupancy, and ADR is crucial for maximizing your Airbnb profit potential in Teulada.
Seasonal Strategies for Maximizing Profit
- Peak Season: Maximize revenue through premium pricing and potentially longer minimum stays. Ensure high availability.
- Low Season: Offer competitive pricing, special promotions (e.g., extended stay discounts), and flexible cancellation policies. Target off-season travelers like remote workers or budget-conscious guests.
- Shoulder Seasons: Implement dynamic pricing that balances peak and low rates. Target weekend travelers or specific events. Offer slightly more flexible terms than peak season.
- Regularly analyze your own performance against these Teulada seasonality benchmarks and adjust your pricing and availability strategy accordingly.
Best Areas for Airbnb Investment in Teulada (2025)
Exploring the top neighborhoods for short-term rentals in Teulada? This section highlights key areas, outlining why they are attractive for hosts and guests, along with notable local attractions. Consider these locations based on your target guest profile and investment strategy.
| Neighborhood / Area | Why Host Here? (Target Guests & Appeal) | Key Attractions & Landmarks |
|---|---|---|
| Porto Cervo | Luxurious resort town known for its stunning beaches, high-end shopping, and vibrant nightlife. A prime location for upscale tourists looking for a lavish experience in Sardinia. | Spiaggia del Principe, Capriccioli Beach, Liscia Ruja Beach, Porto Cervo Marina, Stella Maris Church |
| San Teodoro | Popular beach destination with youthful energy, beautiful beaches, and a lively nightlife. Attracts families and young travelers seeking sun and fun. | La Cinta Beach, Lu Impostu Beach, San Teodoro Night Market, Tavolara Island |
| Costa Paradiso | Stunning coastal area known for its rugged cliffs and beautiful beaches. A great spot for nature lovers and those looking for tranquility away from the crowds. | Li Cossi Beach, Costa Paradiso Capo, La Marinedda, Isola Rossa |
| Alghero | Charming medieval town with a rich history and beautiful coastline. A favorite for tourists interested in culture, history, and nature. | Alghero Old Town, Maria Pia Beach, Capo Caccia, Grotte di Nettuno |
| Orosei | Quaint town situated near the beautiful Gulf of Orosei, known for its stunning beaches and charming piazzas. Perfect for families and those seeking relaxation. | Marina di Orosei, Cala Liberotto, Golfo di Orosei, Orosei Historic Center |
| Castelsardo | Medieval town perched on a hill, offering stunning sea views and a rich historical heritage. Attracts tourists interested in culture and history. | Castelsardo Cathedral, Doria Castle, Elephant Rock, Bajolo Beach |
| Pula | Close to ancient ruins and beautiful beaches, known for its lively atmosphere and family-friendly activities. A great spot for cultural enthusiasts and sunbathers alike. | Nora Archaeological Site, Spiaggia di Chia, Teulada Beach, Laguna di Nora |
| Cagliari | The capital city of Sardinia, known for its rich culture, history, and fantastic food scene. Popular with visitors looking for urban experiences along with beach access. | Cagliari's Castello District, Poetto Beach, Roman Amphitheatre, Mari Pintau Beach |
Understanding Airbnb License Requirements & STR Laws in Teulada (2025)
Yes, Teulada, Sardinia, Italy enforces high STR regulations. Obtaining a license and ensuring compliance is almost certainly required according to current 2025 STR laws. Always verify the latest short term rental regulations and Airbnb license requirements directly with local government authorities for Teulada to ensure full compliance before hosting.
(Source: AirROI data, 2025, based on 57% licensed listings)
Top Performing Airbnb Properties in Teulada (2025)
Benchmark your potential! Explore examples of top-performing Airbnb properties in Teuladabased on Trailing Twelve Month (TTM) revenue. Analyze their characteristics, revenue, occupancy rate, and ADR to understand what drives success in this market.
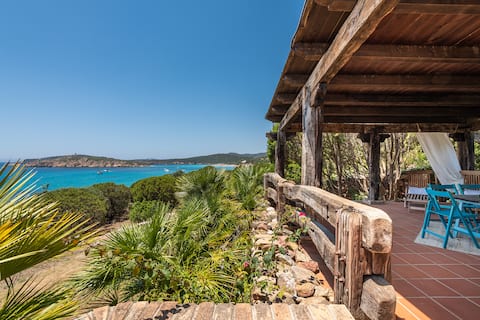
Villa Chiarenza, Tuerredda
Entire Place • 3 bedrooms
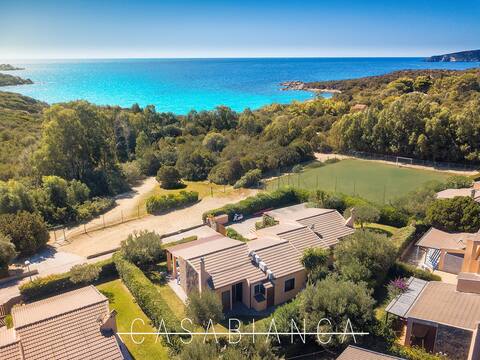
Casabianca Tuerredda
Entire Place • 2 bedrooms
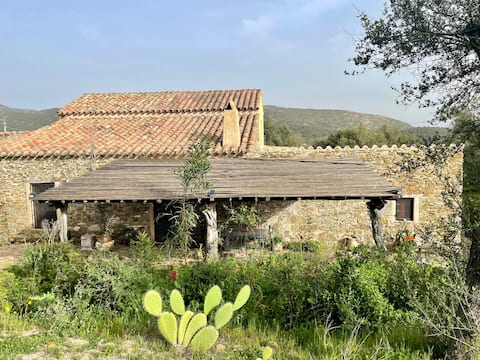
Amazing Beach House
Entire Place • 2 bedrooms

30 meters from the sea, 2 bedrooms, 2 bathrooms.
Entire Place • 2 bedrooms
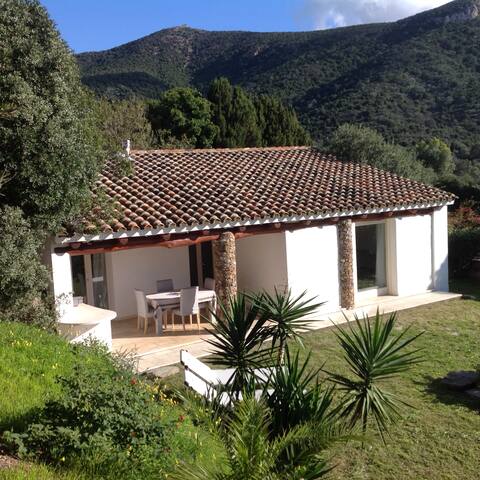
Typical house nestled in Mediterranean landscape
Entire Place • 1 bedroom
Villa Bianca in Perdalonga sleeps 8/10.
Entire Place • 4 bedrooms
Note: Performance varies based on location, size, amenities, seasonality, and management quality. Data reflects the past 12 months.
Top Performing Airbnb Hosts in Teulada (2025)
Learn from the best! This table showcases top-performing Airbnb hosts in Teulada based on the number of properties managed and estimated total revenue over the past year. Analyze their scale and performance metrics.
| Host Name | Properties | Grossing Revenue | Stay Reviews | Avg Rating |
|---|---|---|---|---|
| Karin Angela | 2 | $57,173 | 28 | 4.71/5.0 |
| Alessandra | 1 | $49,257 | 6 | 5.00/5.0 |
| Ramon | 1 | $44,662 | 45 | 4.98/5.0 |
| Jody | 1 | $44,359 | 69 | 4.91/5.0 |
| Daniele | 2 | $31,250 | 28 | 4.98/5.0 |
| Renata | 2 | $30,304 | 106 | 4.96/5.0 |
| Stefania | 1 | $27,031 | 10 | 5.00/5.0 |
| Host #469210865 | 1 | $24,077 | 0 | 0.00/5.0 |
| Oscar Elisa | 1 | $23,656 | 9 | 5.00/5.0 |
| Valentina | 2 | $23,639 | 34 | 4.88/5.0 |
Analyzing the strategies of top hosts, such as their property selection, pricing, and guest communication, can offer valuable lessons for optimizing your own Airbnb operations in Teulada.
Dive Deeper: Advanced Teulada STR Market Data (2025)
Ready to unlock more insights? AirROI provides access to advanced metrics and comprehensive Airbnb data for Teulada. Explore detailed analytics beyond this report to refine your investment strategy, optimize pricing, and maximize your vacation rental profits.
Explore Advanced MetricsTeulada Short-Term Rental Market Composition (2025): Property & Room Types
Room Type Distribution
Property Type Distribution
Market Composition Insights for Teulada
- The Teulada Airbnb market composition is heavily skewed towards Entire Home/Apt listings, which make up 90.6% of the 127 active rentals. This indicates strong guest preference for privacy and space.
- Looking at the property type distribution in Teulada, House properties are the most common (52%), reflecting the local real estate landscape.
- Houses represent a significant 52% portion, catering likely to families or larger groups.
- Smaller segments like hotel/boutique, outdoor/unique, unique stays (combined 6.3%) offer potential for unique stay experiences.
Teulada Airbnb Room Capacity Analysis (2025): Bedroom Distribution
Distribution of Listings by Number of Bedrooms
Room Capacity Insights for Teulada
- The dominant room capacity in Teulada is 1 bedroom listings, making up 47.2% of the market. This suggests a strong demand for properties suitable for couples or solo travelers.
- Together, 1 bedroom and 2 bedrooms properties represent 82.6% of the active Airbnb listings in Teulada, indicating a high concentration in these sizes.
Teulada Vacation Rental Guest Capacity Trends (2025)
Distribution of Listings by Guest Capacity
Guest Capacity Insights for Teulada
- The most common guest capacity trend in Teulada vacation rentals is listings accommodating 4 guests (33.1%). This suggests the primary traveler segment is likely small families or groups.
- Properties designed for 4 guests and 2 guests dominate the Teulada STR market, accounting for 59.9% of listings.
- 15.8% of properties accommodate 6+ guests, serving the market segment for larger families or group travel in Teulada.
- On average, properties in Teulada are equipped to host 3.6 guests.
Teulada Airbnb Booking Patterns (2025): Available vs. Booked Days
Available Days Distribution
Booked Days Distribution
Booking Pattern Insights for Teulada
- The most common availability pattern in Teulada falls within the 271-366 days range, representing 59.1% of listings. This suggests many properties have significant open periods on their calendars.
- Approximately 93.0% of listings show high availability (181+ days open annually), indicating potential for increased bookings or specific owner usage patterns.
- For booked days, the 31-90 days range is most frequent in Teulada (40.9%), reflecting common guest stay durations or potential owner blocking patterns.
- A notable 8.7% of properties secure long booking periods (181+ days booked per year), highlighting successful long-term rental strategies or significant owner usage.
Teulada Airbnb Minimum Stay Requirements Analysis
Distribution of Listings by Minimum Night Requirement
1 Night
13 listings
10.7% of total
2 Nights
16 listings
13.2% of total
3 Nights
21 listings
17.4% of total
4-6 Nights
51 listings
42.1% of total
7-29 Nights
15 listings
12.4% of total
30+ Nights
5 listings
4.1% of total
Key Insights
- The most prevalent minimum stay requirement in Teulada is 4-6 Nights, adopted by 42.1% of listings. This highlights the market's preference for longer commitments.
Recommendations
- Align with the market by considering a 4-6 Nights minimum stay, as 42.1% of Teulada hosts use this setting.
- If feasible, allowing 1-night stays, especially midweek or during low season, could capture last-minute bookings, as only 10.7% currently do.
- Adjust minimum nights based on seasonality – potentially shorter during low season and longer during peak demand periods in Teulada.
Teulada Airbnb Cancellation Policy Trends Analysis (2025)
Flexible
18 listings
16.8% of total
Moderate
46 listings
43% of total
Strict
43 listings
40.2% of total
Cancellation Policy Insights for Teulada
- The prevailing Airbnb cancellation policy trend in Teulada is Moderate, used by 43% of listings.
- There's a relatively balanced mix between guest-friendly (59.8%) and stricter (40.2%) policies, offering choices for different guest needs.
Recommendations for Hosts
- Consider adopting a Moderate policy to align with the 43% market standard in Teulada.
- With 40.2% using Strict terms, this is a viable option in Teulada, particularly for high-value properties or during peak demand periods.
- Regularly review your cancellation policy against competitors and market demand shifts in Teulada.
Teulada STR Booking Lead Time Analysis (2025)
Average Booking Lead Time by Month
Booking Lead Time Insights for Teulada
- The overall average booking lead time for vacation rentals in Teulada is 73 days.
- Guests book furthest in advance for stays during November (average 121 days), likely coinciding with peak travel demand or local events.
- The shortest booking windows occur for stays in January (average 23 days), indicating more last-minute travel plans during this time.
- Seasonally, Summer (99 days avg.) sees the longest lead times, while Winter (52 days avg.) has the shortest, reflecting typical travel planning cycles.
Recommendations for Hosts
- Use the overall average lead time (73 days) as a baseline for your pricing and availability strategy in Teulada.
- For November stays, consider implementing length-of-stay discounts or slightly higher rates for bookings made less than 121 days out to capitalize on advance planning.
- Target marketing efforts for the Summer season well in advance (at least 99 days) to capture early planners.
- Monitor your own booking lead times against these Teulada averages to identify opportunities for dynamic pricing adjustments.
Popular & Essential Airbnb Amenities in Teulada (2025)
Amenity Prevalence
Amenity Insights for Teulada
- Popular amenities like Hot water, TV, Hair dryer are common but not universal. Offering these can provide a competitive edge.
Recommendations for Hosts
- Consider adding popular differentiators like Hot water or TV to increase appeal.
- Highlight unique or less common amenities you offer (e.g., hot tub, dedicated workspace, EV charger) in your listing description and photos.
- Regularly check competitor amenities in Teulada to stay competitive.
Teulada Airbnb Guest Demographics & Profile Analysis (2025)
Guest Profile Summary for Teulada
- The typical guest profile for Airbnb in Teulada consists of predominantly international visitors (67%), with top international origins including Germany, typically belonging to the Post-2000s (Gen Z/Alpha) group (50%), primarily speaking English or German.
- Domestic travelers account for 33.1% of guests.
- Key international markets include Italy (33.1%) and Germany (22.3%).
- Top languages spoken are English (37.5%) followed by German (16%).
- A significant demographic segment is the Post-2000s (Gen Z/Alpha) group, representing 50% of guests.
Recommendations for Hosts
- Focus marketing internationally, particularly towards travelers from Germany.
- Tailor amenities and listing descriptions to appeal to the dominant Post-2000s (Gen Z/Alpha) demographic (e.g., highlight fast WiFi, smart home features, local guides).
- Highlight unique local experiences or amenities relevant to the primary guest profile.
- Consider seasonal promotions aligned with peak travel times for key origin markets.
Nearby Short-Term Rental Market Comparison
How does the Teulada Airbnb market stack up against its neighbors? Compare key performance metrics like average monthly revenue, ADR, and occupancy rates in surrounding areas to understand the broader regional STR landscape.
| Market | Active Properties | Monthly Revenue | Daily Rate | Avg. Occupancy |
|---|---|---|---|---|
| Maracalagonis | 285 | $2,096 | $302.75 | 46% |
| Sarrocu/Sarroch | 92 | $1,796 | $228.04 | 43% |
| Castiadas | 185 | $1,705 | $225.34 | 46% |
| Sìnnia/Sinnai | 184 | $1,383 | $194.38 | 42% |
| Crabonaxa/Villasimius | 858 | $1,327 | $218.91 | 44% |
| Domus De Maria | 306 | $1,316 | $193.99 | 45% |
| Quartu Sant'Aleni/Quartu Sant'Elena | 844 | $1,309 | $168.13 | 45% |
| Pula | 611 | $1,292 | $193.78 | 42% |
| Murera/Muravera | 494 | $1,257 | $192.59 | 44% |
| Tertenia | 202 | $1,221 | $144.82 | 51% |