Sestu Airbnb Market Analysis 2025: Short Term Rental Data & Vacation Rental Statistics in Sardinia, Italy
Is Airbnb profitable in Sestu in 2025? Explore comprehensive Airbnb analytics for Sestu, Sardinia, Italy to uncover income potential. This 2025 STR market report for Sestu, based on AirROI data from April 2024 to March 2025, reveals key trends in the niche market of 26 active listings.
Whether you're considering an Airbnb investment in Sestu, optimizing your existing vacation rental, or exploring rental arbitrage opportunities, understanding the Sestu Airbnb data is crucial. Navigating the high regulation landscape is key to maximizing your short term rental income potential. Let's dive into the specifics.
Key Sestu Airbnb Performance Metrics Overview
Monthly Airbnb Revenue Variations & Income Potential in Sestu (2025)
Understanding the monthly revenue variations for Airbnb listings in Sestu is key to maximizing your short term rental income potential. Seasonality significantly impacts earnings. Our analysis, based on data from the past 12 months, shows that the peak revenue month for STRs in Sestu is typically August, while February often presents the lowest earnings, highlighting opportunities for strategic pricing adjustments during shoulder and low seasons. Explore the typical Airbnb income in Sestu across different performance tiers:
- Best-in-class properties (Top 10%) achieve $2,064+ monthly, often utilizing dynamic pricing and superior guest experiences.
- Strong performing properties (Top 25%) earn $1,480 or more, indicating effective management and desirable locations/amenities.
- Typical properties (Median) generate around $635 per month, representing the average market performance.
- Entry-level properties (Bottom 25%) see earnings around $393, often with potential for optimization.
Average Monthly Airbnb Earnings Trend in Sestu
Sestu Airbnb Occupancy Rate Trends (2025)
Maximize your bookings by understanding the Sestu STR occupancy trends. Seasonal demand shifts significantly influence how often properties are booked. Typically, Julysees the highest demand (peak season occupancy), while January experiences the lowest (low season). Effective strategies, like adjusting minimum stays or offering promotions, can boost occupancy during slower periods. Here's how different property tiers perform in Sestu:
- Best-in-class properties (Top 10%) achieve 69%+ occupancy, indicating high desirability and potentially optimized availability.
- Strong performing properties (Top 25%) maintain 51% or higher occupancy, suggesting good market fit and guest satisfaction.
- Typical properties (Median) have an occupancy rate around 26%.
- Entry-level properties (Bottom 25%) average 11% occupancy, potentially facing higher vacancy.
Average Monthly Occupancy Rate Trend in Sestu
Average Daily Rate (ADR) Airbnb Trends in Sestu (2025)
Effective short term rental pricing strategy in Sestu involves understanding monthly ADR fluctuations. The Average Daily Rate (ADR) for Airbnb in Sestu typically peaks in January and dips lowest during April. Leveraging Airbnb dynamic pricing tools or strategies based on this seasonality can significantly boost revenue. Here's a look at the typical nightly rates achieved:
- Best-in-class properties (Top 10%) command rates of $149+ per night, often due to premium features or locations.
- Strong performing properties (Top 25%) achieve nightly rates of $86 or more.
- Typical properties (Median) charge around $73 per night.
- Entry-level properties (Bottom 25%) earn around $58 per night.
Average Daily Rate (ADR) Trend by Month in Sestu
Get Live Sestu Market Intelligence 👇

Explore Real-time Analytics
Airbnb Seasonality Analysis & Trends in Sestu (2025)
Peak Season (August, July, June)
- Revenue averages $1,449 per month
- Occupancy rates average 46.8%
- Daily rates average $80
Shoulder Season
- Revenue averages $881 per month
- Occupancy maintains around 26.2%
- Daily rates hold near $83
Low Season (February, March, November)
- Revenue drops to average $633 per month
- Occupancy decreases to average 30.7%
- Daily rates adjust to average $88
Seasonality Insights for Sestu
- The Airbnb seasonality in Sestu shows highly seasonal trends requiring careful strategy. While the sections above show seasonal averages, it's also insightful to look at the extremes:
- During the high season, the absolute peak month showcases Sestu's highest earning potential, with monthly revenues capable of climbing to $1,637, occupancy reaching a high of 51.6%, and ADRs peaking at $95.
- Conversely, the slowest single month of the year, typically falling within the low season, marks the market's lowest point. In this month, revenue might dip to $513, occupancy could drop to 21.0%, and ADRs may adjust down to $76.
- Understanding both the seasonal averages and these monthly peaks and troughs in revenue, occupancy, and ADR is crucial for maximizing your Airbnb profit potential in Sestu.
Seasonal Strategies for Maximizing Profit
- Peak Season: Maximize revenue through premium pricing and potentially longer minimum stays. Ensure high availability.
- Low Season: Offer competitive pricing, special promotions (e.g., extended stay discounts), and flexible cancellation policies. Target off-season travelers like remote workers or budget-conscious guests.
- Shoulder Seasons: Implement dynamic pricing that balances peak and low rates. Target weekend travelers or specific events. Offer slightly more flexible terms than peak season.
- Regularly analyze your own performance against these Sestu seasonality benchmarks and adjust your pricing and availability strategy accordingly.
Best Areas for Airbnb Investment in Sestu (2025)
Exploring the top neighborhoods for short-term rentals in Sestu? This section highlights key areas, outlining why they are attractive for hosts and guests, along with notable local attractions. Consider these locations based on your target guest profile and investment strategy.
| Neighborhood / Area | Why Host Here? (Target Guests & Appeal) | Key Attractions & Landmarks |
|---|---|---|
| Sestu City Center | The heart of Sestu with easy access to local shops, restaurants, and services. It's a perfect area for visitors looking to immerse themselves in local culture and amenities. | Local shops, Restaurants, Sestu Town Hall, Public parks, Libraries |
| Salt Pond Area | This area is known for its natural beauty and proximity to popular beaches. Ideal for guests wanting a relaxing getaway with outdoor activities. | Poetto Beach, Salt ponds, Nature trails, Birdwatching spots, Local cafes |
| Stained Glass Street | Famous for its stunning architecture and historical significance. Attracts tourists interested in local history and art. | Church of San Giovanni, Historic buildings, Artisan shops, Cultural events, Art exhibitions |
| Nearby Cagliari | Being close to the regional capital of Cagliari, Sestu offers easy access to a wide range of attractions, making it an attractive stay for visitors. | Cagliari's Castello district, Poetto Beach, Museums, Shopping districts, Vibrant nightlife |
| Hiking Trails | The surrounding areas offer amazing hiking opportunities, drawing nature enthusiasts and outdoor lovers who seek adventure. | Monte Sette Fratelli, Natural parks, Scenic viewpoints, Hiking paths, Wildlife watching |
| Wine Country | Famous for its local vineyards, this area attracts wine lovers and tourists looking for culinary experiences. | Local wineries, Wine tasting tours, Gastronomic events, Vineyard tours, Cooking classes |
| Cultural Sites | Sestu is home to multiple cultural sites that highlight the rich Sardinian heritage, appealing to history buffs. | Archaeological sites, Museums, Festivals, Local art galleries, Historical tours |
| Sports and Recreation | This area offers numerous facilities for sports and recreation, making it appealing for those seeking active vacations. | Sports complexes, Public parks, Cycling routes, Playgrounds, Outdoor gyms |
Understanding Airbnb License Requirements & STR Laws in Sestu (2025)
Yes, Sestu, Sardinia, Italy enforces high STR regulations. Obtaining a license and ensuring compliance is almost certainly required according to current 2025 STR laws. Always verify the latest short term rental regulations and Airbnb license requirements directly with local government authorities for Sestu to ensure full compliance before hosting.
(Source: AirROI data, 2025, based on 42% licensed listings)
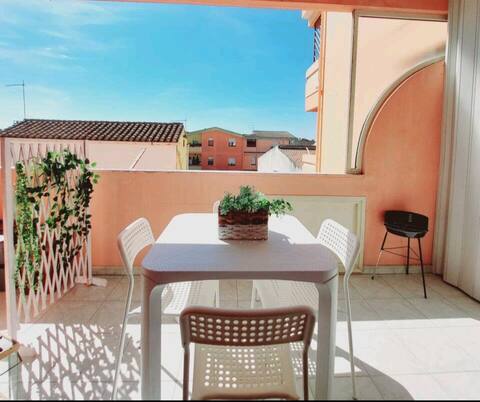
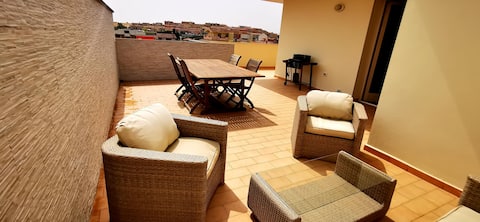
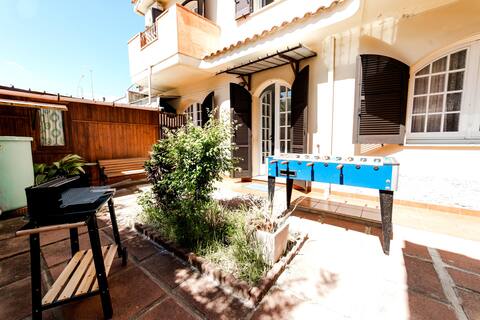
Top Performing Airbnb Properties in Sestu (2025)
Benchmark your potential! Explore examples of top-performing Airbnb properties in Sestubased on Trailing Twelve Month (TTM) revenue. Analyze their characteristics, revenue, occupancy rate, and ADR to understand what drives success in this market.
Lavy's House - Private Parking + Wifi
Entire Place • 2 bedrooms
Trivano Modern penthouse with terrace and parking lot
Entire Place • 2 bedrooms
Independent house with courtyard Iun: Q8619
Entire Place • 3 bedrooms
Apartment and pool in private villa IUNQ8568
Entire Place • 3 bedrooms

"Appartamento da Fouli" (IT092074C2000Q0869)
Entire Place • 1 bedroom
appartamento indipendente con posto auto
Entire Place • 1 bedroom
Note: Performance varies based on location, size, amenities, seasonality, and management quality. Data reflects the past 12 months.
Top Performing Airbnb Hosts in Sestu (2025)
Learn from the best! This table showcases top-performing Airbnb hosts in Sestu based on the number of properties managed and estimated total revenue over the past year. Analyze their scale and performance metrics.
| Host Name | Properties | Grossing Revenue | Stay Reviews | Avg Rating |
|---|---|---|---|---|
| Fabrizio | 2 | $20,983 | 13 | 5.00/5.0 |
| Marta | 1 | $19,818 | 17 | 4.82/5.0 |
| Lorenzo | 1 | $18,994 | 53 | 4.89/5.0 |
| Skye Alexander | 1 | $16,548 | 25 | 4.80/5.0 |
| Carlo | 1 | $13,593 | 25 | 4.68/5.0 |
| Host #192625708 | 1 | $11,151 | 40 | 4.55/5.0 |
| Host #190776286 | 1 | $8,153 | 107 | 4.84/5.0 |
| Host #2314887 | 1 | $7,028 | 1 | 0.00/5.0 |
| Paola | 1 | $6,726 | 17 | 4.71/5.0 |
| Francesca | 1 | $4,637 | 32 | 4.91/5.0 |
Analyzing the strategies of top hosts, such as their property selection, pricing, and guest communication, can offer valuable lessons for optimizing your own Airbnb operations in Sestu.
Dive Deeper: Advanced Sestu STR Market Data (2025)
Ready to unlock more insights? AirROI provides access to advanced metrics and comprehensive Airbnb data for Sestu. Explore detailed analytics beyond this report to refine your investment strategy, optimize pricing, and maximize your vacation rental profits.
Explore Advanced MetricsSestu Short-Term Rental Market Composition (2025): Property & Room Types
Room Type Distribution
Property Type Distribution
Market Composition Insights for Sestu
- The Sestu Airbnb market composition is heavily skewed towards Entire Home/Apt listings, which make up 73.1% of the 26 active rentals. This indicates strong guest preference for privacy and space.
- Looking at the property type distribution in Sestu, Apartment/Condo properties are the most common (65.4%), reflecting the local real estate landscape.
- Houses represent a significant 19.2% portion, catering likely to families or larger groups.
- The presence of 15.4% Hotel/Boutique listings indicates integration with traditional hospitality.
Sestu Airbnb Room Capacity Analysis (2025): Bedroom Distribution
Distribution of Listings by Number of Bedrooms
Room Capacity Insights for Sestu
- The dominant room capacity in Sestu is 1 bedroom listings, making up 53.8% of the market. This suggests a strong demand for properties suitable for couples or solo travelers.
- Together, 1 bedroom and 2 bedrooms properties represent 88.4% of the active Airbnb listings in Sestu, indicating a high concentration in these sizes.
- With over half the market (53.8%) consisting of studios or 1-bedroom units, Sestu is particularly well-suited for individuals or couples.
- Listings with 3+ bedrooms (7.7%) represent a smaller niche, potentially indicating an underserved market for larger group accommodations in Sestu.
Sestu Vacation Rental Guest Capacity Trends (2025)
Distribution of Listings by Guest Capacity
Guest Capacity Insights for Sestu
- The most common guest capacity trend in Sestu vacation rentals is listings accommodating 2 guests (34.6%). This suggests the primary traveler segment is likely couples or solo travelers.
- Properties designed for 2 guests and 4 guests dominate the Sestu STR market, accounting for 57.7% of listings.
- On average, properties in Sestu are equipped to host 3.3 guests.
Sestu Airbnb Booking Patterns (2025): Available vs. Booked Days
Available Days Distribution
Booked Days Distribution
Booking Pattern Insights for Sestu
- The most common availability pattern in Sestu falls within the 271-366 days range, representing 80.8% of listings. This suggests many properties have significant open periods on their calendars.
- Approximately 92.3% of listings show high availability (181+ days open annually), indicating potential for increased bookings or specific owner usage patterns.
- For booked days, the 1-30 days range is most frequent in Sestu (50%), reflecting common guest stay durations or potential owner blocking patterns.
- A notable 7.7% of properties secure long booking periods (181+ days booked per year), highlighting successful long-term rental strategies or significant owner usage.
Sestu Airbnb Minimum Stay Requirements Analysis
Distribution of Listings by Minimum Night Requirement
1 Night
4 listings
18.2% of total
2 Nights
4 listings
18.2% of total
3 Nights
4 listings
18.2% of total
4-6 Nights
3 listings
13.6% of total
7-29 Nights
5 listings
22.7% of total
30+ Nights
2 listings
9.1% of total
Key Insights
- The most prevalent minimum stay requirement in Sestu is 7-29 Nights, adopted by 22.7% of listings. This highlights the market's preference for shorter, flexible bookings.
Recommendations
- Align with the market by considering a 7-29 Nights minimum stay, as 22.7% of Sestu hosts use this setting.
- If feasible, allowing 1-night stays, especially midweek or during low season, could capture last-minute bookings, as only 18.2% currently do.
- Explore offering discounts for stays of 30+ nights to attract the 9.1% of the market seeking extended stays.
- Adjust minimum nights based on seasonality – potentially shorter during low season and longer during peak demand periods in Sestu.
Sestu Airbnb Cancellation Policy Trends Analysis (2025)
Flexible
5 listings
31.3% of total
Moderate
8 listings
50% of total
Strict
3 listings
18.8% of total
Cancellation Policy Insights for Sestu
- The prevailing Airbnb cancellation policy trend in Sestu is Moderate, used by 50% of listings.
- The market strongly favors guest-friendly terms, with 81.3% of listings offering Flexible or Moderate policies. This suggests guests in Sestu may expect booking flexibility.
Recommendations for Hosts
- Consider adopting a Moderate policy to align with the 50% market standard in Sestu.
- Regularly review your cancellation policy against competitors and market demand shifts in Sestu.
Sestu STR Booking Lead Time Analysis (2025)
Average Booking Lead Time by Month
Booking Lead Time Insights for Sestu
- The overall average booking lead time for vacation rentals in Sestu is 47 days.
- Guests book furthest in advance for stays during August (average 80 days), likely coinciding with peak travel demand or local events.
- The shortest booking windows occur for stays in March (average 0 days), indicating more last-minute travel plans during this time.
- Seasonally, Summer (65 days avg.) sees the longest lead times, while Winter (20 days avg.) has the shortest, reflecting typical travel planning cycles.
Recommendations for Hosts
- Use the overall average lead time (47 days) as a baseline for your pricing and availability strategy in Sestu.
- For August stays, consider implementing length-of-stay discounts or slightly higher rates for bookings made less than 80 days out to capitalize on advance planning.
- During March, focus on last-minute booking availability and promotions, as guests book with very short notice (0 days avg.).
- Target marketing efforts for the Summer season well in advance (at least 65 days) to capture early planners.
- Monitor your own booking lead times against these Sestu averages to identify opportunities for dynamic pricing adjustments.
Popular & Essential Airbnb Amenities in Sestu (2025)
Amenity Prevalence
Amenity Insights for Sestu
- Essential amenities in Sestu that guests expect include: Kitchen, Hair dryer, Heating, Hot water, Essentials, TV. Lacking these (any) could significantly impact bookings.
- Popular amenities like Air conditioning, Wifi, Washer are common but not universal. Offering these can provide a competitive edge.
- Warning: Wifi is not universally provided but is considered essential globally. Ensure reliable Wifi is offered.
Recommendations for Hosts
- Ensure your listing includes all essential amenities for Sestu: Kitchen, Hair dryer, Heating, Hot water, Essentials, TV.
- Prioritize adding missing essentials: Heating, Hot water, Essentials, TV.
- Consider adding popular differentiators like Air conditioning or Wifi to increase appeal.
- Highlight unique or less common amenities you offer (e.g., hot tub, dedicated workspace, EV charger) in your listing description and photos.
- Regularly check competitor amenities in Sestu to stay competitive.
Sestu Airbnb Guest Demographics & Profile Analysis (2025)
Guest Profile Summary for Sestu
- The typical guest profile for Airbnb in Sestu consists of predominantly international visitors (82%), with top international origins including Italy, typically belonging to the Post-2000s (Gen Z/Alpha) group (50%), primarily speaking English or French.
- Domestic travelers account for 17.9% of guests.
- Key international markets include France (42.9%) and Italy (17.9%).
- Top languages spoken are English (34.3%) followed by French (18.1%).
- A significant demographic segment is the Post-2000s (Gen Z/Alpha) group, representing 50% of guests.
Recommendations for Hosts
- Focus marketing internationally, particularly towards travelers from Italy.
- Tailor amenities and listing descriptions to appeal to the dominant Post-2000s (Gen Z/Alpha) demographic (e.g., highlight fast WiFi, smart home features, local guides).
- Highlight unique local experiences or amenities relevant to the primary guest profile.
- Consider seasonal promotions aligned with peak travel times for key origin markets.
Nearby Short-Term Rental Market Comparison
How does the Sestu Airbnb market stack up against its neighbors? Compare key performance metrics like average monthly revenue, ADR, and occupancy rates in surrounding areas to understand the broader regional STR landscape.
| Market | Active Properties | Monthly Revenue | Daily Rate | Avg. Occupancy |
|---|---|---|---|---|
| Maracalagonis | 285 | $2,096 | $302.75 | 46% |
| Sarrocu/Sarroch | 92 | $1,796 | $228.04 | 43% |
| Castiadas | 185 | $1,705 | $225.34 | 46% |
| Figari/Golfo Aranci | 395 | $1,645 | $247.08 | 46% |
| Santu Diadòru/San Teodoro | 924 | $1,550 | $251.11 | 45% |
| Olbia | 1,988 | $1,402 | $209.04 | 44% |
| Sìnnia/Sinnai | 184 | $1,383 | $194.38 | 42% |
| Loiri-Poltu Santu Paolu/Loiri Porto San Paolo | 409 | $1,382 | $204.76 | 46% |
| Crabonaxa/Villasimius | 858 | $1,327 | $218.91 | 44% |
| Domus De Maria | 306 | $1,316 | $193.99 | 45% |