Sòssu/Sorso Airbnb Market Analysis 2025: Short Term Rental Data & Vacation Rental Statistics in Sardinia, Italy
Is Airbnb profitable in Sòssu/Sorso in 2025? Explore comprehensive Airbnb analytics for Sòssu/Sorso, Sardinia, Italy to uncover income potential. This 2025 STR market report for Sòssu/Sorso, based on AirROI data from April 2024 to March 2025, reveals key trends in the niche market of 175 active listings.
Whether you're considering an Airbnb investment in Sòssu/Sorso, optimizing your existing vacation rental, or exploring rental arbitrage opportunities, understanding the Sòssu/Sorso Airbnb data is crucial. Navigating the high regulation landscape is key to maximizing your short term rental income potential. Let's dive into the specifics.
Key Sòssu/Sorso Airbnb Performance Metrics Overview
Monthly Airbnb Revenue Variations & Income Potential in Sòssu/Sorso (2025)
Understanding the monthly revenue variations for Airbnb listings in Sòssu/Sorso is key to maximizing your short term rental income potential. Seasonality significantly impacts earnings. Our analysis, based on data from the past 12 months, shows that the peak revenue month for STRs in Sòssu/Sorso is typically August, while February often presents the lowest earnings, highlighting opportunities for strategic pricing adjustments during shoulder and low seasons. Explore the typical Airbnb income in Sòssu/Sorso across different performance tiers:
- Best-in-class properties (Top 10%) achieve $3,225+ monthly, often utilizing dynamic pricing and superior guest experiences.
- Strong performing properties (Top 25%) earn $1,789 or more, indicating effective management and desirable locations/amenities.
- Typical properties (Median) generate around $971 per month, representing the average market performance.
- Entry-level properties (Bottom 25%) see earnings around $434, often with potential for optimization.
Average Monthly Airbnb Earnings Trend in Sòssu/Sorso
Sòssu/Sorso Airbnb Occupancy Rate Trends (2025)
Maximize your bookings by understanding the Sòssu/Sorso STR occupancy trends. Seasonal demand shifts significantly influence how often properties are booked. Typically, Augustsees the highest demand (peak season occupancy), while March experiences the lowest (low season). Effective strategies, like adjusting minimum stays or offering promotions, can boost occupancy during slower periods. Here's how different property tiers perform in Sòssu/Sorso:
- Best-in-class properties (Top 10%) achieve 67%+ occupancy, indicating high desirability and potentially optimized availability.
- Strong performing properties (Top 25%) maintain 47% or higher occupancy, suggesting good market fit and guest satisfaction.
- Typical properties (Median) have an occupancy rate around 28%.
- Entry-level properties (Bottom 25%) average 11% occupancy, potentially facing higher vacancy.
Average Monthly Occupancy Rate Trend in Sòssu/Sorso
Average Daily Rate (ADR) Airbnb Trends in Sòssu/Sorso (2025)
Effective short term rental pricing strategy in Sòssu/Sorso involves understanding monthly ADR fluctuations. The Average Daily Rate (ADR) for Airbnb in Sòssu/Sorso typically peaks in August and dips lowest during October. Leveraging Airbnb dynamic pricing tools or strategies based on this seasonality can significantly boost revenue. Here's a look at the typical nightly rates achieved:
- Best-in-class properties (Top 10%) command rates of $252+ per night, often due to premium features or locations.
- Strong performing properties (Top 25%) achieve nightly rates of $149 or more.
- Typical properties (Median) charge around $105 per night.
- Entry-level properties (Bottom 25%) earn around $81 per night.
Average Daily Rate (ADR) Trend by Month in Sòssu/Sorso
Get Live Sòssu/Sorso Market Intelligence 👇

Explore Real-time Analytics
Airbnb Seasonality Analysis & Trends in Sòssu/Sorso (2025)
Peak Season (August, July, June)
- Revenue averages $2,812 per month
- Occupancy rates average 46.7%
- Daily rates average $149
Shoulder Season
- Revenue averages $1,405 per month
- Occupancy maintains around 28.3%
- Daily rates hold near $138
Low Season (January, February, December)
- Revenue drops to average $746 per month
- Occupancy decreases to average 23.2%
- Daily rates adjust to average $137
Seasonality Insights for Sòssu/Sorso
- The Airbnb seasonality in Sòssu/Sorso shows highly seasonal trends requiring careful strategy. While the sections above show seasonal averages, it's also insightful to look at the extremes:
- During the high season, the absolute peak month showcases Sòssu/Sorso's highest earning potential, with monthly revenues capable of climbing to $3,176, occupancy reaching a high of 60.0%, and ADRs peaking at $152.
- Conversely, the slowest single month of the year, typically falling within the low season, marks the market's lowest point. In this month, revenue might dip to $711, occupancy could drop to 17.7%, and ADRs may adjust down to $134.
- Understanding both the seasonal averages and these monthly peaks and troughs in revenue, occupancy, and ADR is crucial for maximizing your Airbnb profit potential in Sòssu/Sorso.
Seasonal Strategies for Maximizing Profit
- Peak Season: Maximize revenue through premium pricing and potentially longer minimum stays. Ensure high availability.
- Low Season: Offer competitive pricing, special promotions (e.g., extended stay discounts), and flexible cancellation policies. Target off-season travelers like remote workers or budget-conscious guests.
- Shoulder Seasons: Implement dynamic pricing that balances peak and low rates. Target weekend travelers or specific events. Offer slightly more flexible terms than peak season.
- Regularly analyze your own performance against these Sòssu/Sorso seasonality benchmarks and adjust your pricing and availability strategy accordingly.
Best Areas for Airbnb Investment in Sòssu/Sorso (2025)
Exploring the top neighborhoods for short-term rentals in Sòssu/Sorso? This section highlights key areas, outlining why they are attractive for hosts and guests, along with notable local attractions. Consider these locations based on your target guest profile and investment strategy.
| Neighborhood / Area | Why Host Here? (Target Guests & Appeal) | Key Attractions & Landmarks |
|---|---|---|
| La Pelosa | Famous for its stunning beach with crystal clear waters and white sand, La Pelosa is a prime destination for tourists seeking sun and relaxation. The picturesque scenery makes it a popular choice for beach lovers. | La Pelosa Beach, Stintino, Asinara National Park, Spiaggia delle Tonnare, Parco Nazionale dell'Asinara |
| Castelsardo | A charming medieval town perched on a hill overlooking the sea, Castelsardo offers a unique historical experience along with beautiful views. It's a perfect spot for cultural tourism and local events. | Castles of Castelsardo, Museo dell'Intreccio Mediterraneo, Tonnara di Porto Torres, Cattedrale di Sant'Antonio Abate, Old Town |
| Alghero | Known for its Catalan influences and beautiful coastal scenery, Alghero attracts a mix of international tourists and locals looking for nightlife and cultural experiences. The lively old town is filled with restaurants and shops. | Alghero Old Town, Neptune's Grotto, Maria Pia Beach, Alghero Cathedral, Fortifications |
| Sassari | The second-largest city in Sardinia, Sassari is an urban center with rich culture, historical significance, and close proximity to natural beauty. It attracts visitors interested in art, history, and local cuisine. | Palazzo Ducale, Sassari Cathedral, Museo Nazionale Giovanni Antonio Sanna, Corso Vittorio Emanuele, Tritone Fountain |
| Olbia | A major gateway to the Costa Smeralda, Olbia is well-connected and offers vibrant nightlife as well as beautiful beaches. It's ideal for visitors looking for a mix of relaxation and access to luxury resorts. | Porto Rotondo, Liscia Ruja Beach, San Simplicio Church, Ruin of Nuraghe Riu Mulinu, Civico Museo Archeologico |
| San Teodoro | Famous for its stunning beaches and laid-back atmosphere, San Teodoro is a favorite among families and young travelers looking for sun and fun in a vibrant beach town setting. | La Cinta Beach, San Teodoro Beach, L'Isuledda, Capo Coda Cavallo, Puntaldia |
| Cagliari | The capital of Sardinia, Cagliari is rich in history, culture, and offers stunning coastlines. It's perfect for tourists looking for urban experiences combined with beautiful landscapes. | Bastione di Saint Remy, Poetto Beach, Roman Amphitheatre, Castello district, Museo Archeologico |
| Villasimius | Known for its pristine beaches and turquoise waters, Villasimius is a popular destination for visitors seeking luxury and relaxation. Ideal for travelers wanting a seaside retreat with luxury amenities. | Simius Beach, Porto Giunco, Capo Carbonara, Spiaggia del Riso, Marine Protected Area |
Understanding Airbnb License Requirements & STR Laws in Sòssu/Sorso (2025)
Yes, Sòssu/Sorso, Sardinia, Italy enforces high STR regulations. Obtaining a license and ensuring compliance is almost certainly required according to current 2025 STR laws. Always verify the latest short term rental regulations and Airbnb license requirements directly with local government authorities for Sòssu/Sorso to ensure full compliance before hosting.
(Source: AirROI data, 2025, based on 38% licensed listings)
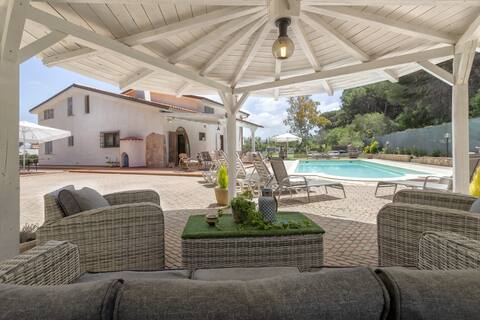
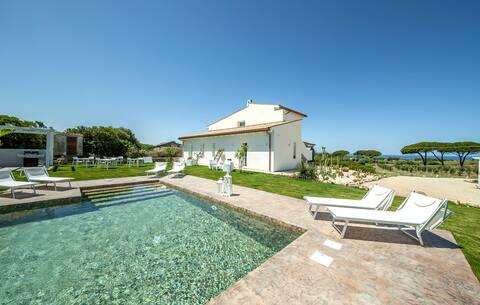
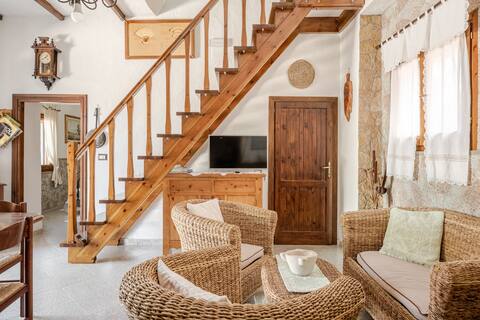
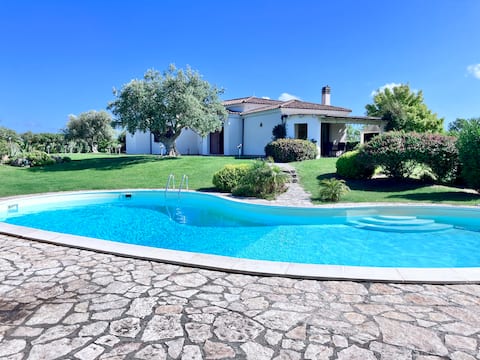
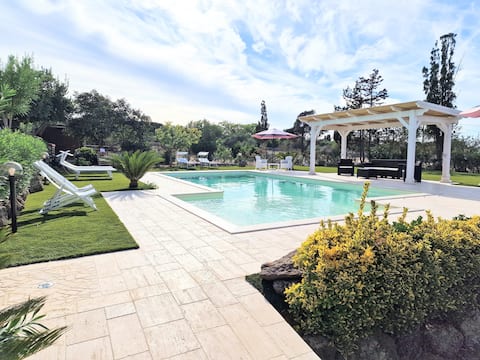
Top Performing Airbnb Properties in Sòssu/Sorso (2025)
Benchmark your potential! Explore examples of top-performing Airbnb properties in Sòssu/Sorsobased on Trailing Twelve Month (TTM) revenue. Analyze their characteristics, revenue, occupancy rate, and ADR to understand what drives success in this market.
Villa Matian with heated pool
Entire Place • 4 bedrooms
Bellimpiazza, private seaview villa with pool
Entire Place • 4 bedrooms
Antico Casolare-inter house 11 people
Entire Place • 5 bedrooms
Countryside Villa with private pool and sea view
Entire Place • 3 bedrooms

Casa da Carlo, 3 double rooms with pool
Entire Place • 3 bedrooms
Villa 11 pers. in the green-mare 2000 m
Entire Place • 5 bedrooms
Note: Performance varies based on location, size, amenities, seasonality, and management quality. Data reflects the past 12 months.
Top Performing Airbnb Hosts in Sòssu/Sorso (2025)
Learn from the best! This table showcases top-performing Airbnb hosts in Sòssu/Sorso based on the number of properties managed and estimated total revenue over the past year. Analyze their scale and performance metrics.
| Host Name | Properties | Grossing Revenue | Stay Reviews | Avg Rating |
|---|---|---|---|---|
| Holidu | 1 | $224,545 | 3 | 5.00/5.0 |
| Mario | 3 | $145,428 | 38 | 4.86/5.0 |
| Michele | 1 | $108,266 | 38 | 4.97/5.0 |
| Paolo | 3 | $65,476 | 45 | 4.97/5.0 |
| Co-Host Sardegna | 3 | $58,838 | 22 | 4.41/5.0 |
| Norman | 1 | $54,555 | 17 | 5.00/5.0 |
| Donna | 2 | $50,407 | 19 | 4.46/5.0 |
| Carlo | 1 | $42,898 | 13 | 5.00/5.0 |
| Valentina | 2 | $38,680 | 49 | 4.96/5.0 |
| Tina | 1 | $35,532 | 30 | 4.77/5.0 |
Analyzing the strategies of top hosts, such as their property selection, pricing, and guest communication, can offer valuable lessons for optimizing your own Airbnb operations in Sòssu/Sorso.
Dive Deeper: Advanced Sòssu/Sorso STR Market Data (2025)
Ready to unlock more insights? AirROI provides access to advanced metrics and comprehensive Airbnb data for Sòssu/Sorso. Explore detailed analytics beyond this report to refine your investment strategy, optimize pricing, and maximize your vacation rental profits.
Explore Advanced MetricsSòssu/Sorso Short-Term Rental Market Composition (2025): Property & Room Types
Room Type Distribution
Property Type Distribution
Market Composition Insights for Sòssu/Sorso
- The Sòssu/Sorso Airbnb market composition is heavily skewed towards Entire Home/Apt listings, which make up 89.1% of the 175 active rentals. This indicates strong guest preference for privacy and space.
- Looking at the property type distribution in Sòssu/Sorso, House properties are the most common (53.1%), reflecting the local real estate landscape.
- Houses represent a significant 53.1% portion, catering likely to families or larger groups.
- The presence of 8.6% Hotel/Boutique listings indicates integration with traditional hospitality.
- Smaller segments like unique stays, others (combined 1.2%) offer potential for unique stay experiences.
Sòssu/Sorso Airbnb Room Capacity Analysis (2025): Bedroom Distribution
Distribution of Listings by Number of Bedrooms
Room Capacity Insights for Sòssu/Sorso
- The dominant room capacity in Sòssu/Sorso is 2 bedrooms listings, making up 42.3% of the market. This suggests a strong demand for properties suitable for couples or solo travelers.
- Together, 2 bedrooms and 1 bedroom properties represent 71.4% of the active Airbnb listings in Sòssu/Sorso, indicating a high concentration in these sizes.
- A significant 23.4% of listings offer 3+ bedrooms, catering to larger groups and families seeking more space in Sòssu/Sorso.
Sòssu/Sorso Vacation Rental Guest Capacity Trends (2025)
Distribution of Listings by Guest Capacity
Guest Capacity Insights for Sòssu/Sorso
- The most common guest capacity trend in Sòssu/Sorso vacation rentals is listings accommodating 4 guests (32.6%). This suggests the primary traveler segment is likely small families or groups.
- Properties designed for 4 guests and 5 guests dominate the Sòssu/Sorso STR market, accounting for 49.2% of listings.
- 30.2% of properties accommodate 6+ guests, serving the market segment for larger families or group travel in Sòssu/Sorso.
- On average, properties in Sòssu/Sorso are equipped to host 4.6 guests.
Sòssu/Sorso Airbnb Booking Patterns (2025): Available vs. Booked Days
Available Days Distribution
Booked Days Distribution
Booking Pattern Insights for Sòssu/Sorso
- The most common availability pattern in Sòssu/Sorso falls within the 271-366 days range, representing 70.9% of listings. This suggests many properties have significant open periods on their calendars.
- Approximately 97.2% of listings show high availability (181+ days open annually), indicating potential for increased bookings or specific owner usage patterns.
- For booked days, the 31-90 days range is most frequent in Sòssu/Sorso (45.7%), reflecting common guest stay durations or potential owner blocking patterns.
- A notable 3.4% of properties secure long booking periods (181+ days booked per year), highlighting successful long-term rental strategies or significant owner usage.
Sòssu/Sorso Airbnb Minimum Stay Requirements Analysis
Distribution of Listings by Minimum Night Requirement
1 Night
32 listings
20.4% of total
2 Nights
13 listings
8.3% of total
3 Nights
17 listings
10.8% of total
4-6 Nights
37 listings
23.6% of total
7-29 Nights
45 listings
28.7% of total
30+ Nights
13 listings
8.3% of total
Key Insights
- The most prevalent minimum stay requirement in Sòssu/Sorso is 7-29 Nights, adopted by 28.7% of listings. This highlights the market's preference for shorter, flexible bookings.
Recommendations
- Align with the market by considering a 7-29 Nights minimum stay, as 28.7% of Sòssu/Sorso hosts use this setting.
- If feasible, allowing 1-night stays, especially midweek or during low season, could capture last-minute bookings, as only 20.4% currently do.
- Explore offering discounts for stays of 30+ nights to attract the 8.3% of the market seeking extended stays.
- Adjust minimum nights based on seasonality – potentially shorter during low season and longer during peak demand periods in Sòssu/Sorso.
Sòssu/Sorso Airbnb Cancellation Policy Trends Analysis (2025)
Super Strict 60 Days
6 listings
4.5% of total
Super Strict 30 Days
4 listings
3% of total
Flexible
26 listings
19.5% of total
Moderate
59 listings
44.4% of total
Strict
38 listings
28.6% of total
Cancellation Policy Insights for Sòssu/Sorso
- The prevailing Airbnb cancellation policy trend in Sòssu/Sorso is Moderate, used by 44.4% of listings.
- There's a relatively balanced mix between guest-friendly (63.9%) and stricter (28.6%) policies, offering choices for different guest needs.
Recommendations for Hosts
- Consider adopting a Moderate policy to align with the 44.4% market standard in Sòssu/Sorso.
- Regularly review your cancellation policy against competitors and market demand shifts in Sòssu/Sorso.
Sòssu/Sorso STR Booking Lead Time Analysis (2025)
Average Booking Lead Time by Month
Booking Lead Time Insights for Sòssu/Sorso
- The overall average booking lead time for vacation rentals in Sòssu/Sorso is 60 days.
- Guests book furthest in advance for stays during July (average 96 days), likely coinciding with peak travel demand or local events.
- The shortest booking windows occur for stays in February (average 15 days), indicating more last-minute travel plans during this time.
- Seasonally, Summer (82 days avg.) sees the longest lead times, while Winter (44 days avg.) has the shortest, reflecting typical travel planning cycles.
Recommendations for Hosts
- Use the overall average lead time (60 days) as a baseline for your pricing and availability strategy in Sòssu/Sorso.
- For July stays, consider implementing length-of-stay discounts or slightly higher rates for bookings made less than 96 days out to capitalize on advance planning.
- Target marketing efforts for the Summer season well in advance (at least 82 days) to capture early planners.
- Monitor your own booking lead times against these Sòssu/Sorso averages to identify opportunities for dynamic pricing adjustments.
Popular & Essential Airbnb Amenities in Sòssu/Sorso (2025)
Amenity Prevalence
Amenity Insights for Sòssu/Sorso
- Popular amenities like Kitchen, TV, Hot water are common but not universal. Offering these can provide a competitive edge.
- Warning: Wifi is not universally provided but is considered essential globally. Ensure reliable Wifi is offered.
Recommendations for Hosts
- Consider adding popular differentiators like Kitchen or TV to increase appeal.
- Highlight unique or less common amenities you offer (e.g., hot tub, dedicated workspace, EV charger) in your listing description and photos.
- Regularly check competitor amenities in Sòssu/Sorso to stay competitive.
Sòssu/Sorso Airbnb Guest Demographics & Profile Analysis (2025)
Guest Profile Summary for Sòssu/Sorso
- The typical guest profile for Airbnb in Sòssu/Sorso consists of predominantly international visitors (81%), with top international origins including Italy, typically belonging to the Post-2000s (Gen Z/Alpha) group (50%), primarily speaking English or French.
- Domestic travelers account for 18.6% of guests.
- Key international markets include France (30.4%) and Italy (18.6%).
- Top languages spoken are English (34.6%) followed by French (16.6%).
- A significant demographic segment is the Post-2000s (Gen Z/Alpha) group, representing 50% of guests.
Recommendations for Hosts
- Focus marketing internationally, particularly towards travelers from Italy.
- Tailor amenities and listing descriptions to appeal to the dominant Post-2000s (Gen Z/Alpha) demographic (e.g., highlight fast WiFi, smart home features, local guides).
- Highlight unique local experiences or amenities relevant to the primary guest profile.
- Consider seasonal promotions aligned with peak travel times for key origin markets.
Nearby Short-Term Rental Market Comparison
How does the Sòssu/Sorso Airbnb market stack up against its neighbors? Compare key performance metrics like average monthly revenue, ADR, and occupancy rates in surrounding areas to understand the broader regional STR landscape.
| Market | Active Properties | Monthly Revenue | Daily Rate | Avg. Occupancy |
|---|---|---|---|---|
| Porto Cervo | 211 | $2,819 | $463.39 | 42% |
| Poltu Quatu | 58 | $2,272 | $314.25 | 47% |
| Maracalagonis | 285 | $2,096 | $302.75 | 46% |
| Alzachèna/Arzachena | 391 | $2,005 | $387.72 | 42% |
| Zonza | 709 | $1,922 | $294.10 | 44% |
| Pietrosella | 239 | $1,911 | $258.65 | 45% |
| Figari | 213 | $1,890 | $191.79 | 50% |
| Bonifacio / Bunifaziu | 499 | $1,866 | $216.08 | 49% |
| Porto-Vecchio | 1,908 | $1,814 | $220.84 | 48% |
| Sarrocu/Sarroch | 92 | $1,796 | $228.04 | 43% |