Masainas Airbnb Market Analysis 2025: Short Term Rental Data & Vacation Rental Statistics in Sardinia, Italy
Is Airbnb profitable in Masainas in 2025? Explore comprehensive Airbnb analytics for Masainas, Sardinia, Italy to uncover income potential. This 2025 STR market report for Masainas, based on AirROI data from April 2024 to March 2025, reveals key trends in the niche market of 24 active listings.
Whether you're considering an Airbnb investment in Masainas, optimizing your existing vacation rental, or exploring rental arbitrage opportunities, understanding the Masainas Airbnb data is crucial. Navigating the high regulation landscape is key to maximizing your short term rental income potential. Let's dive into the specifics.
Key Masainas Airbnb Performance Metrics Overview
Monthly Airbnb Revenue Variations & Income Potential in Masainas (2025)
Understanding the monthly revenue variations for Airbnb listings in Masainas is key to maximizing your short term rental income potential. Seasonality significantly impacts earnings. Our analysis, based on data from the past 12 months, shows that the peak revenue month for STRs in Masainas is typically August, while January often presents the lowest earnings, highlighting opportunities for strategic pricing adjustments during shoulder and low seasons. Explore the typical Airbnb income in Masainas across different performance tiers:
- Best-in-class properties (Top 10%) achieve $2,551+ monthly, often utilizing dynamic pricing and superior guest experiences.
- Strong performing properties (Top 25%) earn $1,606 or more, indicating effective management and desirable locations/amenities.
- Typical properties (Median) generate around $933 per month, representing the average market performance.
- Entry-level properties (Bottom 25%) see earnings around $492, often with potential for optimization.
Average Monthly Airbnb Earnings Trend in Masainas
Masainas Airbnb Occupancy Rate Trends (2025)
Maximize your bookings by understanding the Masainas STR occupancy trends. Seasonal demand shifts significantly influence how often properties are booked. Typically, Augustsees the highest demand (peak season occupancy), while November experiences the lowest (low season). Effective strategies, like adjusting minimum stays or offering promotions, can boost occupancy during slower periods. Here's how different property tiers perform in Masainas:
- Best-in-class properties (Top 10%) achieve 58%+ occupancy, indicating high desirability and potentially optimized availability.
- Strong performing properties (Top 25%) maintain 50% or higher occupancy, suggesting good market fit and guest satisfaction.
- Typical properties (Median) have an occupancy rate around 36%.
- Entry-level properties (Bottom 25%) average 15% occupancy, potentially facing higher vacancy.
Average Monthly Occupancy Rate Trend in Masainas
Average Daily Rate (ADR) Airbnb Trends in Masainas (2025)
Effective short term rental pricing strategy in Masainas involves understanding monthly ADR fluctuations. The Average Daily Rate (ADR) for Airbnb in Masainas typically peaks in August and dips lowest during February. Leveraging Airbnb dynamic pricing tools or strategies based on this seasonality can significantly boost revenue. Here's a look at the typical nightly rates achieved:
- Best-in-class properties (Top 10%) command rates of $229+ per night, often due to premium features or locations.
- Strong performing properties (Top 25%) achieve nightly rates of $129 or more.
- Typical properties (Median) charge around $87 per night.
- Entry-level properties (Bottom 25%) earn around $65 per night.
Average Daily Rate (ADR) Trend by Month in Masainas
Get Live Masainas Market Intelligence 👇

Explore Real-time Analytics
Airbnb Seasonality Analysis & Trends in Masainas (2025)
Peak Season (August, September, July)
- Revenue averages $2,068 per month
- Occupancy rates average 57.6%
- Daily rates average $140
Shoulder Season
- Revenue averages $1,054 per month
- Occupancy maintains around 30.6%
- Daily rates hold near $129
Low Season (January, February, December)
- Revenue drops to average $347 per month
- Occupancy decreases to average 10.7%
- Daily rates adjust to average $122
Seasonality Insights for Masainas
- The Airbnb seasonality in Masainas shows highly seasonal trends requiring careful strategy. While the sections above show seasonal averages, it's also insightful to look at the extremes:
- During the high season, the absolute peak month showcases Masainas's highest earning potential, with monthly revenues capable of climbing to $2,747, occupancy reaching a high of 62.9%, and ADRs peaking at $144.
- Conversely, the slowest single month of the year, typically falling within the low season, marks the market's lowest point. In this month, revenue might dip to $0, occupancy could drop to 0.0%, and ADRs may adjust down to $117.
- Understanding both the seasonal averages and these monthly peaks and troughs in revenue, occupancy, and ADR is crucial for maximizing your Airbnb profit potential in Masainas.
Seasonal Strategies for Maximizing Profit
- Peak Season: Maximize revenue through premium pricing and potentially longer minimum stays. Ensure high availability.
- Low Season: Offer competitive pricing, special promotions (e.g., extended stay discounts), and flexible cancellation policies. Target off-season travelers like remote workers or budget-conscious guests.
- Shoulder Seasons: Implement dynamic pricing that balances peak and low rates. Target weekend travelers or specific events. Offer slightly more flexible terms than peak season.
- Regularly analyze your own performance against these Masainas seasonality benchmarks and adjust your pricing and availability strategy accordingly.
Best Areas for Airbnb Investment in Masainas (2025)
Exploring the top neighborhoods for short-term rentals in Masainas? This section highlights key areas, outlining why they are attractive for hosts and guests, along with notable local attractions. Consider these locations based on your target guest profile and investment strategy.
| Neighborhood / Area | Why Host Here? (Target Guests & Appeal) | Key Attractions & Landmarks |
|---|---|---|
| Porto Pino | A stunning beach destination known for its crystal-clear waters and sandy shores. Attracts families and beach lovers looking for relaxation and natural beauty. | Porto Pino Beach, Sand Dunes of Porto Pino, Local seafood restaurants, Water sports activities, Nature walks |
| Sant'Antioco | An island town with rich history and charming streets. It's popular for its cultural sites, local shops, and proximity to beautiful beaches. | Museo del Bisso, Isola di Sant'Antioco, Local artisan shops, Ancient ruins, Beaches near the town |
| Calasetta | A picturesque seaside town that offers stunning views and a relaxed atmosphere. Known for its inviting beaches and vibrant local culture. | Calasetta Beach, Bajdda Beach, Harbor views, Local festivals, Seafood markets |
| Teulada | A quaint village surrounded by beautiful landscapes. Ideal for those looking for tranquility and nature while still close to the coast. | Teulada Beach, Natural parks, Local vineyards, Cultural festivals, Walking trails |
| Carbonia | A historical town with interesting architecture and mining heritage. Attracts those interested in history and local culture. | Museo del Carbone, Mining heritage sites, Historic buildings, Local markets, Walking tours |
| Iglesias | Known for its medieval architecture and stunning natural landscapes. It's a popular base for exploring the surrounding mountains and coastline. | Iglesias Cathedral, Hiking in national parks, Mining history, Charming old town, Local restaurants |
| Nora | An ancient archaeological site located by the sea. Perfect for history buffs and beachgoers alike, merging culture with leisure. | Nora archaeological site, Beautiful beaches, Seafood restaurants, Water activities, Stunning coastal views |
| Pirri | A suburb of Cagliari with local charm and accessibility to the city. It's growing in popularity due to its proximity to major attractions. | Local parks, Cagliari accessibility, Shopping districts, Cultural sites in nearby Cagliari, Family-friendly activities |
Understanding Airbnb License Requirements & STR Laws in Masainas (2025)
Yes, Masainas, Sardinia, Italy enforces high STR regulations. Obtaining a license and ensuring compliance is almost certainly required according to current 2025 STR laws. Always verify the latest short term rental regulations and Airbnb license requirements directly with local government authorities for Masainas to ensure full compliance before hosting.
(Source: AirROI data, 2025, based on 54% licensed listings)
Top Performing Airbnb Properties in Masainas (2025)
Benchmark your potential! Explore examples of top-performing Airbnb properties in Masainasbased on Trailing Twelve Month (TTM) revenue. Analyze their characteristics, revenue, occupancy rate, and ADR to understand what drives success in this market.
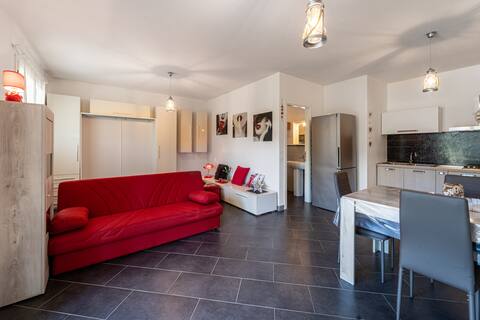
Open Space nel Sulcis
Entire Place • 1 bedroom

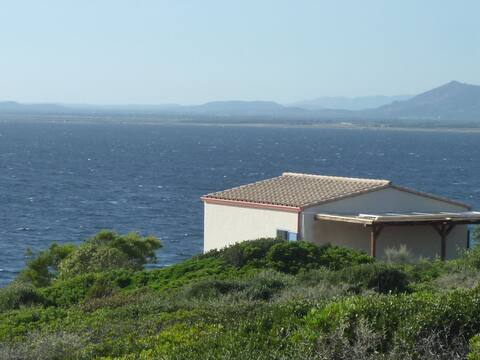
Villa belvedere: house with sea view
Entire Place • 3 bedrooms
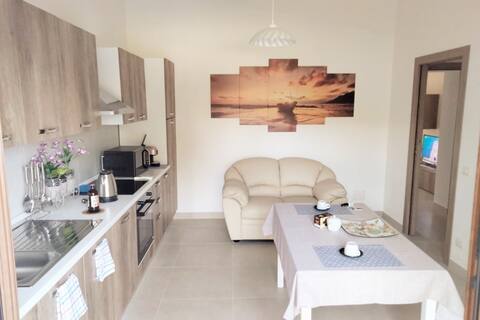
☀ISOLINA☀ cottage on the sea
Entire Place • N/A
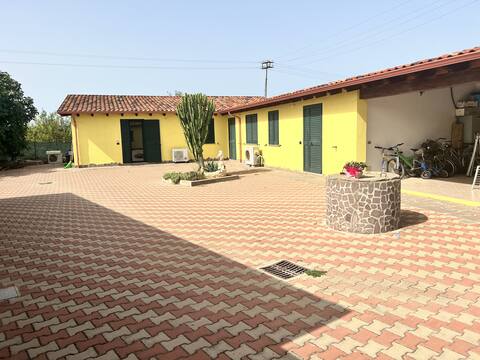
Casa Masain
Entire Place • 2 bedrooms
Residence Sulcis 2
Entire Place • 1 bedroom

Casa Nella
Entire Place • 2 bedrooms
Note: Performance varies based on location, size, amenities, seasonality, and management quality. Data reflects the past 12 months.
Top Performing Airbnb Hosts in Masainas (2025)
Learn from the best! This table showcases top-performing Airbnb hosts in Masainas based on the number of properties managed and estimated total revenue over the past year. Analyze their scale and performance metrics.
| Host Name | Properties | Grossing Revenue | Stay Reviews | Avg Rating |
|---|---|---|---|---|
| Host #469210865 | 1 | $21,645 | 0 | 0.00/5.0 |
| Michele | 2 | $20,494 | 74 | 4.87/5.0 |
| Marco | 1 | $17,352 | 7 | 5.00/5.0 |
| Graziano | 2 | $16,679 | 13 | 5.00/5.0 |
| Paola | 1 | $15,202 | 82 | 4.91/5.0 |
| Host #469063834 | 1 | $12,574 | 0 | 0.00/5.0 |
| Sebastianella | 1 | $11,717 | 8 | 5.00/5.0 |
| Host #153084049 | 1 | $10,870 | 0 | 0.00/5.0 |
| Rossella | 1 | $10,121 | 8 | 5.00/5.0 |
| Ester | 1 | $7,973 | 34 | 4.59/5.0 |
Analyzing the strategies of top hosts, such as their property selection, pricing, and guest communication, can offer valuable lessons for optimizing your own Airbnb operations in Masainas.
Dive Deeper: Advanced Masainas STR Market Data (2025)
Ready to unlock more insights? AirROI provides access to advanced metrics and comprehensive Airbnb data for Masainas. Explore detailed analytics beyond this report to refine your investment strategy, optimize pricing, and maximize your vacation rental profits.
Explore Advanced MetricsMasainas Short-Term Rental Market Composition (2025): Property & Room Types
Room Type Distribution
Property Type Distribution
Market Composition Insights for Masainas
- The Masainas Airbnb market composition is heavily skewed towards Entire Home/Apt listings, which make up 95.8% of the 24 active rentals. This indicates strong guest preference for privacy and space.
- Looking at the property type distribution in Masainas, House properties are the most common (66.7%), reflecting the local real estate landscape.
- Houses represent a significant 66.7% portion, catering likely to families or larger groups.
- Smaller segments like hotel/boutique (combined 4.2%) offer potential for unique stay experiences.
Masainas Airbnb Room Capacity Analysis (2025): Bedroom Distribution
Distribution of Listings by Number of Bedrooms
Room Capacity Insights for Masainas
- The dominant room capacity in Masainas is 2 bedrooms listings, making up 45.8% of the market. This suggests a strong demand for properties suitable for couples or solo travelers.
- Together, 2 bedrooms and 1 bedroom properties represent 87.5% of the active Airbnb listings in Masainas, indicating a high concentration in these sizes.
- Listings with 3+ bedrooms (4.2%) represent a smaller niche, potentially indicating an underserved market for larger group accommodations in Masainas.
Masainas Vacation Rental Guest Capacity Trends (2025)
Distribution of Listings by Guest Capacity
Guest Capacity Insights for Masainas
- The most common guest capacity trend in Masainas vacation rentals is listings accommodating 4 guests (45.8%). This suggests the primary traveler segment is likely small families or groups.
- Properties designed for 4 guests and 6 guests dominate the Masainas STR market, accounting for 58.3% of listings.
- 16.7% of properties accommodate 6+ guests, serving the market segment for larger families or group travel in Masainas.
- On average, properties in Masainas are equipped to host 4.0 guests.
Masainas Airbnb Booking Patterns (2025): Available vs. Booked Days
Available Days Distribution
Booked Days Distribution
Booking Pattern Insights for Masainas
- The most common availability pattern in Masainas falls within the 271-366 days range, representing 62.5% of listings. This suggests many properties have significant open periods on their calendars.
- Approximately 100.0% of listings show high availability (181+ days open annually), indicating potential for increased bookings or specific owner usage patterns.
- For booked days, the 31-90 days range is most frequent in Masainas (50%), reflecting common guest stay durations or potential owner blocking patterns.
Masainas Airbnb Minimum Stay Requirements Analysis
Distribution of Listings by Minimum Night Requirement
1 Night
4 listings
17.4% of total
2 Nights
2 listings
8.7% of total
3 Nights
6 listings
26.1% of total
4-6 Nights
5 listings
21.7% of total
7-29 Nights
6 listings
26.1% of total
Key Insights
- The most prevalent minimum stay requirement in Masainas is 3 Nights, adopted by 26.1% of listings. This highlights the market's preference for longer commitments.
Recommendations
- Align with the market by considering a 3 Nights minimum stay, as 26.1% of Masainas hosts use this setting.
- If feasible, allowing 1-night stays, especially midweek or during low season, could capture last-minute bookings, as only 17.4% currently do.
- Adjust minimum nights based on seasonality – potentially shorter during low season and longer during peak demand periods in Masainas.
Masainas Airbnb Cancellation Policy Trends Analysis (2025)
Flexible
9 listings
45% of total
Moderate
8 listings
40% of total
Strict
3 listings
15% of total
Cancellation Policy Insights for Masainas
- The prevailing Airbnb cancellation policy trend in Masainas is Flexible, used by 45% of listings.
- The market strongly favors guest-friendly terms, with 85.0% of listings offering Flexible or Moderate policies. This suggests guests in Masainas may expect booking flexibility.
Recommendations for Hosts
- Consider adopting a Flexible policy to align with the 45% market standard in Masainas.
- Regularly review your cancellation policy against competitors and market demand shifts in Masainas.
Masainas STR Booking Lead Time Analysis (2025)
Average Booking Lead Time by Month
Booking Lead Time Insights for Masainas
- The overall average booking lead time for vacation rentals in Masainas is 67 days.
- Guests book furthest in advance for stays during April (average 134 days), likely coinciding with peak travel demand or local events.
- The shortest booking windows occur for stays in February (average 0 days), indicating more last-minute travel plans during this time.
- Seasonally, Summer (90 days avg.) sees the longest lead times, while Winter (8 days avg.) has the shortest, reflecting typical travel planning cycles.
Recommendations for Hosts
- Use the overall average lead time (67 days) as a baseline for your pricing and availability strategy in Masainas.
- For April stays, consider implementing length-of-stay discounts or slightly higher rates for bookings made less than 134 days out to capitalize on advance planning.
- During February, focus on last-minute booking availability and promotions, as guests book with very short notice (0 days avg.).
- Target marketing efforts for the Summer season well in advance (at least 90 days) to capture early planners.
- Monitor your own booking lead times against these Masainas averages to identify opportunities for dynamic pricing adjustments.
Popular & Essential Airbnb Amenities in Masainas (2025)
Amenity Prevalence
Amenity Insights for Masainas
- Essential amenities in Masainas that guests expect include: Hot water, Washer, Essentials, Kitchen, Air conditioning. Lacking these (any) could significantly impact bookings.
- Popular amenities like TV, Refrigerator, Heating are common but not universal. Offering these can provide a competitive edge.
Recommendations for Hosts
- Ensure your listing includes all essential amenities for Masainas: Hot water, Washer, Essentials, Kitchen, Air conditioning.
- Prioritize adding missing essentials: Washer, Essentials, Kitchen, Air conditioning.
- Consider adding popular differentiators like TV or Refrigerator to increase appeal.
- Highlight unique or less common amenities you offer (e.g., hot tub, dedicated workspace, EV charger) in your listing description and photos.
- Regularly check competitor amenities in Masainas to stay competitive.
Masainas Airbnb Guest Demographics & Profile Analysis (2025)
Guest Profile Summary for Masainas
- The typical guest profile for Airbnb in Masainas consists of a mix of domestic (43%) and international guests, with top international origins including France, typically belonging to the Post-2000s (Gen Z/Alpha) group (50%), primarily speaking English or Italian.
- Domestic travelers account for 43.4% of guests.
- Key international markets include Italy (43.4%) and France (21.1%).
- Top languages spoken are English (32.4%) followed by Italian (19.7%).
- A significant demographic segment is the Post-2000s (Gen Z/Alpha) group, representing 50% of guests.
Recommendations for Hosts
- Balance marketing efforts between domestic and international channels based on the guest mix.
- Tailor amenities and listing descriptions to appeal to the dominant Post-2000s (Gen Z/Alpha) demographic (e.g., highlight fast WiFi, smart home features, local guides).
- Highlight unique local experiences or amenities relevant to the primary guest profile.
- Consider seasonal promotions aligned with peak travel times for key origin markets.
Nearby Short-Term Rental Market Comparison
How does the Masainas Airbnb market stack up against its neighbors? Compare key performance metrics like average monthly revenue, ADR, and occupancy rates in surrounding areas to understand the broader regional STR landscape.
| Market | Active Properties | Monthly Revenue | Daily Rate | Avg. Occupancy |
|---|---|---|---|---|
| Maracalagonis | 285 | $2,096 | $302.75 | 46% |
| Sarrocu/Sarroch | 92 | $1,796 | $228.04 | 43% |
| Castiadas | 185 | $1,705 | $225.34 | 46% |
| Figari/Golfo Aranci | 395 | $1,645 | $247.08 | 46% |
| Santu Diadòru/San Teodoro | 924 | $1,550 | $251.11 | 45% |
| Olbia | 1,988 | $1,402 | $209.04 | 44% |
| Sìnnia/Sinnai | 184 | $1,383 | $194.38 | 42% |
| Loiri-Poltu Santu Paolu/Loiri Porto San Paolo | 409 | $1,382 | $204.76 | 46% |
| Crabonaxa/Villasimius | 858 | $1,327 | $218.91 | 44% |
| Domus De Maria | 306 | $1,316 | $193.99 | 45% |