Lungòni/Santa Teresa Gallura Airbnb Market Analysis 2025: Short Term Rental Data & Vacation Rental Statistics in Sardinia, Italy
Is Airbnb profitable in Lungòni/Santa Teresa Gallura in 2025? Explore comprehensive Airbnb analytics for Lungòni/Santa Teresa Gallura, Sardinia, Italy to uncover income potential. This 2025 STR market report for Lungòni/Santa Teresa Gallura, based on AirROI data from April 2024 to March 2025, reveals key trends in the market of 688 active listings.
Whether you're considering an Airbnb investment in Lungòni/Santa Teresa Gallura, optimizing your existing vacation rental, or exploring rental arbitrage opportunities, understanding the Lungòni/Santa Teresa Gallura Airbnb data is crucial. Navigating the high regulation landscape is key to maximizing your short term rental income potential. Let's dive into the specifics.
Key Lungòni/Santa Teresa Gallura Airbnb Performance Metrics Overview
Monthly Airbnb Revenue Variations & Income Potential in Lungòni/Santa Teresa Gallura (2025)
Understanding the monthly revenue variations for Airbnb listings in Lungòni/Santa Teresa Gallura is key to maximizing your short term rental income potential. Seasonality significantly impacts earnings. Our analysis, based on data from the past 12 months, shows that the peak revenue month for STRs in Lungòni/Santa Teresa Gallura is typically August, while February often presents the lowest earnings, highlighting opportunities for strategic pricing adjustments during shoulder and low seasons. Explore the typical Airbnb income in Lungòni/Santa Teresa Gallura across different performance tiers:
- Best-in-class properties (Top 10%) achieve $3,254+ monthly, often utilizing dynamic pricing and superior guest experiences.
- Strong performing properties (Top 25%) earn $2,003 or more, indicating effective management and desirable locations/amenities.
- Typical properties (Median) generate around $1,117 per month, representing the average market performance.
- Entry-level properties (Bottom 25%) see earnings around $557, often with potential for optimization.
Average Monthly Airbnb Earnings Trend in Lungòni/Santa Teresa Gallura
Lungòni/Santa Teresa Gallura Airbnb Occupancy Rate Trends (2025)
Maximize your bookings by understanding the Lungòni/Santa Teresa Gallura STR occupancy trends. Seasonal demand shifts significantly influence how often properties are booked. Typically, Augustsees the highest demand (peak season occupancy), while January experiences the lowest (low season). Effective strategies, like adjusting minimum stays or offering promotions, can boost occupancy during slower periods. Here's how different property tiers perform in Lungòni/Santa Teresa Gallura:
- Best-in-class properties (Top 10%) achieve 65%+ occupancy, indicating high desirability and potentially optimized availability.
- Strong performing properties (Top 25%) maintain 49% or higher occupancy, suggesting good market fit and guest satisfaction.
- Typical properties (Median) have an occupancy rate around 29%.
- Entry-level properties (Bottom 25%) average 13% occupancy, potentially facing higher vacancy.
Average Monthly Occupancy Rate Trend in Lungòni/Santa Teresa Gallura
Average Daily Rate (ADR) Airbnb Trends in Lungòni/Santa Teresa Gallura (2025)
Effective short term rental pricing strategy in Lungòni/Santa Teresa Gallura involves understanding monthly ADR fluctuations. The Average Daily Rate (ADR) for Airbnb in Lungòni/Santa Teresa Gallura typically peaks in August and dips lowest during November. Leveraging Airbnb dynamic pricing tools or strategies based on this seasonality can significantly boost revenue. Here's a look at the typical nightly rates achieved:
- Best-in-class properties (Top 10%) command rates of $259+ per night, often due to premium features or locations.
- Strong performing properties (Top 25%) achieve nightly rates of $165 or more.
- Typical properties (Median) charge around $116 per night.
- Entry-level properties (Bottom 25%) earn around $85 per night.
Average Daily Rate (ADR) Trend by Month in Lungòni/Santa Teresa Gallura
Get Live Lungòni/Santa Teresa Gallura Market Intelligence 👇

Explore Real-time Analytics
Airbnb Seasonality Analysis & Trends in Lungòni/Santa Teresa Gallura (2025)
Peak Season (August, July, June)
- Revenue averages $2,903 per month
- Occupancy rates average 51.2%
- Daily rates average $177
Shoulder Season
- Revenue averages $1,403 per month
- Occupancy maintains around 31.1%
- Daily rates hold near $147
Low Season (January, February, December)
- Revenue drops to average $568 per month
- Occupancy decreases to average 15.7%
- Daily rates adjust to average $136
Seasonality Insights for Lungòni/Santa Teresa Gallura
- The Airbnb seasonality in Lungòni/Santa Teresa Gallura shows highly seasonal trends requiring careful strategy. While the sections above show seasonal averages, it's also insightful to look at the extremes:
- During the high season, the absolute peak month showcases Lungòni/Santa Teresa Gallura's highest earning potential, with monthly revenues capable of climbing to $3,575, occupancy reaching a high of 61.5%, and ADRs peaking at $186.
- Conversely, the slowest single month of the year, typically falling within the low season, marks the market's lowest point. In this month, revenue might dip to $496, occupancy could drop to 15.3%, and ADRs may adjust down to $134.
- Understanding both the seasonal averages and these monthly peaks and troughs in revenue, occupancy, and ADR is crucial for maximizing your Airbnb profit potential in Lungòni/Santa Teresa Gallura.
Seasonal Strategies for Maximizing Profit
- Peak Season: Maximize revenue through premium pricing and potentially longer minimum stays. Ensure high availability.
- Low Season: Offer competitive pricing, special promotions (e.g., extended stay discounts), and flexible cancellation policies. Target off-season travelers like remote workers or budget-conscious guests.
- Shoulder Seasons: Implement dynamic pricing that balances peak and low rates. Target weekend travelers or specific events. Offer slightly more flexible terms than peak season.
- Regularly analyze your own performance against these Lungòni/Santa Teresa Gallura seasonality benchmarks and adjust your pricing and availability strategy accordingly.
Best Areas for Airbnb Investment in Lungòni/Santa Teresa Gallura (2025)
Exploring the top neighborhoods for short-term rentals in Lungòni/Santa Teresa Gallura? This section highlights key areas, outlining why they are attractive for hosts and guests, along with notable local attractions. Consider these locations based on your target guest profile and investment strategy.
| Neighborhood / Area | Why Host Here? (Target Guests & Appeal) | Key Attractions & Landmarks |
|---|---|---|
| Capo Testa | A stunning peninsula known for its unique rock formations and beautiful beaches. Captivating views and a serene atmosphere make it a hotspot for vacationers. | Capo Testa Beach, Rena Bianca Beach, Punta di Capo Testa, Santa Teresa Gallura lighthouse, Hiking trails, Local restaurants |
| Santa Teresa Gallura town | The charming town center provides a mix of local culture, shopping, and dining. It's close to many attractions and offers an authentic Sardinian experience. | Old town streets, Church of Stella Maris, Local markets, Restaurants and bars, Nightlife, Access to nearby beaches |
| Rena Bianca Beach | One of the most popular beaches in the area, known for its white sand and crystal-clear waters. Perfect for families and beach lovers. | Swimming, Sunbathing, Water sports, Scenic walks, Nearby restaurants, Beach bars |
| La Marmorata | A beautiful beach area known for its tranquility and natural beauty. Ideal for those looking for a more laid-back vacation experience. | La Marmorata Beach, Outdoor activities, Scenic views, Relaxing atmosphere, Local dining options, Access to water sports |
| Liscia Ruja | A beautiful beach known for its soft sand and clear water. Popular with families and those seeking a relaxed beach holiday. | Liscia Ruja Beach, Swimming, Snorkeling, Restaurants nearby, Sunset views, Charming beach setting |
| Porto Pollo | Famous for its windsurfing and kitesurfing spots. Attracts adventure travelers and water sports enthusiasts looking for action. | Windsurfing schools, Kitesurfing spots, Beach bars, Restaurants, Outdoor activities, Surf competitions |
| Cala Spinosa | A picturesque cove with stunning views and crystal-clear water. Great for snorkeling and enjoying nature. | Snorkeling spots, Hidden beaches, Scenic viewpoints, Natural beauty, Relaxation areas, Hiking trails |
| Isola dei Gabbiani | A small island known for its stunning beaches and watersports. Perfect for a day trip and water sports enthusiasts. | Beautiful beaches, Windsurfing, Kitesurfing, Local wildlife, Tranquil settings, Nature walks |
Understanding Airbnb License Requirements & STR Laws in Lungòni/Santa Teresa Gallura (2025)
Yes, Lungòni/Santa Teresa Gallura, Sardinia, Italy enforces high STR regulations. Obtaining a license and ensuring compliance is almost certainly required according to current 2025 STR laws. Always verify the latest short term rental regulations and Airbnb license requirements directly with local government authorities for Lungòni/Santa Teresa Gallura to ensure full compliance before hosting.
(Source: AirROI data, 2025, based on 38% licensed listings)
Top Performing Airbnb Properties in Lungòni/Santa Teresa Gallura (2025)
Benchmark your potential! Explore examples of top-performing Airbnb properties in Lungòni/Santa Teresa Gallurabased on Trailing Twelve Month (TTM) revenue. Analyze their characteristics, revenue, occupancy rate, and ADR to understand what drives success in this market.
Johnson Villa between sky and sea
Entire Place • 3 bedrooms

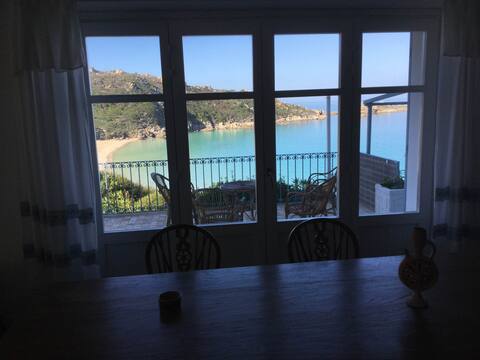
Pool & Ocean view
Entire Place • 3 bedrooms
![Casa Stellins [Free wifi - Garden - 4min to beach]](https://a0.muscache.com/im/pictures/miso/Hosting-698895542991502218/original/6e8d9494-0630-4a57-ba44-21fcd6b7818a.jpeg?im_w=480&im_format=avif)
Casa Stellins [Free wifi - Garden - 4min to beach]
Entire Place • 2 bedrooms
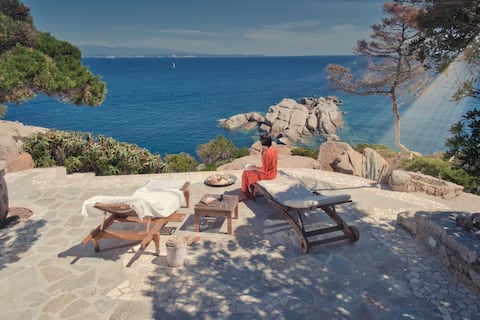
Steps from the crystal clear Sardinian sea
Entire Place • 4 bedrooms

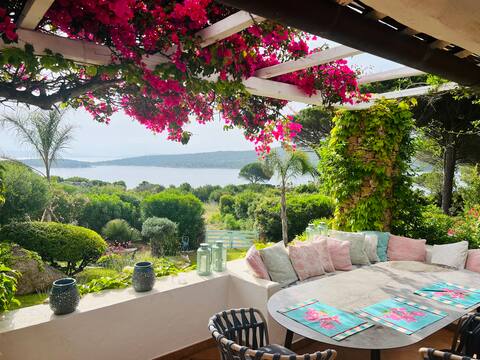
Charming veranda by the sea
Entire Place • 2 bedrooms
La Chiglia Bianca - Villa Privata
Entire Place • 4 bedrooms
Note: Performance varies based on location, size, amenities, seasonality, and management quality. Data reflects the past 12 months.
Top Performing Airbnb Hosts in Lungòni/Santa Teresa Gallura (2025)
Learn from the best! This table showcases top-performing Airbnb hosts in Lungòni/Santa Teresa Gallura based on the number of properties managed and estimated total revenue over the past year. Analyze their scale and performance metrics.
| Host Name | Properties | Grossing Revenue | Stay Reviews | Avg Rating |
|---|---|---|---|---|
| Matteo ImmobilStyle Srl | 18 | $441,012 | 241 | 3.89/5.0 |
| Adriano | 13 | $173,657 | 360 | 4.66/5.0 |
| Gerardo | 10 | $164,561 | 111 | 2.21/5.0 |
| Elena - Interhome Group | 9 | $151,011 | 33 | 1.97/5.0 |
| Cristiana | 1 | $115,071 | 28 | 5.00/5.0 |
| Andreas | 1 | $88,997 | 17 | 5.00/5.0 |
| Luigi | 1 | $86,626 | 38 | 4.97/5.0 |
| Giuseppe | 4 | $82,474 | 45 | 3.73/5.0 |
| Marie Kristiansen | 1 | $78,932 | 32 | 4.91/5.0 |
| Simone | 3 | $74,922 | 54 | 3.20/5.0 |
Analyzing the strategies of top hosts, such as their property selection, pricing, and guest communication, can offer valuable lessons for optimizing your own Airbnb operations in Lungòni/Santa Teresa Gallura.
Dive Deeper: Advanced Lungòni/Santa Teresa Gallura STR Market Data (2025)
Ready to unlock more insights? AirROI provides access to advanced metrics and comprehensive Airbnb data for Lungòni/Santa Teresa Gallura. Explore detailed analytics beyond this report to refine your investment strategy, optimize pricing, and maximize your vacation rental profits.
Explore Advanced MetricsLungòni/Santa Teresa Gallura Short-Term Rental Market Composition (2025): Property & Room Types
Room Type Distribution
Property Type Distribution
Market Composition Insights for Lungòni/Santa Teresa Gallura
- The Lungòni/Santa Teresa Gallura Airbnb market composition is heavily skewed towards Entire Home/Apt listings, which make up 89.2% of the 688 active rentals. This indicates strong guest preference for privacy and space.
- Looking at the property type distribution in Lungòni/Santa Teresa Gallura, Apartment/Condo properties are the most common (55.2%), reflecting the local real estate landscape.
- Houses represent a significant 37.1% portion, catering likely to families or larger groups.
- The presence of 6.4% Hotel/Boutique listings indicates integration with traditional hospitality.
- Smaller segments like outdoor/unique, unique stays (combined 1.3%) offer potential for unique stay experiences.
Lungòni/Santa Teresa Gallura Airbnb Room Capacity Analysis (2025): Bedroom Distribution
Distribution of Listings by Number of Bedrooms
Room Capacity Insights for Lungòni/Santa Teresa Gallura
- The dominant room capacity in Lungòni/Santa Teresa Gallura is 1 bedroom listings, making up 44.3% of the market. This suggests a strong demand for properties suitable for couples or solo travelers.
- Together, 1 bedroom and 2 bedrooms properties represent 76.0% of the active Airbnb listings in Lungòni/Santa Teresa Gallura, indicating a high concentration in these sizes.
Lungòni/Santa Teresa Gallura Vacation Rental Guest Capacity Trends (2025)
Distribution of Listings by Guest Capacity
Guest Capacity Insights for Lungòni/Santa Teresa Gallura
- The most common guest capacity trend in Lungòni/Santa Teresa Gallura vacation rentals is listings accommodating 4 guests (39.5%). This suggests the primary traveler segment is likely small families or groups.
- Properties designed for 4 guests and 2 guests dominate the Lungòni/Santa Teresa Gallura STR market, accounting for 55.6% of listings.
- 23.3% of properties accommodate 6+ guests, serving the market segment for larger families or group travel in Lungòni/Santa Teresa Gallura.
- On average, properties in Lungòni/Santa Teresa Gallura are equipped to host 4.1 guests.
Lungòni/Santa Teresa Gallura Airbnb Booking Patterns (2025): Available vs. Booked Days
Available Days Distribution
Booked Days Distribution
Booking Pattern Insights for Lungòni/Santa Teresa Gallura
- The most common availability pattern in Lungòni/Santa Teresa Gallura falls within the 271-366 days range, representing 67.6% of listings. This suggests many properties have significant open periods on their calendars.
- Approximately 96.4% of listings show high availability (181+ days open annually), indicating potential for increased bookings or specific owner usage patterns.
- For booked days, the 31-90 days range is most frequent in Lungòni/Santa Teresa Gallura (37.9%), reflecting common guest stay durations or potential owner blocking patterns.
- A notable 4.4% of properties secure long booking periods (181+ days booked per year), highlighting successful long-term rental strategies or significant owner usage.
Lungòni/Santa Teresa Gallura Airbnb Minimum Stay Requirements Analysis
Distribution of Listings by Minimum Night Requirement
1 Night
102 listings
15.8% of total
2 Nights
41 listings
6.3% of total
3 Nights
95 listings
14.7% of total
4-6 Nights
189 listings
29.3% of total
7-29 Nights
184 listings
28.5% of total
30+ Nights
35 listings
5.4% of total
Key Insights
- The most prevalent minimum stay requirement in Lungòni/Santa Teresa Gallura is 4-6 Nights, adopted by 29.3% of listings. This highlights the market's preference for longer commitments.
Recommendations
- Align with the market by considering a 4-6 Nights minimum stay, as 29.3% of Lungòni/Santa Teresa Gallura hosts use this setting.
- If feasible, allowing 1-night stays, especially midweek or during low season, could capture last-minute bookings, as only 15.8% currently do.
- Explore offering discounts for stays of 30+ nights to attract the 5.4% of the market seeking extended stays.
- Adjust minimum nights based on seasonality – potentially shorter during low season and longer during peak demand periods in Lungòni/Santa Teresa Gallura.
Lungòni/Santa Teresa Gallura Airbnb Cancellation Policy Trends Analysis (2025)
Super Strict 30 Days
25 listings
4.7% of total
Super Strict 60 Days
6 listings
1.1% of total
Flexible
70 listings
13.3% of total
Moderate
150 listings
28.5% of total
Strict
276 listings
52.4% of total
Cancellation Policy Insights for Lungòni/Santa Teresa Gallura
- The prevailing Airbnb cancellation policy trend in Lungòni/Santa Teresa Gallura is Strict, used by 52.4% of listings.
- A majority (52.4%) of hosts in Lungòni/Santa Teresa Gallura utilize Firm or Strict policies, indicating a market where hosts prioritize booking security.
Recommendations for Hosts
- Consider adopting a Strict policy to align with the 52.4% market standard in Lungòni/Santa Teresa Gallura.
- With 52.4% using Strict terms, this is a viable option in Lungòni/Santa Teresa Gallura, particularly for high-value properties or during peak demand periods.
- Regularly review your cancellation policy against competitors and market demand shifts in Lungòni/Santa Teresa Gallura.
Lungòni/Santa Teresa Gallura STR Booking Lead Time Analysis (2025)
Average Booking Lead Time by Month
Booking Lead Time Insights for Lungòni/Santa Teresa Gallura
- The overall average booking lead time for vacation rentals in Lungòni/Santa Teresa Gallura is 70 days.
- Guests book furthest in advance for stays during July (average 100 days), likely coinciding with peak travel demand or local events.
- The shortest booking windows occur for stays in March (average 20 days), indicating more last-minute travel plans during this time.
- Seasonally, Summer (95 days avg.) sees the longest lead times, while Winter (36 days avg.) has the shortest, reflecting typical travel planning cycles.
Recommendations for Hosts
- Use the overall average lead time (70 days) as a baseline for your pricing and availability strategy in Lungòni/Santa Teresa Gallura.
- For July stays, consider implementing length-of-stay discounts or slightly higher rates for bookings made less than 100 days out to capitalize on advance planning.
- Target marketing efforts for the Summer season well in advance (at least 95 days) to capture early planners.
- Monitor your own booking lead times against these Lungòni/Santa Teresa Gallura averages to identify opportunities for dynamic pricing adjustments.
Popular & Essential Airbnb Amenities in Lungòni/Santa Teresa Gallura (2025)
Amenity Prevalence
Amenity Insights for Lungòni/Santa Teresa Gallura
- Popular amenities like TV, Kitchen, Hot water are common but not universal. Offering these can provide a competitive edge.
Recommendations for Hosts
- Consider adding popular differentiators like TV or Kitchen to increase appeal.
- Highlight unique or less common amenities you offer (e.g., hot tub, dedicated workspace, EV charger) in your listing description and photos.
- Regularly check competitor amenities in Lungòni/Santa Teresa Gallura to stay competitive.
Lungòni/Santa Teresa Gallura Airbnb Guest Demographics & Profile Analysis (2025)
Guest Profile Summary for Lungòni/Santa Teresa Gallura
- The typical guest profile for Airbnb in Lungòni/Santa Teresa Gallura consists of predominantly international visitors (77%), with top international origins including France, typically belonging to the Post-2000s (Gen Z/Alpha) group (50%), primarily speaking English or French.
- Domestic travelers account for 23.5% of guests.
- Key international markets include Italy (23.5%) and France (18.4%).
- Top languages spoken are English (37.5%) followed by French (14.9%).
- A significant demographic segment is the Post-2000s (Gen Z/Alpha) group, representing 50% of guests.
Recommendations for Hosts
- Focus marketing internationally, particularly towards travelers from France.
- Tailor amenities and listing descriptions to appeal to the dominant Post-2000s (Gen Z/Alpha) demographic (e.g., highlight fast WiFi, smart home features, local guides).
- Highlight unique local experiences or amenities relevant to the primary guest profile.
- Consider seasonal promotions aligned with peak travel times for key origin markets.
Nearby Short-Term Rental Market Comparison
How does the Lungòni/Santa Teresa Gallura Airbnb market stack up against its neighbors? Compare key performance metrics like average monthly revenue, ADR, and occupancy rates in surrounding areas to understand the broader regional STR landscape.
| Market | Active Properties | Monthly Revenue | Daily Rate | Avg. Occupancy |
|---|---|---|---|---|
| Porto Cervo | 211 | $2,819 | $463.39 | 42% |
| Poltu Quatu | 58 | $2,272 | $314.25 | 47% |
| Murato | 10 | $2,063 | $191.89 | 46% |
| Alzachèna/Arzachena | 391 | $2,005 | $387.72 | 42% |
| Rio | 23 | $1,946 | $343.94 | 43% |
| Zonza | 709 | $1,922 | $294.10 | 44% |
| Pietrosella | 239 | $1,911 | $258.65 | 45% |
| Figari | 213 | $1,890 | $191.79 | 50% |
| Bonifacio / Bunifaziu | 499 | $1,866 | $216.08 | 49% |
| Porto-Vecchio | 1,908 | $1,814 | $220.84 | 48% |