La Maddalena Airbnb Market Analysis 2025: Short Term Rental Data & Vacation Rental Statistics in Sardinia, Italy
Is Airbnb profitable in La Maddalena in 2025? Explore comprehensive Airbnb analytics for La Maddalena, Sardinia, Italy to uncover income potential. This 2025 STR market report for La Maddalena, based on AirROI data from April 2024 to March 2025, reveals key trends in the market of 478 active listings.
Whether you're considering an Airbnb investment in La Maddalena, optimizing your existing vacation rental, or exploring rental arbitrage opportunities, understanding the La Maddalena Airbnb data is crucial. Navigating the high regulation landscape is key to maximizing your short term rental income potential. Let's dive into the specifics.
Key La Maddalena Airbnb Performance Metrics Overview
Monthly Airbnb Revenue Variations & Income Potential in La Maddalena (2025)
Understanding the monthly revenue variations for Airbnb listings in La Maddalena is key to maximizing your short term rental income potential. Seasonality significantly impacts earnings. Our analysis, based on data from the past 12 months, shows that the peak revenue month for STRs in La Maddalena is typically August, while February often presents the lowest earnings, highlighting opportunities for strategic pricing adjustments during shoulder and low seasons. Explore the typical Airbnb income in La Maddalena across different performance tiers:
- Best-in-class properties (Top 10%) achieve $3,420+ monthly, often utilizing dynamic pricing and superior guest experiences.
- Strong performing properties (Top 25%) earn $2,048 or more, indicating effective management and desirable locations/amenities.
- Typical properties (Median) generate around $1,204 per month, representing the average market performance.
- Entry-level properties (Bottom 25%) see earnings around $630, often with potential for optimization.
Average Monthly Airbnb Earnings Trend in La Maddalena
La Maddalena Airbnb Occupancy Rate Trends (2025)
Maximize your bookings by understanding the La Maddalena STR occupancy trends. Seasonal demand shifts significantly influence how often properties are booked. Typically, Augustsees the highest demand (peak season occupancy), while January experiences the lowest (low season). Effective strategies, like adjusting minimum stays or offering promotions, can boost occupancy during slower periods. Here's how different property tiers perform in La Maddalena:
- Best-in-class properties (Top 10%) achieve 64%+ occupancy, indicating high desirability and potentially optimized availability.
- Strong performing properties (Top 25%) maintain 48% or higher occupancy, suggesting good market fit and guest satisfaction.
- Typical properties (Median) have an occupancy rate around 31%.
- Entry-level properties (Bottom 25%) average 16% occupancy, potentially facing higher vacancy.
Average Monthly Occupancy Rate Trend in La Maddalena
Average Daily Rate (ADR) Airbnb Trends in La Maddalena (2025)
Effective short term rental pricing strategy in La Maddalena involves understanding monthly ADR fluctuations. The Average Daily Rate (ADR) for Airbnb in La Maddalena typically peaks in August and dips lowest during November. Leveraging Airbnb dynamic pricing tools or strategies based on this seasonality can significantly boost revenue. Here's a look at the typical nightly rates achieved:
- Best-in-class properties (Top 10%) command rates of $291+ per night, often due to premium features or locations.
- Strong performing properties (Top 25%) achieve nightly rates of $173 or more.
- Typical properties (Median) charge around $120 per night.
- Entry-level properties (Bottom 25%) earn around $91 per night.
Average Daily Rate (ADR) Trend by Month in La Maddalena
Get Live La Maddalena Market Intelligence 👇

Explore Real-time Analytics
Airbnb Seasonality Analysis & Trends in La Maddalena (2025)
Peak Season (August, July, June)
- Revenue averages $3,154 per month
- Occupancy rates average 53.8%
- Daily rates average $205
Shoulder Season
- Revenue averages $1,558 per month
- Occupancy maintains around 31.0%
- Daily rates hold near $176
Low Season (January, February, December)
- Revenue drops to average $735 per month
- Occupancy decreases to average 18.0%
- Daily rates adjust to average $157
Seasonality Insights for La Maddalena
- The Airbnb seasonality in La Maddalena shows highly seasonal trends requiring careful strategy. While the sections above show seasonal averages, it's also insightful to look at the extremes:
- During the high season, the absolute peak month showcases La Maddalena's highest earning potential, with monthly revenues capable of climbing to $3,887, occupancy reaching a high of 66.8%, and ADRs peaking at $213.
- Conversely, the slowest single month of the year, typically falling within the low season, marks the market's lowest point. In this month, revenue might dip to $715, occupancy could drop to 17.9%, and ADRs may adjust down to $153.
- Understanding both the seasonal averages and these monthly peaks and troughs in revenue, occupancy, and ADR is crucial for maximizing your Airbnb profit potential in La Maddalena.
Seasonal Strategies for Maximizing Profit
- Peak Season: Maximize revenue through premium pricing and potentially longer minimum stays. Ensure high availability.
- Low Season: Offer competitive pricing, special promotions (e.g., extended stay discounts), and flexible cancellation policies. Target off-season travelers like remote workers or budget-conscious guests.
- Shoulder Seasons: Implement dynamic pricing that balances peak and low rates. Target weekend travelers or specific events. Offer slightly more flexible terms than peak season.
- Regularly analyze your own performance against these La Maddalena seasonality benchmarks and adjust your pricing and availability strategy accordingly.
Best Areas for Airbnb Investment in La Maddalena (2025)
Exploring the top neighborhoods for short-term rentals in La Maddalena? This section highlights key areas, outlining why they are attractive for hosts and guests, along with notable local attractions. Consider these locations based on your target guest profile and investment strategy.
| Neighborhood / Area | Why Host Here? (Target Guests & Appeal) | Key Attractions & Landmarks |
|---|---|---|
| Spiaggia di Cala Corsara | A stunning beach known for its crystal clear waters and beautiful surroundings. Highly sought after by tourists looking for a relaxing seaside experience. | Cala Corsara Beach, Roccia dell'Orso, La Maddalena National Park |
| Porto della Maddalena | The main port area with a vibrant atmosphere, full of shops, restaurants, and bars. Ideal for tourists looking to explore the island and enjoy local cuisine. | Piazza delle Quattro Fontane, Church of Santa Maria Maddalena, waterfront promenades |
| Caprera Island | Connected to La Maddalena, Caprera is a nature lover's paradise with hiking trails and stunning views. Great for more adventurous travelers. | Garibaldi's House, Cala Coticcio, Caprera National Park |
| Spiaggia di Cala Lunga | A hidden gem with less crowded beaches, perfect for tourists seeking tranquility and natural beauty away from the hustle. | Cala Lunga Beach |
| Spiaggia di Punta Tegge | Famous for its beautiful sands and clear waters, popular among families and beachgoers looking for a relaxing day at the beach. | Punta Tegge Beach, snorkeling spots |
| La Maddalena Town Center | Offers a mix of cultural experiences and local charm, with shops and historical sites. Great for those wanting to immerse themselves in local life. | Historical Museum, Fortifications of La Maddalena, local shops and cafés |
| Spiaggia dell'Anglo | Known for its scenic views and calm waters, perfect for sunbathing and enjoying water sports like kayaking and paddle boarding. | Anglo Beach, water sports facilities |
| Cala di Trinità | A picturesque bay that’s perfect for photography and relaxation, attracting visitors seeking scenic landscapes and quiet spots. | Trinità Beach, hiking trails to the hills for panoramic views |
Understanding Airbnb License Requirements & STR Laws in La Maddalena (2025)
Yes, La Maddalena, Sardinia, Italy enforces high STR regulations. Obtaining a license and ensuring compliance is almost certainly required according to current 2025 STR laws. Always verify the latest short term rental regulations and Airbnb license requirements directly with local government authorities for La Maddalena to ensure full compliance before hosting.
(Source: AirROI data, 2025, based on 44% licensed listings)
Top Performing Airbnb Properties in La Maddalena (2025)
Benchmark your potential! Explore examples of top-performing Airbnb properties in La Maddalenabased on Trailing Twelve Month (TTM) revenue. Analyze their characteristics, revenue, occupancy rate, and ADR to understand what drives success in this market.
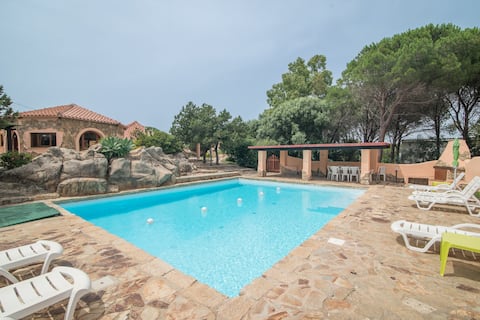
Villa degli Archi
Entire Place • 3 bedrooms

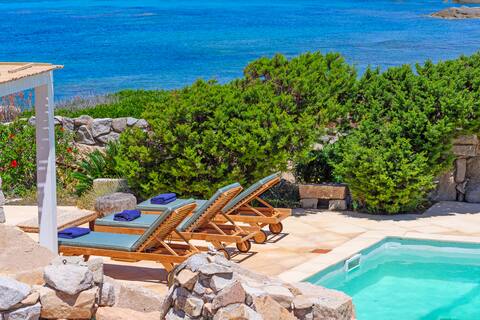
Seaside Villa (5mt) La Maddalena
Entire Place • 4 bedrooms
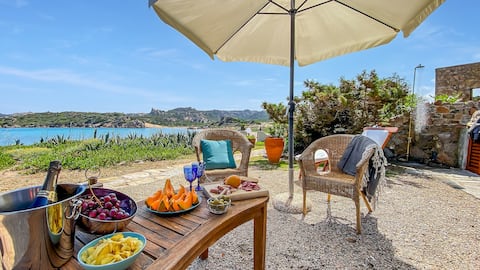
Villa Itaca - Cala Francese
Entire Place • 3 bedrooms
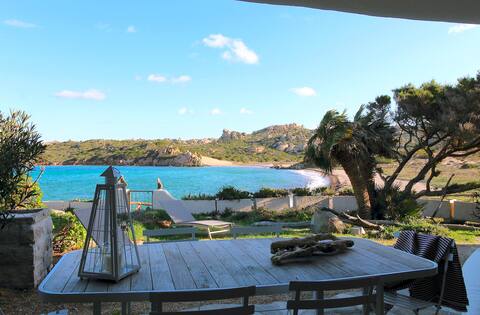
La Maranita Apartment
Entire Place • 3 bedrooms
![[Private Sea Access] - Villa Deluxe Front Sea](https://a0.muscache.com/im/pictures/hosting/Hosting-U3RheVN1cHBseUxpc3Rpbmc6MjM2Nzk1Mjk%3D/original/38a014c7-bdc3-4a5e-bfcf-131dd4555871.jpeg?im_w=480&im_format=avif)
[Private Sea Access] - Villa Deluxe Front Sea
Entire Place • 3 bedrooms
Maison Monte d 'A Rena
Entire Place • 3 bedrooms
Note: Performance varies based on location, size, amenities, seasonality, and management quality. Data reflects the past 12 months.
Top Performing Airbnb Hosts in La Maddalena (2025)
Learn from the best! This table showcases top-performing Airbnb hosts in La Maddalena based on the number of properties managed and estimated total revenue over the past year. Analyze their scale and performance metrics.
| Host Name | Properties | Grossing Revenue | Stay Reviews | Avg Rating |
|---|---|---|---|---|
| Holidu | 1 | $329,693 | 3 | 4.67/5.0 |
| Magdaway | 6 | $322,902 | 51 | 4.09/5.0 |
| Andrea | 6 | $277,559 | 164 | 4.86/5.0 |
| Riccardo Lucchetta | 6 | $246,093 | 52 | 4.96/5.0 |
| Umberto | 8 | $205,654 | 242 | 4.94/5.0 |
| James Patrick | 16 | $133,380 | 47 | 1.70/5.0 |
| Compagnie Immobiliari Associat | 17 | $109,978 | 9 | 0.56/5.0 |
| Mari | 5 | $85,577 | 275 | 4.91/5.0 |
| Residenze Le Vele | 7 | $84,396 | 176 | 3.86/5.0 |
| Davide | 5 | $82,883 | 347 | 4.90/5.0 |
Analyzing the strategies of top hosts, such as their property selection, pricing, and guest communication, can offer valuable lessons for optimizing your own Airbnb operations in La Maddalena.
Dive Deeper: Advanced La Maddalena STR Market Data (2025)
Ready to unlock more insights? AirROI provides access to advanced metrics and comprehensive Airbnb data for La Maddalena. Explore detailed analytics beyond this report to refine your investment strategy, optimize pricing, and maximize your vacation rental profits.
Explore Advanced MetricsLa Maddalena Short-Term Rental Market Composition (2025): Property & Room Types
Room Type Distribution
Property Type Distribution
Market Composition Insights for La Maddalena
- The La Maddalena Airbnb market composition is heavily skewed towards Entire Home/Apt listings, which make up 91.8% of the 478 active rentals. This indicates strong guest preference for privacy and space.
- Looking at the property type distribution in La Maddalena, Apartment/Condo properties are the most common (61.7%), reflecting the local real estate landscape.
- Houses represent a significant 31.6% portion, catering likely to families or larger groups.
- Smaller segments like hotel/boutique, others, outdoor/unique (combined 6.7%) offer potential for unique stay experiences.
La Maddalena Airbnb Room Capacity Analysis (2025): Bedroom Distribution
Distribution of Listings by Number of Bedrooms
Room Capacity Insights for La Maddalena
- The dominant room capacity in La Maddalena is 1 bedroom listings, making up 44.4% of the market. This suggests a strong demand for properties suitable for couples or solo travelers.
- Together, 1 bedroom and 2 bedrooms properties represent 79.3% of the active Airbnb listings in La Maddalena, indicating a high concentration in these sizes.
La Maddalena Vacation Rental Guest Capacity Trends (2025)
Distribution of Listings by Guest Capacity
Guest Capacity Insights for La Maddalena
- The most common guest capacity trend in La Maddalena vacation rentals is listings accommodating 4 guests (39.3%). This suggests the primary traveler segment is likely small families or groups.
- Properties designed for 4 guests and 2 guests dominate the La Maddalena STR market, accounting for 57.3% of listings.
- 23.6% of properties accommodate 6+ guests, serving the market segment for larger families or group travel in La Maddalena.
- On average, properties in La Maddalena are equipped to host 4.1 guests.
La Maddalena Airbnb Booking Patterns (2025): Available vs. Booked Days
Available Days Distribution
Booked Days Distribution
Booking Pattern Insights for La Maddalena
- The most common availability pattern in La Maddalena falls within the 271-366 days range, representing 63.6% of listings. This suggests many properties have significant open periods on their calendars.
- Approximately 96.9% of listings show high availability (181+ days open annually), indicating potential for increased bookings or specific owner usage patterns.
- For booked days, the 31-90 days range is most frequent in La Maddalena (40.4%), reflecting common guest stay durations or potential owner blocking patterns.
- A notable 4.0% of properties secure long booking periods (181+ days booked per year), highlighting successful long-term rental strategies or significant owner usage.
La Maddalena Airbnb Minimum Stay Requirements Analysis
Distribution of Listings by Minimum Night Requirement
1 Night
54 listings
12.3% of total
2 Nights
82 listings
18.7% of total
3 Nights
82 listings
18.7% of total
4-6 Nights
100 listings
22.8% of total
7-29 Nights
93 listings
21.2% of total
30+ Nights
28 listings
6.4% of total
Key Insights
- The most prevalent minimum stay requirement in La Maddalena is 4-6 Nights, adopted by 22.8% of listings. This highlights the market's preference for longer commitments.
Recommendations
- Align with the market by considering a 4-6 Nights minimum stay, as 22.8% of La Maddalena hosts use this setting.
- If feasible, allowing 1-night stays, especially midweek or during low season, could capture last-minute bookings, as only 12.3% currently do.
- Explore offering discounts for stays of 30+ nights to attract the 6.4% of the market seeking extended stays.
- Adjust minimum nights based on seasonality – potentially shorter during low season and longer during peak demand periods in La Maddalena.
La Maddalena Airbnb Cancellation Policy Trends Analysis (2025)
Super Strict 60 Days
1 listings
0.3% of total
Super Strict 30 Days
3 listings
0.8% of total
Flexible
65 listings
17.7% of total
Moderate
156 listings
42.4% of total
Strict
143 listings
38.9% of total
Cancellation Policy Insights for La Maddalena
- The prevailing Airbnb cancellation policy trend in La Maddalena is Moderate, used by 42.4% of listings.
- There's a relatively balanced mix between guest-friendly (60.1%) and stricter (38.9%) policies, offering choices for different guest needs.
Recommendations for Hosts
- Consider adopting a Moderate policy to align with the 42.4% market standard in La Maddalena.
- With 38.9% using Strict terms, this is a viable option in La Maddalena, particularly for high-value properties or during peak demand periods.
- Regularly review your cancellation policy against competitors and market demand shifts in La Maddalena.
La Maddalena STR Booking Lead Time Analysis (2025)
Average Booking Lead Time by Month
Booking Lead Time Insights for La Maddalena
- The overall average booking lead time for vacation rentals in La Maddalena is 64 days.
- Guests book furthest in advance for stays during July (average 98 days), likely coinciding with peak travel demand or local events.
- The shortest booking windows occur for stays in March (average 27 days), indicating more last-minute travel plans during this time.
- Seasonally, Summer (91 days avg.) sees the longest lead times, while Winter (29 days avg.) has the shortest, reflecting typical travel planning cycles.
Recommendations for Hosts
- Use the overall average lead time (64 days) as a baseline for your pricing and availability strategy in La Maddalena.
- For July stays, consider implementing length-of-stay discounts or slightly higher rates for bookings made less than 98 days out to capitalize on advance planning.
- Target marketing efforts for the Summer season well in advance (at least 91 days) to capture early planners.
- Monitor your own booking lead times against these La Maddalena averages to identify opportunities for dynamic pricing adjustments.
Popular & Essential Airbnb Amenities in La Maddalena (2025)
Amenity Prevalence
Amenity Insights for La Maddalena
- Popular amenities like TV, Kitchen, Hot water are common but not universal. Offering these can provide a competitive edge.
Recommendations for Hosts
- Consider adding popular differentiators like TV or Kitchen to increase appeal.
- Highlight unique or less common amenities you offer (e.g., hot tub, dedicated workspace, EV charger) in your listing description and photos.
- Regularly check competitor amenities in La Maddalena to stay competitive.
La Maddalena Airbnb Guest Demographics & Profile Analysis (2025)
Guest Profile Summary for La Maddalena
- The typical guest profile for Airbnb in La Maddalena consists of predominantly international visitors (77%), with top international origins including Italy, typically belonging to the Post-2000s (Gen Z/Alpha) group (50%), primarily speaking English or French.
- Domestic travelers account for 22.8% of guests.
- Key international markets include France (26%) and Italy (22.8%).
- Top languages spoken are English (37.1%) followed by French (17.1%).
- A significant demographic segment is the Post-2000s (Gen Z/Alpha) group, representing 50% of guests.
Recommendations for Hosts
- Focus marketing internationally, particularly towards travelers from Italy.
- Tailor amenities and listing descriptions to appeal to the dominant Post-2000s (Gen Z/Alpha) demographic (e.g., highlight fast WiFi, smart home features, local guides).
- Highlight unique local experiences or amenities relevant to the primary guest profile.
- Consider seasonal promotions aligned with peak travel times for key origin markets.
Nearby Short-Term Rental Market Comparison
How does the La Maddalena Airbnb market stack up against its neighbors? Compare key performance metrics like average monthly revenue, ADR, and occupancy rates in surrounding areas to understand the broader regional STR landscape.
| Market | Active Properties | Monthly Revenue | Daily Rate | Avg. Occupancy |
|---|---|---|---|---|
| Porto Cervo | 211 | $2,819 | $463.39 | 42% |
| Poltu Quatu | 58 | $2,272 | $314.25 | 47% |
| Murato | 10 | $2,063 | $191.89 | 46% |
| Alzachèna/Arzachena | 391 | $2,005 | $387.72 | 42% |
| Rio | 23 | $1,946 | $343.94 | 43% |
| Zonza | 709 | $1,922 | $294.10 | 44% |
| Pietrosella | 239 | $1,911 | $258.65 | 45% |
| Figari | 213 | $1,890 | $191.79 | 50% |
| Bonifacio / Bunifaziu | 499 | $1,866 | $216.08 | 49% |
| Porto-Vecchio | 1,908 | $1,814 | $220.84 | 48% |