Iglesias Airbnb Market Analysis 2025: Short Term Rental Data & Vacation Rental Statistics in Sardinia, Italy
Is Airbnb profitable in Iglesias in 2025? Explore comprehensive Airbnb analytics for Iglesias, Sardinia, Italy to uncover income potential. This 2025 STR market report for Iglesias, based on AirROI data from April 2024 to March 2025, reveals key trends in the market of 216 active listings.
Whether you're considering an Airbnb investment in Iglesias, optimizing your existing vacation rental, or exploring rental arbitrage opportunities, understanding the Iglesias Airbnb data is crucial. Navigating the high regulation landscape is key to maximizing your short term rental income potential. Let's dive into the specifics.
Key Iglesias Airbnb Performance Metrics Overview
Monthly Airbnb Revenue Variations & Income Potential in Iglesias (2025)
Understanding the monthly revenue variations for Airbnb listings in Iglesias is key to maximizing your short term rental income potential. Seasonality significantly impacts earnings. Our analysis, based on data from the past 12 months, shows that the peak revenue month for STRs in Iglesias is typically August, while February often presents the lowest earnings, highlighting opportunities for strategic pricing adjustments during shoulder and low seasons. Explore the typical Airbnb income in Iglesias across different performance tiers:
- Best-in-class properties (Top 10%) achieve $2,415+ monthly, often utilizing dynamic pricing and superior guest experiences.
- Strong performing properties (Top 25%) earn $1,513 or more, indicating effective management and desirable locations/amenities.
- Typical properties (Median) generate around $801 per month, representing the average market performance.
- Entry-level properties (Bottom 25%) see earnings around $358, often with potential for optimization.
Average Monthly Airbnb Earnings Trend in Iglesias
Iglesias Airbnb Occupancy Rate Trends (2025)
Maximize your bookings by understanding the Iglesias STR occupancy trends. Seasonal demand shifts significantly influence how often properties are booked. Typically, Augustsees the highest demand (peak season occupancy), while February experiences the lowest (low season). Effective strategies, like adjusting minimum stays or offering promotions, can boost occupancy during slower periods. Here's how different property tiers perform in Iglesias:
- Best-in-class properties (Top 10%) achieve 63%+ occupancy, indicating high desirability and potentially optimized availability.
- Strong performing properties (Top 25%) maintain 46% or higher occupancy, suggesting good market fit and guest satisfaction.
- Typical properties (Median) have an occupancy rate around 28%.
- Entry-level properties (Bottom 25%) average 13% occupancy, potentially facing higher vacancy.
Average Monthly Occupancy Rate Trend in Iglesias
Average Daily Rate (ADR) Airbnb Trends in Iglesias (2025)
Effective short term rental pricing strategy in Iglesias involves understanding monthly ADR fluctuations. The Average Daily Rate (ADR) for Airbnb in Iglesias typically peaks in August and dips lowest during March. Leveraging Airbnb dynamic pricing tools or strategies based on this seasonality can significantly boost revenue. Here's a look at the typical nightly rates achieved:
- Best-in-class properties (Top 10%) command rates of $167+ per night, often due to premium features or locations.
- Strong performing properties (Top 25%) achieve nightly rates of $115 or more.
- Typical properties (Median) charge around $87 per night.
- Entry-level properties (Bottom 25%) earn around $64 per night.
Average Daily Rate (ADR) Trend by Month in Iglesias
Get Live Iglesias Market Intelligence 👇

Explore Real-time Analytics
Airbnb Seasonality Analysis & Trends in Iglesias (2025)
Peak Season (August, July, June)
- Revenue averages $1,955 per month
- Occupancy rates average 48.0%
- Daily rates average $113
Shoulder Season
- Revenue averages $1,049 per month
- Occupancy maintains around 29.3%
- Daily rates hold near $104
Low Season (February, March, December)
- Revenue drops to average $479 per month
- Occupancy decreases to average 18.6%
- Daily rates adjust to average $100
Seasonality Insights for Iglesias
- The Airbnb seasonality in Iglesias shows highly seasonal trends requiring careful strategy. While the sections above show seasonal averages, it's also insightful to look at the extremes:
- During the high season, the absolute peak month showcases Iglesias's highest earning potential, with monthly revenues capable of climbing to $2,467, occupancy reaching a high of 61.3%, and ADRs peaking at $117.
- Conversely, the slowest single month of the year, typically falling within the low season, marks the market's lowest point. In this month, revenue might dip to $434, occupancy could drop to 18.4%, and ADRs may adjust down to $99.
- Understanding both the seasonal averages and these monthly peaks and troughs in revenue, occupancy, and ADR is crucial for maximizing your Airbnb profit potential in Iglesias.
Seasonal Strategies for Maximizing Profit
- Peak Season: Maximize revenue through premium pricing and potentially longer minimum stays. Ensure high availability.
- Low Season: Offer competitive pricing, special promotions (e.g., extended stay discounts), and flexible cancellation policies. Target off-season travelers like remote workers or budget-conscious guests.
- Shoulder Seasons: Implement dynamic pricing that balances peak and low rates. Target weekend travelers or specific events. Offer slightly more flexible terms than peak season.
- Regularly analyze your own performance against these Iglesias seasonality benchmarks and adjust your pricing and availability strategy accordingly.
Best Areas for Airbnb Investment in Iglesias (2025)
Exploring the top neighborhoods for short-term rentals in Iglesias? This section highlights key areas, outlining why they are attractive for hosts and guests, along with notable local attractions. Consider these locations based on your target guest profile and investment strategy.
| Neighborhood / Area | Why Host Here? (Target Guests & Appeal) | Key Attractions & Landmarks |
|---|---|---|
| Iglesias City Center | The vibrant historical center of Iglesias, known for its ancient architecture and lively atmosphere. It's a prime location for tourists who want to explore local culture, history, and cuisine. | Castello di Salvaterra, Cattedrale di Santa Chiara, Museo dell'Arte Mineraria, Piazza Municipio, Parco della Memoria |
| Sand Beach | Adjacent to the beautiful beaches, this area is perfect for sun-seekers and water sports enthusiasts. The stunning coastline and outdoor activities attract families and adventure lovers. | Spiaggia di Fontanamare, Spiaggia di Masua, Bacino di Malfatano, Dune di Piscinas, Scogliera di Nebida |
| Mountains of Iglesias | This area offers breathtaking natural landscapes and outdoor activities such as hiking and mountain biking. Ideal for nature lovers and those seeking tranquility away from urban life. | Parco Geominerario Storico, Monteponi, Grotta di Su Mannau, Parco della Miniera di Nebida, Trekking trails |
| Nusco | A quaint village known for its scenic beauty and peaceful ambiance. Attracts tourists looking for a relaxing getaway in a charming Italian setting. | Chiesa di San Michele Arcangelo, Local artisan shops, Scenic viewpoints, Traditional festivals |
| Coastal Villas | A serene area with private villas and apartments near the coast. Popular among travelers who prefer a more exclusive and quiet stay near the beaches. | Beachfront properties, Private access to beaches, Local seafood restaurants, Water activities, Relaxation spots |
| Historical Mines | Rich in mining history, this area attracts those interested in heritage and industrial tourism, offering guided tours and educational experiences. | Museo del Minatore, Old mine sites, Guided mine tours, Educational workshops |
| Cultural Hotspots | Known for its festivals and cultural events throughout the year, making it a desirable location for travelers who wish to experience local traditions and gatherings. | Annual festivals, Local art exhibitions, Cultural markets, Traditional music events |
| Nature Reserves | Surrounded by protected natural parks, this area is great for eco-tourism and attracts those who want to experience Sardinia's flora and fauna up close. | Sardinia Natural Park, Birdwatching spots, Nature trails, Eco-friendly activities |
Understanding Airbnb License Requirements & STR Laws in Iglesias (2025)
Yes, Iglesias, Sardinia, Italy enforces high STR regulations. Obtaining a license and ensuring compliance is almost certainly required according to current 2025 STR laws. Always verify the latest short term rental regulations and Airbnb license requirements directly with local government authorities for Iglesias to ensure full compliance before hosting.
(Source: AirROI data, 2025, based on 55% licensed listings)
Top Performing Airbnb Properties in Iglesias (2025)
Benchmark your potential! Explore examples of top-performing Airbnb properties in Iglesiasbased on Trailing Twelve Month (TTM) revenue. Analyze their characteristics, revenue, occupancy rate, and ADR to understand what drives success in this market.

Monica Villa
Entire Place • 5 bedrooms

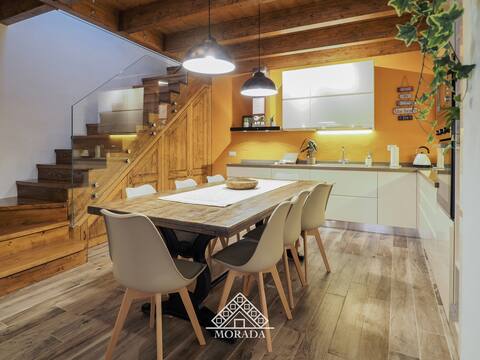
Iglesias Casa Corrias - Villa with pool
Entire Place • 4 bedrooms

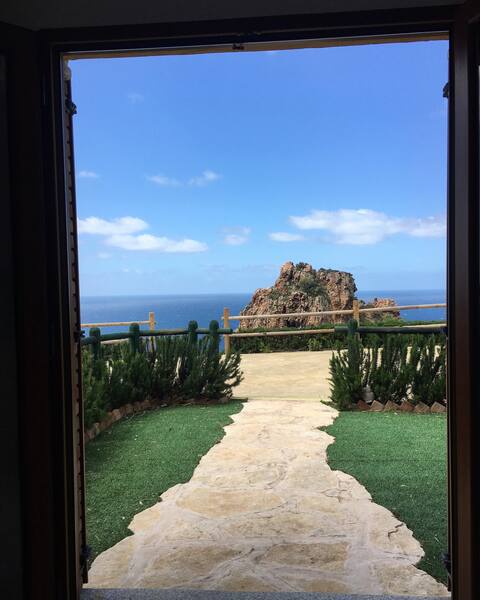
Sugar Loaf View - Appto Porto Flavia -
Entire Place • 2 bedrooms
Amelia Apartment
Entire Place • 3 bedrooms
Il Tramonto Tanca Piras
Entire Place • 2 bedrooms
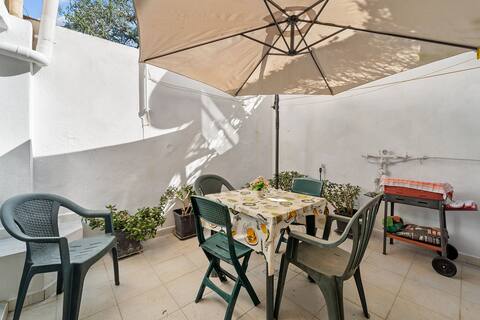
Domu Mea - Morada
Entire Place • 2 bedrooms
Note: Performance varies based on location, size, amenities, seasonality, and management quality. Data reflects the past 12 months.
Top Performing Airbnb Hosts in Iglesias (2025)
Learn from the best! This table showcases top-performing Airbnb hosts in Iglesias based on the number of properties managed and estimated total revenue over the past year. Analyze their scale and performance metrics.
| Host Name | Properties | Grossing Revenue | Stay Reviews | Avg Rating |
|---|---|---|---|---|
| Angelo | 11 | $205,453 | 428 | 4.89/5.0 |
| Estay | 9 | $128,049 | 69 | 4.55/5.0 |
| Morada | 6 | $99,756 | 97 | 4.79/5.0 |
| Claudio E Francesca | 2 | $67,849 | 18 | 4.68/5.0 |
| Marta | 2 | $55,803 | 275 | 4.92/5.0 |
| Francesco | 6 | $53,924 | 30 | 4.92/5.0 |
| PedraRubia | 5 | $47,786 | 63 | 4.84/5.0 |
| Gianna | 3 | $46,534 | 29 | 4.93/5.0 |
| Holidu | 1 | $39,878 | 3 | 3.67/5.0 |
| Enrico | 3 | $37,628 | 79 | 4.73/5.0 |
Analyzing the strategies of top hosts, such as their property selection, pricing, and guest communication, can offer valuable lessons for optimizing your own Airbnb operations in Iglesias.
Dive Deeper: Advanced Iglesias STR Market Data (2025)
Ready to unlock more insights? AirROI provides access to advanced metrics and comprehensive Airbnb data for Iglesias. Explore detailed analytics beyond this report to refine your investment strategy, optimize pricing, and maximize your vacation rental profits.
Explore Advanced MetricsIglesias Short-Term Rental Market Composition (2025): Property & Room Types
Room Type Distribution
Property Type Distribution
Market Composition Insights for Iglesias
- The Iglesias Airbnb market composition is heavily skewed towards Entire Home/Apt listings, which make up 82.9% of the 216 active rentals. This indicates strong guest preference for privacy and space.
- Looking at the property type distribution in Iglesias, Apartment/Condo properties are the most common (53.2%), reflecting the local real estate landscape.
- Houses represent a significant 39.4% portion, catering likely to families or larger groups.
- The presence of 7.4% Hotel/Boutique listings indicates integration with traditional hospitality.
Iglesias Airbnb Room Capacity Analysis (2025): Bedroom Distribution
Distribution of Listings by Number of Bedrooms
Room Capacity Insights for Iglesias
- The dominant room capacity in Iglesias is 1 bedroom listings, making up 44.4% of the market. This suggests a strong demand for properties suitable for couples or solo travelers.
- Together, 1 bedroom and 2 bedrooms properties represent 81.9% of the active Airbnb listings in Iglesias, indicating a high concentration in these sizes.
Iglesias Vacation Rental Guest Capacity Trends (2025)
Distribution of Listings by Guest Capacity
Guest Capacity Insights for Iglesias
- The most common guest capacity trend in Iglesias vacation rentals is listings accommodating 4 guests (35.2%). This suggests the primary traveler segment is likely small families or groups.
- Properties designed for 4 guests and 2 guests dominate the Iglesias STR market, accounting for 58.8% of listings.
- 13.0% of properties accommodate 6+ guests, serving the market segment for larger families or group travel in Iglesias.
- On average, properties in Iglesias are equipped to host 3.6 guests.
Iglesias Airbnb Booking Patterns (2025): Available vs. Booked Days
Available Days Distribution
Booked Days Distribution
Booking Pattern Insights for Iglesias
- The most common availability pattern in Iglesias falls within the 271-366 days range, representing 63.4% of listings. This suggests many properties have significant open periods on their calendars.
- Approximately 94.9% of listings show high availability (181+ days open annually), indicating potential for increased bookings or specific owner usage patterns.
- For booked days, the 31-90 days range is most frequent in Iglesias (35.6%), reflecting common guest stay durations or potential owner blocking patterns.
- A notable 6.0% of properties secure long booking periods (181+ days booked per year), highlighting successful long-term rental strategies or significant owner usage.
Iglesias Airbnb Minimum Stay Requirements Analysis
Distribution of Listings by Minimum Night Requirement
1 Night
46 listings
22.3% of total
2 Nights
48 listings
23.3% of total
3 Nights
37 listings
18% of total
4-6 Nights
22 listings
10.7% of total
7-29 Nights
27 listings
13.1% of total
30+ Nights
26 listings
12.6% of total
Key Insights
- The most prevalent minimum stay requirement in Iglesias is 2 Nights, adopted by 23.3% of listings. This highlights the market's preference for shorter, flexible bookings.
- A significant segment (12.6%) caters to monthly stays (30+ nights) in Iglesias, pointing to opportunities in the extended-stay market.
Recommendations
- Align with the market by considering a 2 Nights minimum stay, as 23.3% of Iglesias hosts use this setting.
- If feasible, allowing 1-night stays, especially midweek or during low season, could capture last-minute bookings, as only 22.3% currently do.
- Explore offering discounts for stays of 30+ nights to attract the 12.6% of the market seeking extended stays.
- Adjust minimum nights based on seasonality – potentially shorter during low season and longer during peak demand periods in Iglesias.
Iglesias Airbnb Cancellation Policy Trends Analysis (2025)
Flexible
38 listings
23.5% of total
Moderate
74 listings
45.7% of total
Strict
50 listings
30.9% of total
Cancellation Policy Insights for Iglesias
- The prevailing Airbnb cancellation policy trend in Iglesias is Moderate, used by 45.7% of listings.
- There's a relatively balanced mix between guest-friendly (69.2%) and stricter (30.9%) policies, offering choices for different guest needs.
Recommendations for Hosts
- Consider adopting a Moderate policy to align with the 45.7% market standard in Iglesias.
- With 30.9% using Strict terms, this is a viable option in Iglesias, particularly for high-value properties or during peak demand periods.
- Regularly review your cancellation policy against competitors and market demand shifts in Iglesias.
Iglesias STR Booking Lead Time Analysis (2025)
Average Booking Lead Time by Month
Booking Lead Time Insights for Iglesias
- The overall average booking lead time for vacation rentals in Iglesias is 57 days.
- Guests book furthest in advance for stays during July (average 83 days), likely coinciding with peak travel demand or local events.
- The shortest booking windows occur for stays in December (average 24 days), indicating more last-minute travel plans during this time.
- Seasonally, Summer (80 days avg.) sees the longest lead times, while Winter (27 days avg.) has the shortest, reflecting typical travel planning cycles.
Recommendations for Hosts
- Use the overall average lead time (57 days) as a baseline for your pricing and availability strategy in Iglesias.
- For July stays, consider implementing length-of-stay discounts or slightly higher rates for bookings made less than 83 days out to capitalize on advance planning.
- Target marketing efforts for the Summer season well in advance (at least 80 days) to capture early planners.
- Monitor your own booking lead times against these Iglesias averages to identify opportunities for dynamic pricing adjustments.
Popular & Essential Airbnb Amenities in Iglesias (2025)
Amenity Prevalence
Amenity Insights for Iglesias
- Essential amenities in Iglesias that guests expect include: Air conditioning. Lacking these (this) could significantly impact bookings.
- Popular amenities like Essentials, Kitchen, Hot water are common but not universal. Offering these can provide a competitive edge.
- Warning: Wifi is not universally provided but is considered essential globally. Ensure reliable Wifi is offered.
Recommendations for Hosts
- Ensure your listing includes all essential amenities for Iglesias: Air conditioning.
- Prioritize adding missing essentials: Air conditioning.
- Consider adding popular differentiators like Essentials or Kitchen to increase appeal.
- Highlight unique or less common amenities you offer (e.g., hot tub, dedicated workspace, EV charger) in your listing description and photos.
- Regularly check competitor amenities in Iglesias to stay competitive.
Iglesias Airbnb Guest Demographics & Profile Analysis (2025)
Guest Profile Summary for Iglesias
- The typical guest profile for Airbnb in Iglesias consists of predominantly international visitors (74%), with top international origins including France, typically belonging to the Post-2000s (Gen Z/Alpha) group (50%), primarily speaking English or French.
- Domestic travelers account for 25.6% of guests.
- Key international markets include Italy (25.6%) and France (22.9%).
- Top languages spoken are English (37.5%) followed by French (16.7%).
- A significant demographic segment is the Post-2000s (Gen Z/Alpha) group, representing 50% of guests.
Recommendations for Hosts
- Focus marketing internationally, particularly towards travelers from France.
- Tailor amenities and listing descriptions to appeal to the dominant Post-2000s (Gen Z/Alpha) demographic (e.g., highlight fast WiFi, smart home features, local guides).
- Highlight unique local experiences or amenities relevant to the primary guest profile.
- Consider seasonal promotions aligned with peak travel times for key origin markets.
Nearby Short-Term Rental Market Comparison
How does the Iglesias Airbnb market stack up against its neighbors? Compare key performance metrics like average monthly revenue, ADR, and occupancy rates in surrounding areas to understand the broader regional STR landscape.
| Market | Active Properties | Monthly Revenue | Daily Rate | Avg. Occupancy |
|---|---|---|---|---|
| Maracalagonis | 285 | $2,096 | $302.75 | 46% |
| Sarrocu/Sarroch | 92 | $1,796 | $228.04 | 43% |
| Castiadas | 185 | $1,705 | $225.34 | 46% |
| Figari/Golfo Aranci | 395 | $1,645 | $247.08 | 46% |
| Santu Diadòru/San Teodoro | 924 | $1,550 | $251.11 | 45% |
| Olbia | 1,988 | $1,402 | $209.04 | 44% |
| Sìnnia/Sinnai | 184 | $1,383 | $194.38 | 42% |
| Loiri-Poltu Santu Paolu/Loiri Porto San Paolo | 409 | $1,382 | $204.76 | 46% |
| Crabonaxa/Villasimius | 858 | $1,327 | $218.91 | 44% |
| Domus De Maria | 306 | $1,316 | $193.99 | 45% |