Bugerru/Buggerru Airbnb Market Analysis 2025: Short Term Rental Data & Vacation Rental Statistics in Sardinia, Italy
Is Airbnb profitable in Bugerru/Buggerru in 2025? Explore comprehensive Airbnb analytics for Bugerru/Buggerru, Sardinia, Italy to uncover income potential. This 2025 STR market report for Bugerru/Buggerru, based on AirROI data from April 2024 to March 2025, reveals key trends in the niche market of 41 active listings.
Whether you're considering an Airbnb investment in Bugerru/Buggerru, optimizing your existing vacation rental, or exploring rental arbitrage opportunities, understanding the Bugerru/Buggerru Airbnb data is crucial. Navigating the high regulation landscape is key to maximizing your short term rental income potential. Let's dive into the specifics.
Key Bugerru/Buggerru Airbnb Performance Metrics Overview
Monthly Airbnb Revenue Variations & Income Potential in Bugerru/Buggerru (2025)
Understanding the monthly revenue variations for Airbnb listings in Bugerru/Buggerru is key to maximizing your short term rental income potential. Seasonality significantly impacts earnings. Our analysis, based on data from the past 12 months, shows that the peak revenue month for STRs in Bugerru/Buggerru is typically August, while April often presents the lowest earnings, highlighting opportunities for strategic pricing adjustments during shoulder and low seasons. Explore the typical Airbnb income in Bugerru/Buggerru across different performance tiers:
- Best-in-class properties (Top 10%) achieve $1,848+ monthly, often utilizing dynamic pricing and superior guest experiences.
- Strong performing properties (Top 25%) earn $1,094 or more, indicating effective management and desirable locations/amenities.
- Typical properties (Median) generate around $750 per month, representing the average market performance.
- Entry-level properties (Bottom 25%) see earnings around $441, often with potential for optimization.
Average Monthly Airbnb Earnings Trend in Bugerru/Buggerru
Bugerru/Buggerru Airbnb Occupancy Rate Trends (2025)
Maximize your bookings by understanding the Bugerru/Buggerru STR occupancy trends. Seasonal demand shifts significantly influence how often properties are booked. Typically, Augustsees the highest demand (peak season occupancy), while February experiences the lowest (low season). Effective strategies, like adjusting minimum stays or offering promotions, can boost occupancy during slower periods. Here's how different property tiers perform in Bugerru/Buggerru:
- Best-in-class properties (Top 10%) achieve 56%+ occupancy, indicating high desirability and potentially optimized availability.
- Strong performing properties (Top 25%) maintain 42% or higher occupancy, suggesting good market fit and guest satisfaction.
- Typical properties (Median) have an occupancy rate around 28%.
- Entry-level properties (Bottom 25%) average 14% occupancy, potentially facing higher vacancy.
Average Monthly Occupancy Rate Trend in Bugerru/Buggerru
Average Daily Rate (ADR) Airbnb Trends in Bugerru/Buggerru (2025)
Effective short term rental pricing strategy in Bugerru/Buggerru involves understanding monthly ADR fluctuations. The Average Daily Rate (ADR) for Airbnb in Bugerru/Buggerru typically peaks in November and dips lowest during April. Leveraging Airbnb dynamic pricing tools or strategies based on this seasonality can significantly boost revenue. Here's a look at the typical nightly rates achieved:
- Best-in-class properties (Top 10%) command rates of $196+ per night, often due to premium features or locations.
- Strong performing properties (Top 25%) achieve nightly rates of $111 or more.
- Typical properties (Median) charge around $83 per night.
- Entry-level properties (Bottom 25%) earn around $64 per night.
Average Daily Rate (ADR) Trend by Month in Bugerru/Buggerru
Get Live Bugerru/Buggerru Market Intelligence 👇

Explore Real-time Analytics
Airbnb Seasonality Analysis & Trends in Bugerru/Buggerru (2025)
Peak Season (August, July, June)
- Revenue averages $1,747 per month
- Occupancy rates average 47.1%
- Daily rates average $115
Shoulder Season
- Revenue averages $738 per month
- Occupancy maintains around 27.3%
- Daily rates hold near $112
Low Season (January, February, April)
- Revenue drops to average $415 per month
- Occupancy decreases to average 19.0%
- Daily rates adjust to average $112
Seasonality Insights for Bugerru/Buggerru
- The Airbnb seasonality in Bugerru/Buggerru shows highly seasonal trends requiring careful strategy. While the sections above show seasonal averages, it's also insightful to look at the extremes:
- During the high season, the absolute peak month showcases Bugerru/Buggerru's highest earning potential, with monthly revenues capable of climbing to $2,119, occupancy reaching a high of 61.1%, and ADRs peaking at $123.
- Conversely, the slowest single month of the year, typically falling within the low season, marks the market's lowest point. In this month, revenue might dip to $403, occupancy could drop to 15.6%, and ADRs may adjust down to $102.
- Understanding both the seasonal averages and these monthly peaks and troughs in revenue, occupancy, and ADR is crucial for maximizing your Airbnb profit potential in Bugerru/Buggerru.
Seasonal Strategies for Maximizing Profit
- Peak Season: Maximize revenue through premium pricing and potentially longer minimum stays. Ensure high availability.
- Low Season: Offer competitive pricing, special promotions (e.g., extended stay discounts), and flexible cancellation policies. Target off-season travelers like remote workers or budget-conscious guests.
- Shoulder Seasons: Implement dynamic pricing that balances peak and low rates. Target weekend travelers or specific events. Offer slightly more flexible terms than peak season.
- Regularly analyze your own performance against these Bugerru/Buggerru seasonality benchmarks and adjust your pricing and availability strategy accordingly.
Best Areas for Airbnb Investment in Bugerru/Buggerru (2025)
Exploring the top neighborhoods for short-term rentals in Bugerru/Buggerru? This section highlights key areas, outlining why they are attractive for hosts and guests, along with notable local attractions. Consider these locations based on your target guest profile and investment strategy.
| Neighborhood / Area | Why Host Here? (Target Guests & Appeal) | Key Attractions & Landmarks |
|---|---|---|
| Bugerru Beach | Beautiful sandy beach known for its clear waters and stunning views. Ideal for tourists looking to relax by the sea and enjoy water activities. | BugerruSpiaggia, Scogliera di Bugerru, Local seafood restaurants, Beach clubs, Water sports activities |
| Historical Old Town | Charming part of Bugerru with historical architecture and a laid-back vibe. Perfect for visitors interested in culture, history, and local traditions. | Old Town Streets, Museo del Mare, Local artisan shops, Traditional Sardinian restaurants, Cultural festivals |
| Sant'Antioco Island | Nearby island known for its rich history and beautiful landscapes. Popular for tourists seeking a bit of adventure and exploration away from the main town. | Sant'Antioco beaches, Archaeological Museum, Nora ancient ruins, Hiking trails, Local wine tasting |
| Calasetta | A picturesque fishing village close to Bugerru. Offers unique local culture and is ideal for those looking for a quiet retreat. | Calasetta Beach, Local fish market, Historical lighthouse, Cultural events, Traditional Sardinian cuisine |
| Sardinia's Mining History | Area known for its historical mines and industrial heritage. Interesting for tourists wanting to learn about the local mining history. | Mine of Montevecchio, Museo Mineralogico, Guided mine tours, Panoramic views, Nature trails |
| Portoscuso | A small coastal town that serves as a gateway to the beautiful beaches of the southern coast. Ideal for families and beach lovers. | Portoscuso beach, Local markets, Boat excursions, Historical landmarks, Family-friendly activities |
| Carbonia | Nearby town known for its coal mining history and cultural sites. Attracts visitors interested in history and local culture. | Carbonia Historical Museum, Church of Santa Maria di Bacu Abis, Cultural events, Local film festivals, Art galleries |
| Dune di Piscinas | Natural reserve with stunning sand dunes and a unique landscape. Perfect for nature lovers and those seeking tranquility. | Dune beaches, Wildlife watching, Nature walks, Photography opportunities, Picnic spots |
Understanding Airbnb License Requirements & STR Laws in Bugerru/Buggerru (2025)
Yes, Bugerru/Buggerru, Sardinia, Italy enforces high STR regulations. Obtaining a license and ensuring compliance is almost certainly required according to current 2025 STR laws. Always verify the latest short term rental regulations and Airbnb license requirements directly with local government authorities for Bugerru/Buggerru to ensure full compliance before hosting.
(Source: AirROI data, 2025, based on 41% licensed listings)
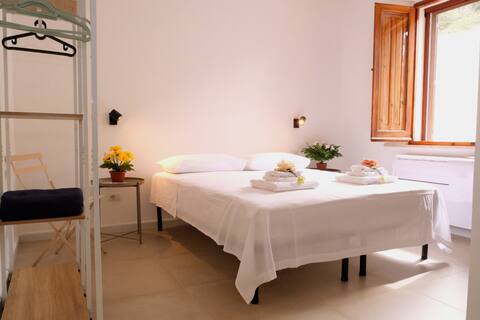
Top Performing Airbnb Properties in Bugerru/Buggerru (2025)
Benchmark your potential! Explore examples of top-performing Airbnb properties in Bugerru/Buggerrubased on Trailing Twelve Month (TTM) revenue. Analyze their characteristics, revenue, occupancy rate, and ADR to understand what drives success in this market.
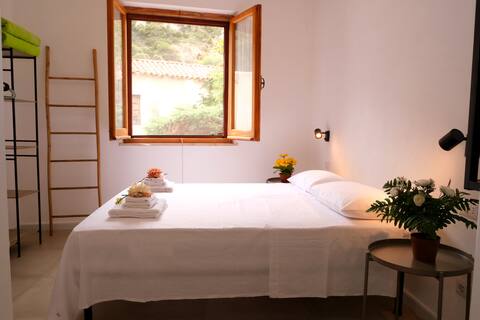
Sunset Beach Cottage 1/Brand New
Entire Place • 1 bedroom
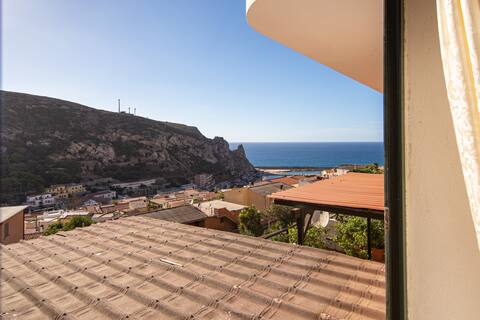
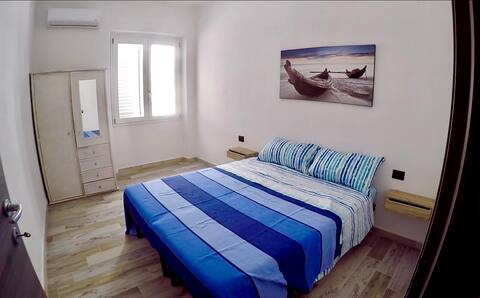
Appartamento Panoramico sul Mare
Entire Place • 2 bedrooms
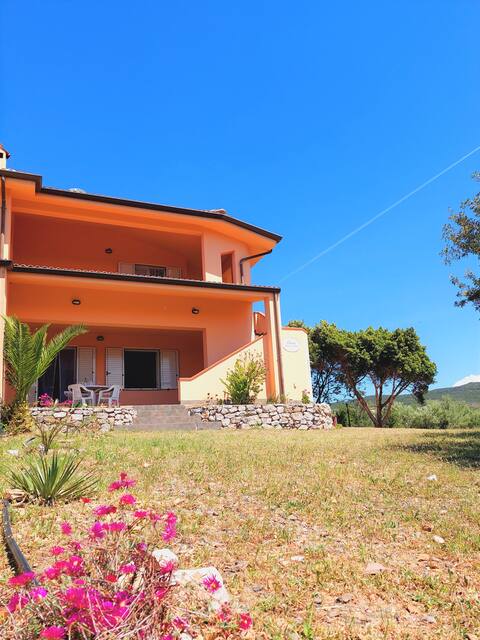
Casa Mamà (pt)
Entire Place • 1 bedroom
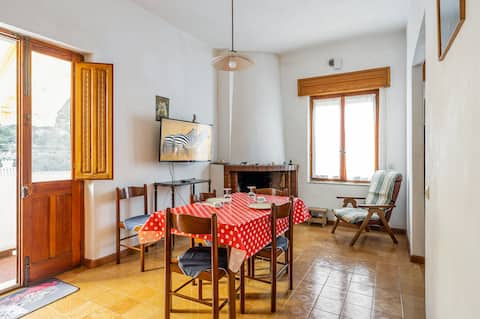
Spiaggia di Buggerru-Roomy Apartment with Balcony!
Entire Place • 3 bedrooms
Sunset Beach Cottage 2/Brand New
Entire Place • 1 bedroom
Apartment Buggerru *** Air-conditioned
Entire Place ��• 1 bedroom
Note: Performance varies based on location, size, amenities, seasonality, and management quality. Data reflects the past 12 months.
Top Performing Airbnb Hosts in Bugerru/Buggerru (2025)
Learn from the best! This table showcases top-performing Airbnb hosts in Bugerru/Buggerru based on the number of properties managed and estimated total revenue over the past year. Analyze their scale and performance metrics.
| Host Name | Properties | Grossing Revenue | Stay Reviews | Avg Rating |
|---|---|---|---|---|
| Stuart | 3 | $38,815 | 15 | 3.02/5.0 |
| Federica | 3 | $21,487 | 32 | 3.01/5.0 |
| Host #469063834 | 1 | $14,368 | 0 | 0.00/5.0 |
| Host #253884899 | 1 | $14,070 | 1 | 0.00/5.0 |
| Welcome To Italy | 1 | $13,128 | 5 | 4.40/5.0 |
| Cenza | 3 | $11,690 | 14 | 3.15/5.0 |
| Diego | 1 | $11,283 | 37 | 4.68/5.0 |
| Francesco | 1 | $10,784 | 43 | 4.93/5.0 |
| Host #6412212 | 2 | $10,718 | 19 | 4.15/5.0 |
| Host #431989288 | 1 | $10,435 | 2 | 0.00/5.0 |
Analyzing the strategies of top hosts, such as their property selection, pricing, and guest communication, can offer valuable lessons for optimizing your own Airbnb operations in Bugerru/Buggerru.
Dive Deeper: Advanced Bugerru/Buggerru STR Market Data (2025)
Ready to unlock more insights? AirROI provides access to advanced metrics and comprehensive Airbnb data for Bugerru/Buggerru. Explore detailed analytics beyond this report to refine your investment strategy, optimize pricing, and maximize your vacation rental profits.
Explore Advanced MetricsBugerru/Buggerru Short-Term Rental Market Composition (2025): Property & Room Types
Room Type Distribution
Property Type Distribution
Market Composition Insights for Bugerru/Buggerru
- The Bugerru/Buggerru Airbnb market composition is heavily skewed towards Entire Home/Apt listings, which make up 97.6% of the 41 active rentals. This indicates strong guest preference for privacy and space.
- Looking at the property type distribution in Bugerru/Buggerru, Apartment/Condo properties are the most common (61%), reflecting the local real estate landscape.
- Houses represent a significant 36.6% portion, catering likely to families or larger groups.
- Smaller segments like hotel/boutique (combined 2.4%) offer potential for unique stay experiences.
Bugerru/Buggerru Airbnb Room Capacity Analysis (2025): Bedroom Distribution
Distribution of Listings by Number of Bedrooms
Room Capacity Insights for Bugerru/Buggerru
- The dominant room capacity in Bugerru/Buggerru is 2 bedrooms listings, making up 51.2% of the market. This suggests a strong demand for properties suitable for couples or solo travelers.
- Together, 2 bedrooms and 1 bedroom properties represent 87.8% of the active Airbnb listings in Bugerru/Buggerru, indicating a high concentration in these sizes.
Bugerru/Buggerru Vacation Rental Guest Capacity Trends (2025)
Distribution of Listings by Guest Capacity
Guest Capacity Insights for Bugerru/Buggerru
- The most common guest capacity trend in Bugerru/Buggerru vacation rentals is listings accommodating 4 guests (46.3%). This suggests the primary traveler segment is likely small families or groups.
- Properties designed for 4 guests and 3 guests dominate the Bugerru/Buggerru STR market, accounting for 58.5% of listings.
- 17.1% of properties accommodate 6+ guests, serving the market segment for larger families or group travel in Bugerru/Buggerru.
- On average, properties in Bugerru/Buggerru are equipped to host 4.1 guests.
Bugerru/Buggerru Airbnb Booking Patterns (2025): Available vs. Booked Days
Available Days Distribution
Booked Days Distribution
Booking Pattern Insights for Bugerru/Buggerru
- The most common availability pattern in Bugerru/Buggerru falls within the 271-366 days range, representing 80.5% of listings. This suggests many properties have significant open periods on their calendars.
- Approximately 97.6% of listings show high availability (181+ days open annually), indicating potential for increased bookings or specific owner usage patterns.
- For booked days, the 31-90 days range is most frequent in Bugerru/Buggerru (39%), reflecting common guest stay durations or potential owner blocking patterns.
- A notable 2.4% of properties secure long booking periods (181+ days booked per year), highlighting successful long-term rental strategies or significant owner usage.
Bugerru/Buggerru Airbnb Minimum Stay Requirements Analysis
Distribution of Listings by Minimum Night Requirement
1 Night
4 listings
10.8% of total
2 Nights
4 listings
10.8% of total
3 Nights
6 listings
16.2% of total
4-6 Nights
11 listings
29.7% of total
7-29 Nights
10 listings
27% of total
30+ Nights
2 listings
5.4% of total
Key Insights
- The most prevalent minimum stay requirement in Bugerru/Buggerru is 4-6 Nights, adopted by 29.7% of listings. This highlights the market's preference for longer commitments.
Recommendations
- Align with the market by considering a 4-6 Nights minimum stay, as 29.7% of Bugerru/Buggerru hosts use this setting.
- If feasible, allowing 1-night stays, especially midweek or during low season, could capture last-minute bookings, as only 10.8% currently do.
- Explore offering discounts for stays of 30+ nights to attract the 5.4% of the market seeking extended stays.
- Adjust minimum nights based on seasonality – potentially shorter during low season and longer during peak demand periods in Bugerru/Buggerru.
Bugerru/Buggerru Airbnb Cancellation Policy Trends Analysis (2025)
Super Strict 60 Days
1 listings
3.3% of total
Flexible
5 listings
16.7% of total
Moderate
13 listings
43.3% of total
Strict
11 listings
36.7% of total
Cancellation Policy Insights for Bugerru/Buggerru
- The prevailing Airbnb cancellation policy trend in Bugerru/Buggerru is Moderate, used by 43.3% of listings.
- There's a relatively balanced mix between guest-friendly (60.0%) and stricter (36.7%) policies, offering choices for different guest needs.
Recommendations for Hosts
- Consider adopting a Moderate policy to align with the 43.3% market standard in Bugerru/Buggerru.
- With 36.7% using Strict terms, this is a viable option in Bugerru/Buggerru, particularly for high-value properties or during peak demand periods.
- Regularly review your cancellation policy against competitors and market demand shifts in Bugerru/Buggerru.
Bugerru/Buggerru STR Booking Lead Time Analysis (2025)
Average Booking Lead Time by Month
Booking Lead Time Insights for Bugerru/Buggerru
- The overall average booking lead time for vacation rentals in Bugerru/Buggerru is 61 days.
- Guests book furthest in advance for stays during July (average 89 days), likely coinciding with peak travel demand or local events.
- The shortest booking windows occur for stays in December (average 6 days), indicating more last-minute travel plans during this time.
- Seasonally, Summer (87 days avg.) sees the longest lead times, while Winter (28 days avg.) has the shortest, reflecting typical travel planning cycles.
Recommendations for Hosts
- Use the overall average lead time (61 days) as a baseline for your pricing and availability strategy in Bugerru/Buggerru.
- For July stays, consider implementing length-of-stay discounts or slightly higher rates for bookings made less than 89 days out to capitalize on advance planning.
- During December, focus on last-minute booking availability and promotions, as guests book with very short notice (6 days avg.).
- Target marketing efforts for the Summer season well in advance (at least 87 days) to capture early planners.
- Monitor your own booking lead times against these Bugerru/Buggerru averages to identify opportunities for dynamic pricing adjustments.
Popular & Essential Airbnb Amenities in Bugerru/Buggerru (2025)
Amenity Prevalence
Amenity Insights for Bugerru/Buggerru
- Essential amenities in Bugerru/Buggerru that guests expect include: Kitchen. Lacking these (this) could significantly impact bookings.
- Popular amenities like Hot water, Washer, TV are common but not universal. Offering these can provide a competitive edge.
Recommendations for Hosts
- Ensure your listing includes all essential amenities for Bugerru/Buggerru: Kitchen.
- Prioritize adding missing essentials: Kitchen.
- Consider adding popular differentiators like Hot water or Washer to increase appeal.
- Highlight unique or less common amenities you offer (e.g., hot tub, dedicated workspace, EV charger) in your listing description and photos.
- Regularly check competitor amenities in Bugerru/Buggerru to stay competitive.
Bugerru/Buggerru Airbnb Guest Demographics & Profile Analysis (2025)
Guest Profile Summary for Bugerru/Buggerru
- The typical guest profile for Airbnb in Bugerru/Buggerru consists of a mix of domestic (38%) and international guests, with top international origins including Germany, typically belonging to the Post-2000s (Gen Z/Alpha) group (50%), primarily speaking English or German.
- Domestic travelers account for 37.5% of guests.
- Key international markets include Italy (37.5%) and Germany (18.3%).
- Top languages spoken are English (40.6%) followed by German (18%).
- A significant demographic segment is the Post-2000s (Gen Z/Alpha) group, representing 50% of guests.
Recommendations for Hosts
- Focus marketing internationally, particularly towards travelers from Germany.
- Tailor amenities and listing descriptions to appeal to the dominant Post-2000s (Gen Z/Alpha) demographic (e.g., highlight fast WiFi, smart home features, local guides).
- Highlight unique local experiences or amenities relevant to the primary guest profile.
- Consider seasonal promotions aligned with peak travel times for key origin markets.
Nearby Short-Term Rental Market Comparison
How does the Bugerru/Buggerru Airbnb market stack up against its neighbors? Compare key performance metrics like average monthly revenue, ADR, and occupancy rates in surrounding areas to understand the broader regional STR landscape.
| Market | Active Properties | Monthly Revenue | Daily Rate | Avg. Occupancy |
|---|---|---|---|---|
| Maracalagonis | 285 | $2,096 | $302.75 | 46% |
| Sarrocu/Sarroch | 92 | $1,796 | $228.04 | 43% |
| Castiadas | 185 | $1,705 | $225.34 | 46% |
| Figari/Golfo Aranci | 395 | $1,645 | $247.08 | 46% |
| Santu Diadòru/San Teodoro | 924 | $1,550 | $251.11 | 45% |
| Olbia | 1,988 | $1,402 | $209.04 | 44% |
| Sìnnia/Sinnai | 184 | $1,383 | $194.38 | 42% |
| Loiri-Poltu Santu Paolu/Loiri Porto San Paolo | 409 | $1,382 | $204.76 | 46% |
| Crabonaxa/Villasimius | 858 | $1,327 | $218.91 | 44% |
| Domus De Maria | 306 | $1,316 | $193.99 | 45% |