Motta San Giovanni Airbnb Market Analysis 2025: Short Term Rental Data & Vacation Rental Statistics in Reggio Calabria, Italy
Is Airbnb profitable in Motta San Giovanni in 2025? Explore comprehensive Airbnb analytics for Motta San Giovanni, Reggio Calabria, Italy to uncover income potential. This 2025 STR market report for Motta San Giovanni, based on AirROI data from April 2024 to March 2025, reveals key trends in the niche market of 29 active listings.
Whether you're considering an Airbnb investment in Motta San Giovanni, optimizing your existing vacation rental, or exploring rental arbitrage opportunities, understanding the Motta San Giovanni Airbnb data is crucial. Navigating the high regulation landscape is key to maximizing your short term rental income potential. Let's dive into the specifics.
Key Motta San Giovanni Airbnb Performance Metrics Overview
Monthly Airbnb Revenue Variations & Income Potential in Motta San Giovanni (2025)
Understanding the monthly revenue variations for Airbnb listings in Motta San Giovanni is key to maximizing your short term rental income potential. Seasonality significantly impacts earnings. Our analysis, based on data from the past 12 months, shows that the peak revenue month for STRs in Motta San Giovanni is typically August, while January often presents the lowest earnings, highlighting opportunities for strategic pricing adjustments during shoulder and low seasons. Explore the typical Airbnb income in Motta San Giovanni across different performance tiers:
- Best-in-class properties (Top 10%) achieve $1,349+ monthly, often utilizing dynamic pricing and superior guest experiences.
- Strong performing properties (Top 25%) earn $917 or more, indicating effective management and desirable locations/amenities.
- Typical properties (Median) generate around $560 per month, representing the average market performance.
- Entry-level properties (Bottom 25%) see earnings around $268, often with potential for optimization.
Average Monthly Airbnb Earnings Trend in Motta San Giovanni
Motta San Giovanni Airbnb Occupancy Rate Trends (2025)
Maximize your bookings by understanding the Motta San Giovanni STR occupancy trends. Seasonal demand shifts significantly influence how often properties are booked. Typically, Augustsees the highest demand (peak season occupancy), while January experiences the lowest (low season). Effective strategies, like adjusting minimum stays or offering promotions, can boost occupancy during slower periods. Here's how different property tiers perform in Motta San Giovanni:
- Best-in-class properties (Top 10%) achieve 64%+ occupancy, indicating high desirability and potentially optimized availability.
- Strong performing properties (Top 25%) maintain 47% or higher occupancy, suggesting good market fit and guest satisfaction.
- Typical properties (Median) have an occupancy rate around 25%.
- Entry-level properties (Bottom 25%) average 13% occupancy, potentially facing higher vacancy.
Average Monthly Occupancy Rate Trend in Motta San Giovanni
Average Daily Rate (ADR) Airbnb Trends in Motta San Giovanni (2025)
Effective short term rental pricing strategy in Motta San Giovanni involves understanding monthly ADR fluctuations. The Average Daily Rate (ADR) for Airbnb in Motta San Giovanni typically peaks in July and dips lowest during February. Leveraging Airbnb dynamic pricing tools or strategies based on this seasonality can significantly boost revenue. Here's a look at the typical nightly rates achieved:
- Best-in-class properties (Top 10%) command rates of $122+ per night, often due to premium features or locations.
- Strong performing properties (Top 25%) achieve nightly rates of $79 or more.
- Typical properties (Median) charge around $59 per night.
- Entry-level properties (Bottom 25%) earn around $47 per night.
Average Daily Rate (ADR) Trend by Month in Motta San Giovanni
Get Live Motta San Giovanni Market Intelligence 👇

Explore Real-time Analytics
Airbnb Seasonality Analysis & Trends in Motta San Giovanni (2025)
Peak Season (August, July, June)
- Revenue averages $1,252 per month
- Occupancy rates average 47.3%
- Daily rates average $82
Shoulder Season
- Revenue averages $619 per month
- Occupancy maintains around 34.2%
- Daily rates hold near $76
Low Season (January, February, March)
- Revenue drops to average $364 per month
- Occupancy decreases to average 13.7%
- Daily rates adjust to average $73
Seasonality Insights for Motta San Giovanni
- The Airbnb seasonality in Motta San Giovanni shows highly seasonal trends requiring careful strategy. While the sections above show seasonal averages, it's also insightful to look at the extremes:
- During the high season, the absolute peak month showcases Motta San Giovanni's highest earning potential, with monthly revenues capable of climbing to $1,611, occupancy reaching a high of 56.9%, and ADRs peaking at $83.
- Conversely, the slowest single month of the year, typically falling within the low season, marks the market's lowest point. In this month, revenue might dip to $343, occupancy could drop to 10.8%, and ADRs may adjust down to $72.
- Understanding both the seasonal averages and these monthly peaks and troughs in revenue, occupancy, and ADR is crucial for maximizing your Airbnb profit potential in Motta San Giovanni.
Seasonal Strategies for Maximizing Profit
- Peak Season: Maximize revenue through premium pricing and potentially longer minimum stays. Ensure high availability.
- Low Season: Offer competitive pricing, special promotions (e.g., extended stay discounts), and flexible cancellation policies. Target off-season travelers like remote workers or budget-conscious guests.
- Shoulder Seasons: Implement dynamic pricing that balances peak and low rates. Target weekend travelers or specific events. Offer slightly more flexible terms than peak season.
- Regularly analyze your own performance against these Motta San Giovanni seasonality benchmarks and adjust your pricing and availability strategy accordingly.
Best Areas for Airbnb Investment in Motta San Giovanni (2025)
Exploring the top neighborhoods for short-term rentals in Motta San Giovanni? This section highlights key areas, outlining why they are attractive for hosts and guests, along with notable local attractions. Consider these locations based on your target guest profile and investment strategy.
| Neighborhood / Area | Why Host Here? (Target Guests & Appeal) | Key Attractions & Landmarks |
|---|---|---|
| Villa San Giovanni | Charming coastal town known for its ferry connections to Sicily and stunning sea views. Ideal for tourists looking to explore both Calabria and Sicily. | Ferry to Messina, Villa San Giovanni Beach, Chiesa di San Giovanni Battista, Punta Pezzo, Historical center of Villa San Giovanni |
| Reggio Calabria | The capital of the province, rich in history and culture. Great for those seeking to explore museums and archaeological sites. | National Archaeological Museum, Aragonese Castle, Cathedral of Reggio Calabria, Lungomare, Aspromonte National Park |
| Scilla | Famous for its beautiful beaches and the myth of the sea monster Scylla. Attracts beach lovers and those looking for a picturesque escape. | Scilla Beach, Chianalea district, Castle of Scilla, Lido Chianalea, Climbing and water sports |
| Taurianova | A small town with rich culinary traditions and a vibrant local culture, appealing to those looking for an authentic Italian experience. | Local markets, Gastronomic festivals, Historical sites, Church of San Bartolomeo, Hiking surroundings |
| Palmi | Known for its beaches and beautiful coastline, also hosts the famous Tarantella Festival, attracting cultural tourists. | Palmi Beach, Tarantella Festival, Sanctuary of Saint Roch, Mount Sant'Elia, Trekking trails |
| Bagnara Calabra | A quaint fishing village with beautiful views and great local cuisine, popular with tourists seeking a quieter atmosphere. | Bagnara Beach, Historical center, Fresh seafood restaurants, Tranquil walks, Vibrant local festivals |
| Aspromonte National Park | Stunning natural park with mountains and lush scenery, ideal for nature lovers and those seeking adventure. | Hiking trails, Flora and fauna, Waterfalls, Rural villages, Biodiversity |
| Montebello Ionico | Offers a mix of beach and mountain experiences, great for those wanting peace and quiet away from crowded tourist spots. | Beaches, Scenic viewpoints, Hiking paths, Historical ruins, Local wineries |
Understanding Airbnb License Requirements & STR Laws in Motta San Giovanni (2025)
Yes, Motta San Giovanni, Reggio Calabria, Italy enforces high STR regulations. Obtaining a license and ensuring compliance is almost certainly required according to current 2025 STR laws. Always verify the latest short term rental regulations and Airbnb license requirements directly with local government authorities for Motta San Giovanni to ensure full compliance before hosting.
(Source: AirROI data, 2025, based on 31% licensed listings)
Top Performing Airbnb Properties in Motta San Giovanni (2025)
Benchmark your potential! Explore examples of top-performing Airbnb properties in Motta San Giovannibased on Trailing Twelve Month (TTM) revenue. Analyze their characteristics, revenue, occupancy rate, and ADR to understand what drives success in this market.
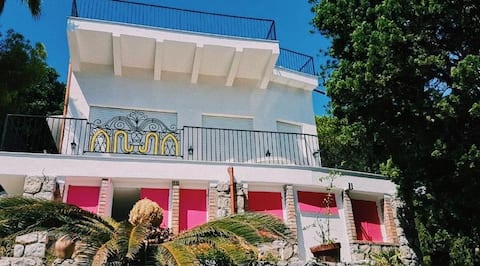
Detached villa with pool and access to the sea
Entire Place • 3 bedrooms
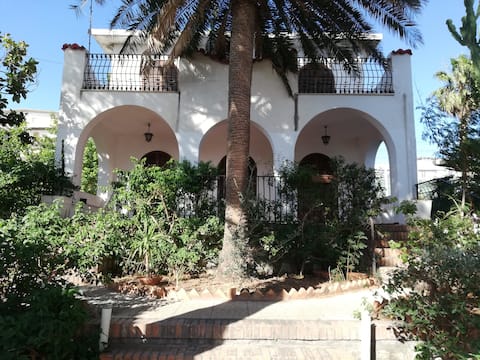
Villa Nina, Lungomare di Lazzaro (RC)
Entire Place • 4 bedrooms
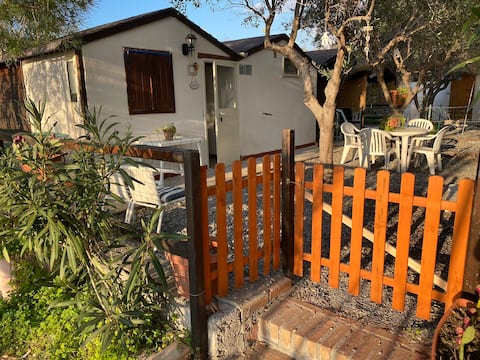
La melodia del mare in relax .GUEST HOUSE (WI.FI.)
Entire Place • 1 bedroom

Panoramic House
Entire Place • 2 bedrooms

Relaxing house on the sea of Bocale with orchard .
Entire Place • 1 bedroom

Corallo Blu Vacation Rental
Entire Place • 2 bedrooms
Note: Performance varies based on location, size, amenities, seasonality, and management quality. Data reflects the past 12 months.
Top Performing Airbnb Hosts in Motta San Giovanni (2025)
Learn from the best! This table showcases top-performing Airbnb hosts in Motta San Giovanni based on the number of properties managed and estimated total revenue over the past year. Analyze their scale and performance metrics.
| Host Name | Properties | Grossing Revenue | Stay Reviews | Avg Rating |
|---|---|---|---|---|
| Antonello | 4 | $31,636 | 407 | 4.86/5.0 |
| Ambra | 1 | $18,480 | 12 | 5.00/5.0 |
| Roberto | 1 | $14,065 | 14 | 4.86/5.0 |
| Consolato | 3 | $10,435 | 16 | 3.15/5.0 |
| Host #524258741 | 1 | $9,006 | 4 | 5.00/5.0 |
| Francesco | 1 | $7,905 | 18 | 5.00/5.0 |
| Host #346248317 | 1 | $5,669 | 20 | 4.95/5.0 |
| Chiara | 1 | $5,475 | 8 | 4.63/5.0 |
| Vincenzo | 1 | $5,120 | 18 | 4.78/5.0 |
| Host #468313127 | 2 | $4,996 | 2 | 0.00/5.0 |
Analyzing the strategies of top hosts, such as their property selection, pricing, and guest communication, can offer valuable lessons for optimizing your own Airbnb operations in Motta San Giovanni.
Dive Deeper: Advanced Motta San Giovanni STR Market Data (2025)
Ready to unlock more insights? AirROI provides access to advanced metrics and comprehensive Airbnb data for Motta San Giovanni. Explore detailed analytics beyond this report to refine your investment strategy, optimize pricing, and maximize your vacation rental profits.
Explore Advanced MetricsMotta San Giovanni Short-Term Rental Market Composition (2025): Property & Room Types
Room Type Distribution
Property Type Distribution
Market Composition Insights for Motta San Giovanni
- The Motta San Giovanni Airbnb market composition is heavily skewed towards Entire Home/Apt listings, which make up 100% of the 29 active rentals. This indicates strong guest preference for privacy and space.
- Looking at the property type distribution in Motta San Giovanni, Apartment/Condo properties are the most common (51.7%), reflecting the local real estate landscape.
- Houses represent a significant 48.3% portion, catering likely to families or larger groups.
Motta San Giovanni Airbnb Room Capacity Analysis (2025): Bedroom Distribution
Distribution of Listings by Number of Bedrooms
Room Capacity Insights for Motta San Giovanni
- The dominant room capacity in Motta San Giovanni is 1 bedroom listings, making up 55.2% of the market. This suggests a strong demand for properties suitable for couples or solo travelers.
- Together, 1 bedroom and 2 bedrooms properties represent 82.8% of the active Airbnb listings in Motta San Giovanni, indicating a high concentration in these sizes.
- With over half the market (55.2%) consisting of studios or 1-bedroom units, Motta San Giovanni is particularly well-suited for individuals or couples.
Motta San Giovanni Vacation Rental Guest Capacity Trends (2025)
Distribution of Listings by Guest Capacity
Guest Capacity Insights for Motta San Giovanni
- The most common guest capacity trend in Motta San Giovanni vacation rentals is listings accommodating 4 guests (37.9%). This suggests the primary traveler segment is likely small families or groups.
- Properties designed for 4 guests and 5 guests dominate the Motta San Giovanni STR market, accounting for 72.4% of listings.
- 10.2% of properties accommodate 6+ guests, serving the market segment for larger families or group travel in Motta San Giovanni.
- On average, properties in Motta San Giovanni are equipped to host 4.4 guests.
Motta San Giovanni Airbnb Booking Patterns (2025): Available vs. Booked Days
Available Days Distribution
Booked Days Distribution
Booking Pattern Insights for Motta San Giovanni
- The most common availability pattern in Motta San Giovanni falls within the 271-366 days range, representing 72.4% of listings. This suggests many properties have significant open periods on their calendars.
- Approximately 93.1% of listings show high availability (181+ days open annually), indicating potential for increased bookings or specific owner usage patterns.
- For booked days, the 31-90 days range is most frequent in Motta San Giovanni (48.3%), reflecting common guest stay durations or potential owner blocking patterns.
- A notable 6.9% of properties secure long booking periods (181+ days booked per year), highlighting successful long-term rental strategies or significant owner usage.
Motta San Giovanni Airbnb Minimum Stay Requirements Analysis
Distribution of Listings by Minimum Night Requirement
1 Night
7 listings
25.9% of total
2 Nights
6 listings
22.2% of total
4-6 Nights
4 listings
14.8% of total
7-29 Nights
8 listings
29.6% of total
30+ Nights
2 listings
7.4% of total
Key Insights
- The most prevalent minimum stay requirement in Motta San Giovanni is 7-29 Nights, adopted by 29.6% of listings. This highlights the market's preference for shorter, flexible bookings.
Recommendations
- Align with the market by considering a 7-29 Nights minimum stay, as 29.6% of Motta San Giovanni hosts use this setting.
- If feasible, allowing 1-night stays, especially midweek or during low season, could capture last-minute bookings, as only 25.9% currently do.
- Explore offering discounts for stays of 30+ nights to attract the 7.4% of the market seeking extended stays.
- Adjust minimum nights based on seasonality – potentially shorter during low season and longer during peak demand periods in Motta San Giovanni.
Motta San Giovanni Airbnb Cancellation Policy Trends Analysis (2025)
Flexible
4 listings
21.1% of total
Moderate
4 listings
21.1% of total
Strict
11 listings
57.9% of total
Cancellation Policy Insights for Motta San Giovanni
- The prevailing Airbnb cancellation policy trend in Motta San Giovanni is Strict, used by 57.9% of listings.
- A majority (57.9%) of hosts in Motta San Giovanni utilize Firm or Strict policies, indicating a market where hosts prioritize booking security.
Recommendations for Hosts
- Consider adopting a Strict policy to align with the 57.9% market standard in Motta San Giovanni.
- With 57.9% using Strict terms, this is a viable option in Motta San Giovanni, particularly for high-value properties or during peak demand periods.
- Regularly review your cancellation policy against competitors and market demand shifts in Motta San Giovanni.
Motta San Giovanni STR Booking Lead Time Analysis (2025)
Average Booking Lead Time by Month
Booking Lead Time Insights for Motta San Giovanni
- The overall average booking lead time for vacation rentals in Motta San Giovanni is 55 days.
- Guests book furthest in advance for stays during November (average 143 days), likely coinciding with peak travel demand or local events.
- The shortest booking windows occur for stays in February (average 2 days), indicating more last-minute travel plans during this time.
- Seasonally, Fall (106 days avg.) sees the longest lead times, while Winter (22 days avg.) has the shortest, reflecting typical travel planning cycles.
Recommendations for Hosts
- Use the overall average lead time (55 days) as a baseline for your pricing and availability strategy in Motta San Giovanni.
- For November stays, consider implementing length-of-stay discounts or slightly higher rates for bookings made less than 143 days out to capitalize on advance planning.
- During February, focus on last-minute booking availability and promotions, as guests book with very short notice (2 days avg.).
- Target marketing efforts for the Fall season well in advance (at least 106 days) to capture early planners.
- Monitor your own booking lead times against these Motta San Giovanni averages to identify opportunities for dynamic pricing adjustments.
Popular & Essential Airbnb Amenities in Motta San Giovanni (2025)
Amenity Prevalence
Amenity Insights for Motta San Giovanni
- Essential amenities in Motta San Giovanni that guests expect include: Kitchen, Washer, TV, Essentials. Lacking these (any) could significantly impact bookings.
- Popular amenities like Hot water, Air conditioning, Refrigerator are common but not universal. Offering these can provide a competitive edge.
Recommendations for Hosts
- Ensure your listing includes all essential amenities for Motta San Giovanni: Kitchen, Washer, TV, Essentials.
- Prioritize adding missing essentials: TV, Essentials.
- Consider adding popular differentiators like Hot water or Air conditioning to increase appeal.
- Highlight unique or less common amenities you offer (e.g., hot tub, dedicated workspace, EV charger) in your listing description and photos.
- Regularly check competitor amenities in Motta San Giovanni to stay competitive.
Motta San Giovanni Airbnb Guest Demographics & Profile Analysis (2025)
Guest Profile Summary for Motta San Giovanni
- The typical guest profile for Airbnb in Motta San Giovanni consists of predominantly international visitors (79%), with top international origins including Germany, typically belonging to the Post-2000s (Gen Z/Alpha) group (50%), primarily speaking English or French.
- Domestic travelers account for 21.1% of guests.
- Key international markets include Italy (21.1%) and Germany (19.7%).
- Top languages spoken are English (37.9%) followed by French (14.9%).
- A significant demographic segment is the Post-2000s (Gen Z/Alpha) group, representing 50% of guests.
Recommendations for Hosts
- Focus marketing internationally, particularly towards travelers from Germany.
- Tailor amenities and listing descriptions to appeal to the dominant Post-2000s (Gen Z/Alpha) demographic (e.g., highlight fast WiFi, smart home features, local guides).
- Highlight unique local experiences or amenities relevant to the primary guest profile.
- Consider seasonal promotions aligned with peak travel times for key origin markets.
Nearby Short-Term Rental Market Comparison
How does the Motta San Giovanni Airbnb market stack up against its neighbors? Compare key performance metrics like average monthly revenue, ADR, and occupancy rates in surrounding areas to understand the broader regional STR landscape.
| Market | Active Properties | Monthly Revenue | Daily Rate | Avg. Occupancy |
|---|---|---|---|---|
| Taormina | 973 | $2,450 | $221.38 | 47% |
| Għasri | 56 | $2,339 | $216.90 | 40% |
| Graniti | 20 | $2,135 | $168.67 | 47% |
| Torregrotta | 16 | $2,105 | $267.72 | 36% |
| Viagrande | 34 | $1,921 | $196.41 | 38% |
| Gaggi | 16 | $1,892 | $190.10 | 40% |
| Santa Venerina | 53 | $1,872 | $219.97 | 41% |
| Xewkija | 36 | $1,766 | $167.34 | 43% |
| Cefalù | 1,003 | $1,764 | $182.13 | 48% |
| San Marco d'Alunzio | 13 | $1,726 | $174.71 | 38% |