Torre Pellice Airbnb Market Analysis 2025: Short Term Rental Data & Vacation Rental Statistics in Piedmont, Italy
Is Airbnb profitable in Torre Pellice in 2025? Explore comprehensive Airbnb analytics for Torre Pellice, Piedmont, Italy to uncover income potential. This 2025 STR market report for Torre Pellice, based on AirROI data from April 2024 to March 2025, reveals key trends in the niche market of 25 active listings.
Whether you're considering an Airbnb investment in Torre Pellice, optimizing your existing vacation rental, or exploring rental arbitrage opportunities, understanding the Torre Pellice Airbnb data is crucial. Navigating the high regulation landscape is key to maximizing your short term rental income potential. Let's dive into the specifics.
Key Torre Pellice Airbnb Performance Metrics Overview
Monthly Airbnb Revenue Variations & Income Potential in Torre Pellice (2025)
Understanding the monthly revenue variations for Airbnb listings in Torre Pellice is key to maximizing your short term rental income potential. Seasonality significantly impacts earnings. Our analysis, based on data from the past 12 months, shows that the peak revenue month for STRs in Torre Pellice is typically August, while November often presents the lowest earnings, highlighting opportunities for strategic pricing adjustments during shoulder and low seasons. Explore the typical Airbnb income in Torre Pellice across different performance tiers:
- Best-in-class properties (Top 10%) achieve $1,935+ monthly, often utilizing dynamic pricing and superior guest experiences.
- Strong performing properties (Top 25%) earn $1,279 or more, indicating effective management and desirable locations/amenities.
- Typical properties (Median) generate around $835 per month, representing the average market performance.
- Entry-level properties (Bottom 25%) see earnings around $434, often with potential for optimization.
Average Monthly Airbnb Earnings Trend in Torre Pellice
Torre Pellice Airbnb Occupancy Rate Trends (2025)
Maximize your bookings by understanding the Torre Pellice STR occupancy trends. Seasonal demand shifts significantly influence how often properties are booked. Typically, Augustsees the highest demand (peak season occupancy), while March experiences the lowest (low season). Effective strategies, like adjusting minimum stays or offering promotions, can boost occupancy during slower periods. Here's how different property tiers perform in Torre Pellice:
- Best-in-class properties (Top 10%) achieve 80%+ occupancy, indicating high desirability and potentially optimized availability.
- Strong performing properties (Top 25%) maintain 64% or higher occupancy, suggesting good market fit and guest satisfaction.
- Typical properties (Median) have an occupancy rate around 42%.
- Entry-level properties (Bottom 25%) average 25% occupancy, potentially facing higher vacancy.
Average Monthly Occupancy Rate Trend in Torre Pellice
Average Daily Rate (ADR) Airbnb Trends in Torre Pellice (2025)
Effective short term rental pricing strategy in Torre Pellice involves understanding monthly ADR fluctuations. The Average Daily Rate (ADR) for Airbnb in Torre Pellice typically peaks in January and dips lowest during April. Leveraging Airbnb dynamic pricing tools or strategies based on this seasonality can significantly boost revenue. Here's a look at the typical nightly rates achieved:
- Best-in-class properties (Top 10%) command rates of $100+ per night, often due to premium features or locations.
- Strong performing properties (Top 25%) achieve nightly rates of $70 or more.
- Typical properties (Median) charge around $55 per night.
- Entry-level properties (Bottom 25%) earn around $44 per night.
Average Daily Rate (ADR) Trend by Month in Torre Pellice
Get Live Torre Pellice Market Intelligence 👇

Explore Real-time Analytics
Airbnb Seasonality Analysis & Trends in Torre Pellice (2025)
Peak Season (August, July, December)
- Revenue averages $1,236 per month
- Occupancy rates average 57.3%
- Daily rates average $64
Shoulder Season
- Revenue averages $965 per month
- Occupancy maintains around 43.5%
- Daily rates hold near $62
Low Season (February, March, November)
- Revenue drops to average $717 per month
- Occupancy decreases to average 36.5%
- Daily rates adjust to average $64
Seasonality Insights for Torre Pellice
- The Airbnb seasonality in Torre Pellice shows moderate seasonality with distinct peak and low periods. While the sections above show seasonal averages, it's also insightful to look at the extremes:
- During the high season, the absolute peak month showcases Torre Pellice's highest earning potential, with monthly revenues capable of climbing to $1,318, occupancy reaching a high of 68.0%, and ADRs peaking at $68.
- Conversely, the slowest single month of the year, typically falling within the low season, marks the market's lowest point. In this month, revenue might dip to $686, occupancy could drop to 34.2%, and ADRs may adjust down to $60.
- Understanding both the seasonal averages and these monthly peaks and troughs in revenue, occupancy, and ADR is crucial for maximizing your Airbnb profit potential in Torre Pellice.
Seasonal Strategies for Maximizing Profit
- Peak Season: Maximize revenue through premium pricing and potentially longer minimum stays. Ensure high availability.
- Low Season: Offer competitive pricing, special promotions (e.g., extended stay discounts), and flexible cancellation policies. Target off-season travelers like remote workers or budget-conscious guests.
- Shoulder Seasons: Implement dynamic pricing that balances peak and low rates. Target weekend travelers or specific events. Offer slightly more flexible terms than peak season.
- Regularly analyze your own performance against these Torre Pellice seasonality benchmarks and adjust your pricing and availability strategy accordingly.
Best Areas for Airbnb Investment in Torre Pellice (2025)
Exploring the top neighborhoods for short-term rentals in Torre Pellice? This section highlights key areas, outlining why they are attractive for hosts and guests, along with notable local attractions. Consider these locations based on your target guest profile and investment strategy.
| Neighborhood / Area | Why Host Here? (Target Guests & Appeal) | Key Attractions & Landmarks |
|---|---|---|
| Centro di Torre Pellice | The heart of Torre Pellice, filled with cafes, restaurants, and shops. A great spot for visitors who want to experience the local culture and cuisine. | Chiesa Valdese, Museo Valdese, Parco Comunale, Piazza Vittorio Emanuele II, Teatro Valdese |
| Val Pellice | A beautiful valley known for hiking and outdoor activities. Perfect for nature lovers and tourists seeking adventure. | Sentiero Ecomuseo, Monte San Giovanni, Parco Naturale del Monviso, Lago di Fenestrelle, Forte Fenestrelle |
| Angrogna | A picturesque village close to Torre Pellice, ideal for those looking for tranquility and nature. Great for families and hikers. | Chiesa di San Giovanni, Valli del Samone, Percorsi di trekking, Vista panoramica sul Monviso |
| Villafranca Piemonte | Nearby town with a charm of its own, great for exploring small-town Italy. Attracts visitors looking for authentic local experiences. | Castello di Villafranca, Mercato Settimanale, Chiesa Parrocchiale di San Pietro, Piazza della Libertà |
| Pinerolo | A larger town with a rich history, offering more amenities and attractions. Good for those who want a balance between city and countryside. | Piazza Vittorio Veneto, Museo Storico del Territorio Pinerolese, Duomo di San Donato, Palazzo del Giornale |
| Fenestrelle | Famous for the Forte di Fenestrelle, a historical fortress. Great for history buffs and tourists interested in military history. | Forte di Fenestrelle, Sentieri di Fenestrelle, Centro Storico di Fenestrelle |
| Sestriere | One of the most famous ski resorts in Italy, attracting winter sports enthusiasts and summer hikers alike. | Milky Way Ski Area, Golf Club Sestriere, Lago di Sestriere, Parco naturale della Val Chisone |
| Prali | A small alpine village perfect for year-round outdoor sports. Attracts adventure seekers and families looking for a quiet getaway. | Val Germanasca, Stazione Sciistica di Prali, Pista di Pattinaggio, Escursioni a piedi e in mountain bike |
Understanding Airbnb License Requirements & STR Laws in Torre Pellice (2025)
Yes, Torre Pellice, Piedmont, Italy enforces high STR regulations. Obtaining a license and ensuring compliance is almost certainly required according to current 2025 STR laws. Always verify the latest short term rental regulations and Airbnb license requirements directly with local government authorities for Torre Pellice to ensure full compliance before hosting.
(Source: AirROI data, 2025, based on 60% licensed listings)
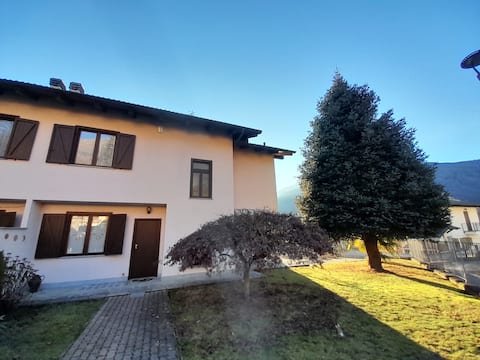
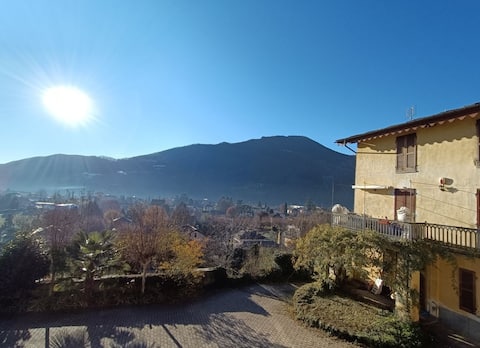
Top Performing Airbnb Properties in Torre Pellice (2025)
Benchmark your potential! Explore examples of top-performing Airbnb properties in Torre Pellicebased on Trailing Twelve Month (TTM) revenue. Analyze their characteristics, revenue, occupancy rate, and ADR to understand what drives success in this market.
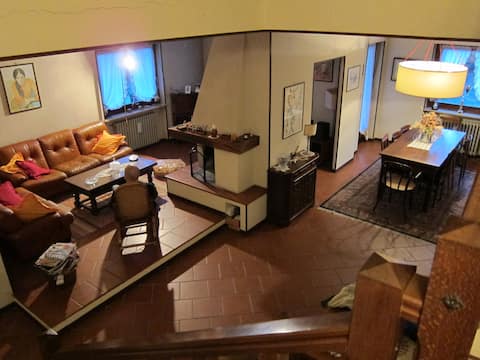
Large house within walking distance of downtown
Entire Place • 4 bedrooms

Casa Dante in Torre Pellice
Entire Place • 2 bedrooms
"Le tre Sorelle" holiday home
Entire Place • 3 bedrooms
Apartment in Villa Appia
Entire Place • N/A

The Bosco House
Entire Place • 3 bedrooms

Surrounded by greenery, overlooking the Valdese area.
Entire Place • 1 bedroom
Note: Performance varies based on location, size, amenities, seasonality, and management quality. Data reflects the past 12 months.
Top Performing Airbnb Hosts in Torre Pellice (2025)
Learn from the best! This table showcases top-performing Airbnb hosts in Torre Pellice based on the number of properties managed and estimated total revenue over the past year. Analyze their scale and performance metrics.
| Host Name | Properties | Grossing Revenue | Stay Reviews | Avg Rating |
|---|---|---|---|---|
| Marina | 2 | $26,742 | 74 | 4.85/5.0 |
| Monica | 1 | $17,071 | 21 | 5.00/5.0 |
| Adriana | 1 | $15,741 | 17 | 5.00/5.0 |
| Paola | 1 | $12,344 | 19 | 4.95/5.0 |
| Marco | 1 | $12,183 | 4 | 5.00/5.0 |
| Mara | 1 | $11,743 | 26 | 4.77/5.0 |
| Serena | 1 | $10,750 | 11 | 5.00/5.0 |
| Stefano | 1 | $10,678 | 58 | 4.84/5.0 |
| Sergio | 1 | $9,394 | 4 | 5.00/5.0 |
| Sandra | 1 | $9,088 | 113 | 4.83/5.0 |
Analyzing the strategies of top hosts, such as their property selection, pricing, and guest communication, can offer valuable lessons for optimizing your own Airbnb operations in Torre Pellice.
Dive Deeper: Advanced Torre Pellice STR Market Data (2025)
Ready to unlock more insights? AirROI provides access to advanced metrics and comprehensive Airbnb data for Torre Pellice. Explore detailed analytics beyond this report to refine your investment strategy, optimize pricing, and maximize your vacation rental profits.
Explore Advanced MetricsTorre Pellice Short-Term Rental Market Composition (2025): Property & Room Types
Room Type Distribution
Property Type Distribution
Market Composition Insights for Torre Pellice
- The Torre Pellice Airbnb market composition is heavily skewed towards Entire Home/Apt listings, which make up 100% of the 25 active rentals. This indicates strong guest preference for privacy and space.
- Looking at the property type distribution in Torre Pellice, Apartment/Condo properties are the most common (72%), reflecting the local real estate landscape.
- Houses represent a significant 16% portion, catering likely to families or larger groups.
- Smaller segments like others (combined 4.0%) offer potential for unique stay experiences.
Torre Pellice Airbnb Room Capacity Analysis (2025): Bedroom Distribution
Distribution of Listings by Number of Bedrooms
Room Capacity Insights for Torre Pellice
- The dominant room capacity in Torre Pellice is 1 bedroom listings, making up 44% of the market. This suggests a strong demand for properties suitable for couples or solo travelers.
- Together, 1 bedroom and 2 bedrooms properties represent 68.0% of the active Airbnb listings in Torre Pellice, indicating a high concentration in these sizes.
Torre Pellice Vacation Rental Guest Capacity Trends (2025)
Distribution of Listings by Guest Capacity
Guest Capacity Insights for Torre Pellice
- The most common guest capacity trend in Torre Pellice vacation rentals is listings accommodating 4 guests (44%). This suggests the primary traveler segment is likely small families or groups.
- Properties designed for 4 guests and 3 guests dominate the Torre Pellice STR market, accounting for 68.0% of listings.
- On average, properties in Torre Pellice are equipped to host 3.8 guests.
Torre Pellice Airbnb Booking Patterns (2025): Available vs. Booked Days
Available Days Distribution
Booked Days Distribution
Booking Pattern Insights for Torre Pellice
- The most common availability pattern in Torre Pellice falls within the 181-270 days range, representing 36% of listings. This suggests many properties have significant open periods on their calendars.
- Approximately 64.0% of listings show high availability (181+ days open annually), indicating potential for increased bookings or specific owner usage patterns.
- For booked days, the 91-180 days range is most frequent in Torre Pellice (40%), reflecting common guest stay durations or potential owner blocking patterns.
- A notable 36.0% of properties secure long booking periods (181+ days booked per year), highlighting successful long-term rental strategies or significant owner usage.
Torre Pellice Airbnb Minimum Stay Requirements Analysis
Distribution of Listings by Minimum Night Requirement
1 Night
7 listings
31.8% of total
2 Nights
7 listings
31.8% of total
3 Nights
3 listings
13.6% of total
7-29 Nights
4 listings
18.2% of total
30+ Nights
1 listings
4.5% of total
Key Insights
- The most prevalent minimum stay requirement in Torre Pellice is 1 Night, adopted by 31.8% of listings. This highlights the market's preference for shorter, flexible bookings.
- A strong majority (63.6%) of the Torre Pellice Airbnb data shows acceptance of very short stays (1-2 nights), indicating a dynamic, high-turnover market.
Recommendations
- Align with the market by considering a 1 Night minimum stay, as 31.8% of Torre Pellice hosts use this setting.
- Adjust minimum nights based on seasonality – potentially shorter during low season and longer during peak demand periods in Torre Pellice.
Torre Pellice Airbnb Cancellation Policy Trends Analysis (2025)
Flexible
10 listings
47.6% of total
Moderate
10 listings
47.6% of total
Strict
1 listings
4.8% of total
Cancellation Policy Insights for Torre Pellice
- The prevailing Airbnb cancellation policy trend in Torre Pellice is Flexible, used by 47.6% of listings.
- The market strongly favors guest-friendly terms, with 95.2% of listings offering Flexible or Moderate policies. This suggests guests in Torre Pellice may expect booking flexibility.
- Strict cancellation policies are quite rare (4.8%), potentially making listings with this policy less competitive unless justified by high demand or property type.
Recommendations for Hosts
- Consider adopting a Flexible policy to align with the 47.6% market standard in Torre Pellice.
- Using a Strict policy might deter some guests, as only 4.8% of listings use it. Evaluate if potential revenue protection outweighs possible lower booking rates.
- Regularly review your cancellation policy against competitors and market demand shifts in Torre Pellice.
Torre Pellice STR Booking Lead Time Analysis (2025)
Average Booking Lead Time by Month
Booking Lead Time Insights for Torre Pellice
- The overall average booking lead time for vacation rentals in Torre Pellice is 40 days.
- Guests book furthest in advance for stays during August (average 65 days), likely coinciding with peak travel demand or local events.
- The shortest booking windows occur for stays in February (average 18 days), indicating more last-minute travel plans during this time.
- Seasonally, Summer (57 days avg.) sees the longest lead times, while Winter (25 days avg.) has the shortest, reflecting typical travel planning cycles.
Recommendations for Hosts
- Use the overall average lead time (40 days) as a baseline for your pricing and availability strategy in Torre Pellice.
- For August stays, consider implementing length-of-stay discounts or slightly higher rates for bookings made less than 65 days out to capitalize on advance planning.
- Target marketing efforts for the Summer season well in advance (at least 57 days) to capture early planners.
- Monitor your own booking lead times against these Torre Pellice averages to identify opportunities for dynamic pricing adjustments.
Popular & Essential Airbnb Amenities in Torre Pellice (2025)
Amenity Prevalence
Amenity Insights for Torre Pellice
- Essential amenities in Torre Pellice that guests expect include: Kitchen. Lacking these (this) could significantly impact bookings.
- Popular amenities like Hot water, Dishes and silverware, Free parking on premises are common but not universal. Offering these can provide a competitive edge.
Recommendations for Hosts
- Ensure your listing includes all essential amenities for Torre Pellice: Kitchen.
- Consider adding popular differentiators like Hot water or Dishes and silverware to increase appeal.
- Highlight unique or less common amenities you offer (e.g., hot tub, dedicated workspace, EV charger) in your listing description and photos.
- Regularly check competitor amenities in Torre Pellice to stay competitive.
Torre Pellice Airbnb Guest Demographics & Profile Analysis (2025)
Guest Profile Summary for Torre Pellice
- The typical guest profile for Airbnb in Torre Pellice consists of a mix of domestic (40%) and international guests, with top international origins including France, typically belonging to the Post-2000s (Gen Z/Alpha) group (50%), primarily speaking English or Italian.
- Domestic travelers account for 39.7% of guests.
- Key international markets include Italy (39.7%) and France (19.8%).
- Top languages spoken are English (33.1%) followed by Italian (26.3%).
- A significant demographic segment is the Post-2000s (Gen Z/Alpha) group, representing 50% of guests.
Recommendations for Hosts
- Focus marketing internationally, particularly towards travelers from France.
- Tailor amenities and listing descriptions to appeal to the dominant Post-2000s (Gen Z/Alpha) demographic (e.g., highlight fast WiFi, smart home features, local guides).
- Highlight unique local experiences or amenities relevant to the primary guest profile.
- Consider seasonal promotions aligned with peak travel times for key origin markets.
Nearby Short-Term Rental Market Comparison
How does the Torre Pellice Airbnb market stack up against its neighbors? Compare key performance metrics like average monthly revenue, ADR, and occupancy rates in surrounding areas to understand the broader regional STR landscape.
| Market | Active Properties | Monthly Revenue | Daily Rate | Avg. Occupancy |
|---|---|---|---|---|
| Les Clefs | 30 | $5,741 | $323.11 | 44% |
| Monteu Roero | 16 | $4,432 | $540.14 | 36% |
| Manigod | 194 | $4,127 | $427.80 | 40% |
| Ramatuelle | 213 | $3,891 | $670.10 | 41% |
| Saint-Jean-Cap-Ferrat | 107 | $3,844 | $424.21 | 46% |
| Cossano Belbo | 13 | $3,632 | $284.21 | 42% |
| Saint-Tropez | 742 | $3,498 | $506.57 | 41% |
| Saint-Nicolas-la-Chapelle | 27 | $3,381 | $375.70 | 43% |
| Cassinasco | 18 | $3,219 | $545.40 | 41% |
| Charvonnex | 11 | $3,212 | $228.03 | 56% |