Pella Airbnb Market Analysis 2025: Short Term Rental Data & Vacation Rental Statistics in Piedmont, Italy
Is Airbnb profitable in Pella in 2025? Explore comprehensive Airbnb analytics for Pella, Piedmont, Italy to uncover income potential. This 2025 STR market report for Pella, based on AirROI data from April 2024 to March 2025, reveals key trends in the niche market of 22 active listings.
Whether you're considering an Airbnb investment in Pella, optimizing your existing vacation rental, or exploring rental arbitrage opportunities, understanding the Pella Airbnb data is crucial. Navigating the high regulation landscape is key to maximizing your short term rental income potential. Let's dive into the specifics.
Key Pella Airbnb Performance Metrics Overview
Monthly Airbnb Revenue Variations & Income Potential in Pella (2025)
Understanding the monthly revenue variations for Airbnb listings in Pella is key to maximizing your short term rental income potential. Seasonality significantly impacts earnings. Our analysis, based on data from the past 12 months, shows that the peak revenue month for STRs in Pella is typically July, while February often presents the lowest earnings, highlighting opportunities for strategic pricing adjustments during shoulder and low seasons. Explore the typical Airbnb income in Pella across different performance tiers:
- Best-in-class properties (Top 10%) achieve $2,791+ monthly, often utilizing dynamic pricing and superior guest experiences.
- Strong performing properties (Top 25%) earn $2,270 or more, indicating effective management and desirable locations/amenities.
- Typical properties (Median) generate around $1,350 per month, representing the average market performance.
- Entry-level properties (Bottom 25%) see earnings around $764, often with potential for optimization.
Average Monthly Airbnb Earnings Trend in Pella
Pella Airbnb Occupancy Rate Trends (2025)
Maximize your bookings by understanding the Pella STR occupancy trends. Seasonal demand shifts significantly influence how often properties are booked. Typically, Augustsees the highest demand (peak season occupancy), while March experiences the lowest (low season). Effective strategies, like adjusting minimum stays or offering promotions, can boost occupancy during slower periods. Here's how different property tiers perform in Pella:
- Best-in-class properties (Top 10%) achieve 68%+ occupancy, indicating high desirability and potentially optimized availability.
- Strong performing properties (Top 25%) maintain 54% or higher occupancy, suggesting good market fit and guest satisfaction.
- Typical properties (Median) have an occupancy rate around 31%.
- Entry-level properties (Bottom 25%) average 17% occupancy, potentially facing higher vacancy.
Average Monthly Occupancy Rate Trend in Pella
Average Daily Rate (ADR) Airbnb Trends in Pella (2025)
Effective short term rental pricing strategy in Pella involves understanding monthly ADR fluctuations. The Average Daily Rate (ADR) for Airbnb in Pella typically peaks in December and dips lowest during April. Leveraging Airbnb dynamic pricing tools or strategies based on this seasonality can significantly boost revenue. Here's a look at the typical nightly rates achieved:
- Best-in-class properties (Top 10%) command rates of $174+ per night, often due to premium features or locations.
- Strong performing properties (Top 25%) achieve nightly rates of $133 or more.
- Typical properties (Median) charge around $113 per night.
- Entry-level properties (Bottom 25%) earn around $99 per night.
Average Daily Rate (ADR) Trend by Month in Pella
Get Live Pella Market Intelligence 👇

Explore Real-time Analytics
Airbnb Seasonality Analysis & Trends in Pella (2025)
Peak Season (July, August, September)
- Revenue averages $2,519 per month
- Occupancy rates average 57.8%
- Daily rates average $129
Shoulder Season
- Revenue averages $1,527 per month
- Occupancy maintains around 34.1%
- Daily rates hold near $127
Low Season (February, March, December)
- Revenue drops to average $643 per month
- Occupancy decreases to average 21.0%
- Daily rates adjust to average $132
Seasonality Insights for Pella
- The Airbnb seasonality in Pella shows highly seasonal trends requiring careful strategy. While the sections above show seasonal averages, it's also insightful to look at the extremes:
- During the high season, the absolute peak month showcases Pella's highest earning potential, with monthly revenues capable of climbing to $2,927, occupancy reaching a high of 66.4%, and ADRs peaking at $134.
- Conversely, the slowest single month of the year, typically falling within the low season, marks the market's lowest point. In this month, revenue might dip to $524, occupancy could drop to 18.9%, and ADRs may adjust down to $121.
- Understanding both the seasonal averages and these monthly peaks and troughs in revenue, occupancy, and ADR is crucial for maximizing your Airbnb profit potential in Pella.
Seasonal Strategies for Maximizing Profit
- Peak Season: Maximize revenue through premium pricing and potentially longer minimum stays. Ensure high availability.
- Low Season: Offer competitive pricing, special promotions (e.g., extended stay discounts), and flexible cancellation policies. Target off-season travelers like remote workers or budget-conscious guests.
- Shoulder Seasons: Implement dynamic pricing that balances peak and low rates. Target weekend travelers or specific events. Offer slightly more flexible terms than peak season.
- Regularly analyze your own performance against these Pella seasonality benchmarks and adjust your pricing and availability strategy accordingly.
Best Areas for Airbnb Investment in Pella (2025)
Exploring the top neighborhoods for short-term rentals in Pella? This section highlights key areas, outlining why they are attractive for hosts and guests, along with notable local attractions. Consider these locations based on your target guest profile and investment strategy.
| Neighborhood / Area | Why Host Here? (Target Guests & Appeal) | Key Attractions & Landmarks |
|---|---|---|
| Historic Center of Pella | Charming historical area known for its picturesque architecture and rich cultural heritage. Attracts visitors looking to explore Italy's history and enjoy local cuisine. | Pella's Cathedral, Palazzo Comunale, Santa Maria della Consolazione, Local restaurants, Parks along the lake |
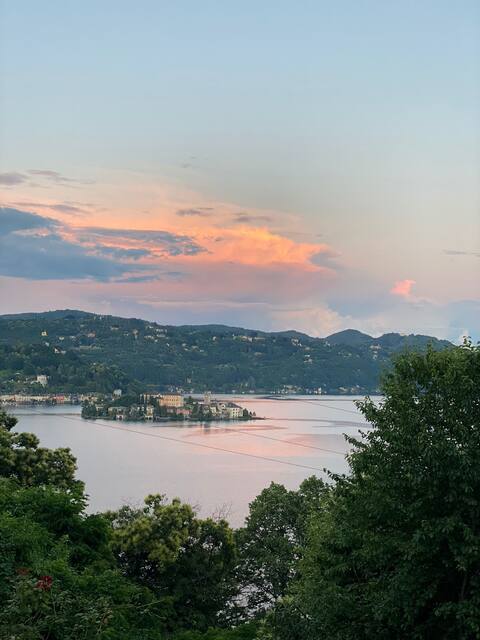
| Lake Orta | Stunning lakefront destination known for its scenic beauty and outdoor activities. Ideal for tourists interested in nature and relaxation. | Isola San Giulio, Orta San Giulio village, Hiking trails, Boating activities, Local vineyards |
| Monte Mottarone | Mountain area offering breathtaking views and various outdoor activities. A great spot for tourists looking for adventure and nature. | Cable car rides, Hiking routes, Skiing in winter, Picnic areas, Panoramic viewpoints |
| Arona | Nearby town with lakeside attractions and a vibrant atmosphere. Perfect for those wanting access to both nature and urban life. | Villa Ponti, Lakeside promenade, Local markets, Tourist shops, Restaurants with lake views |
| Sacro Monte di Orta | Historical pilgrimage site with significant cultural and spiritual importance. Attracts visitors for its ancient chapels and serene environment. | Chapels of Sacro Monte, St. Francis Church, Scenic views, Hiking paths, Cultural events |
| San Giulio Island | A quaint island on Lake Orta, known for its romantic ambiance and historical significance. Popular among couples and tourists seeking tranquility. | Basilica di San Giulio, Island walking paths, Local artisan shops, Dining options with lake views, Beautiful gardens |
| Vcollegno | A charming suburban area with easy access to urban amenities and historical sites. It's suitable for guests who want a quiet stay yet close to attractions. | Historical villas, Parks, Local cuisine, Art galleries, Proximity to transportation |
| Mottarone Ski Resort | Popular ski resort attracting winter sports enthusiasts and families. Great for year-round investment with summer hiking and winter sports. | Ski slopes, Snowboarding, Summer hiking trails, Lakeside activities, Family-friendly entertainment |
Understanding Airbnb License Requirements & STR Laws in Pella (2025)
Yes, Pella, Piedmont, Italy enforces high STR regulations. Obtaining a license and ensuring compliance is almost certainly required according to current 2025 STR laws. Always verify the latest short term rental regulations and Airbnb license requirements directly with local government authorities for Pella to ensure full compliance before hosting.
(Source: AirROI data, 2025, based on 64% licensed listings)
Top Performing Airbnb Properties in Pella (2025)
Benchmark your potential! Explore examples of top-performing Airbnb properties in Pellabased on Trailing Twelve Month (TTM) revenue. Analyze their characteristics, revenue, occupancy rate, and ADR to understand what drives success in this market.

180° on the lake
Entire Place • 1 bedroom
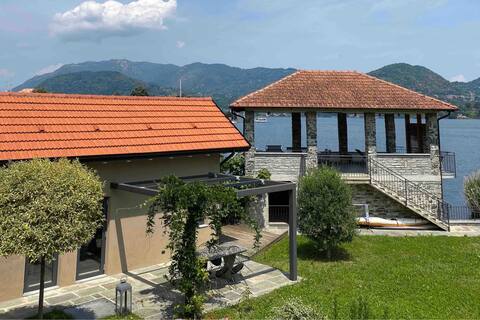
Luxury villa with spectacular views on lake Orta
Entire Place • 3 bedrooms
Loft on Lake Orta
Entire Place • 1 bedroom
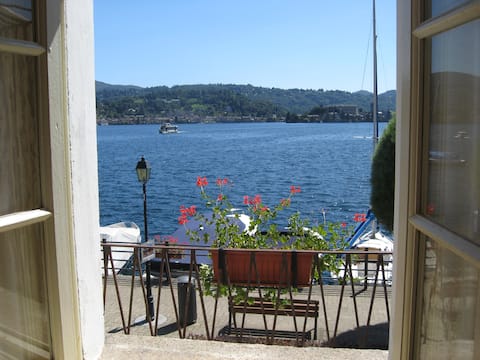
Casa Lungolago 20 - Lago d'Orta
Entire Place • 2 bedrooms
Orta lake. Suite. Patio with lake view and park
Private Room • 1 bedroom
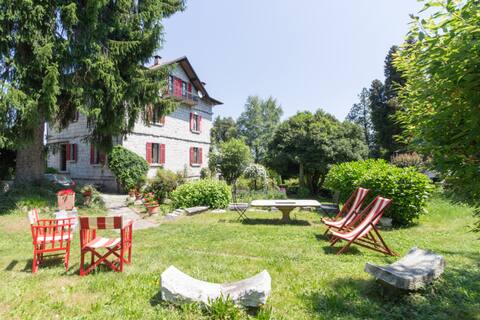
casa celeste
Entire Place • 1 bedroom
Note: Performance varies based on location, size, amenities, seasonality, and management quality. Data reflects the past 12 months.
Top Performing Airbnb Hosts in Pella (2025)
Learn from the best! This table showcases top-performing Airbnb hosts in Pella based on the number of properties managed and estimated total revenue over the past year. Analyze their scale and performance metrics.
| Host Name | Properties | Grossing Revenue | Stay Reviews | Avg Rating |
|---|---|---|---|---|
| Elena | 2 | $35,082 | 214 | 4.99/5.0 |
| Matteo | 1 | $29,785 | 41 | 5.00/5.0 |
| Gael | 1 | $25,821 | 15 | 4.87/5.0 |
| Matilde | 1 | $20,784 | 30 | 4.67/5.0 |
| Host #90836584 | 1 | $20,751 | 120 | 4.86/5.0 |
| Massimiliano | 2 | $20,725 | 8 | 3.56/5.0 |
| Alessandra | 2 | $20,529 | 120 | 4.89/5.0 |
| Piergiorgio | 1 | $18,928 | 79 | 4.99/5.0 |
| Vilma | 1 | $16,607 | 109 | 4.87/5.0 |
| Lena - Interhome Group | 1 | $15,800 | 12 | 4.83/5.0 |
Analyzing the strategies of top hosts, such as their property selection, pricing, and guest communication, can offer valuable lessons for optimizing your own Airbnb operations in Pella.
Dive Deeper: Advanced Pella STR Market Data (2025)
Ready to unlock more insights? AirROI provides access to advanced metrics and comprehensive Airbnb data for Pella. Explore detailed analytics beyond this report to refine your investment strategy, optimize pricing, and maximize your vacation rental profits.
Explore Advanced MetricsPella Short-Term Rental Market Composition (2025): Property & Room Types
Room Type Distribution
Property Type Distribution
Market Composition Insights for Pella
- The Pella Airbnb market composition is heavily skewed towards Entire Home/Apt listings, which make up 81.8% of the 22 active rentals. This indicates strong guest preference for privacy and space.
- Looking at the property type distribution in Pella, Apartment/Condo properties are the most common (40.9%), reflecting the local real estate landscape.
- Houses represent a significant 40.9% portion, catering likely to families or larger groups.
- Smaller segments like outdoor/unique, others, hotel/boutique, unique stays (combined 18.0%) offer potential for unique stay experiences.
Pella Airbnb Room Capacity Analysis (2025): Bedroom Distribution
Distribution of Listings by Number of Bedrooms
Room Capacity Insights for Pella
- The dominant room capacity in Pella is 1 bedroom listings, making up 54.5% of the market. This suggests a strong demand for properties suitable for couples or solo travelers.
- Together, 1 bedroom and 2 bedrooms properties represent 86.3% of the active Airbnb listings in Pella, indicating a high concentration in these sizes.
- With over half the market (54.5%) consisting of studios or 1-bedroom units, Pella is particularly well-suited for individuals or couples.
- Listings with 3+ bedrooms (9.1%) represent a smaller niche, potentially indicating an underserved market for larger group accommodations in Pella.
Pella Vacation Rental Guest Capacity Trends (2025)
Distribution of Listings by Guest Capacity
Guest Capacity Insights for Pella
- The most common guest capacity trend in Pella vacation rentals is listings accommodating 2 guests (36.4%). This suggests the primary traveler segment is likely couples or solo travelers.
- Properties designed for 2 guests and 4 guests dominate the Pella STR market, accounting for 68.2% of listings.
- 18.2% of properties accommodate 6+ guests, serving the market segment for larger families or group travel in Pella.
- On average, properties in Pella are equipped to host 3.4 guests.
Pella Airbnb Booking Patterns (2025): Available vs. Booked Days
Available Days Distribution
Booked Days Distribution
Booking Pattern Insights for Pella
- The most common availability pattern in Pella falls within the 181-270 days range, representing 45.5% of listings. This suggests many properties have significant open periods on their calendars.
- Approximately 91.0% of listings show high availability (181+ days open annually), indicating potential for increased bookings or specific owner usage patterns.
- For booked days, the 31-90 days range is most frequent in Pella (40.9%), reflecting common guest stay durations or potential owner blocking patterns.
- A notable 13.6% of properties secure long booking periods (181+ days booked per year), highlighting successful long-term rental strategies or significant owner usage.
Pella Airbnb Minimum Stay Requirements Analysis
Distribution of Listings by Minimum Night Requirement
1 Night
3 listings
15% of total
2 Nights
7 listings
35% of total
3 Nights
2 listings
10% of total
4-6 Nights
6 listings
30% of total
7-29 Nights
1 listings
5% of total
30+ Nights
1 listings
5% of total
Key Insights
- The most prevalent minimum stay requirement in Pella is 2 Nights, adopted by 35% of listings. This highlights the market's preference for shorter, flexible bookings.
Recommendations
- Align with the market by considering a 2 Nights minimum stay, as 35% of Pella hosts use this setting.
- If feasible, allowing 1-night stays, especially midweek or during low season, could capture last-minute bookings, as only 15% currently do.
- A 2-night minimum appears standard (35%). Consider this for weekends or peak periods.
- Adjust minimum nights based on seasonality – potentially shorter during low season and longer during peak demand periods in Pella.
Pella Airbnb Cancellation Policy Trends Analysis (2025)
Super Strict 30 Days
2 listings
9.5% of total
Flexible
2 listings
9.5% of total
Moderate
11 listings
52.4% of total
Strict
6 listings
28.6% of total
Cancellation Policy Insights for Pella
- The prevailing Airbnb cancellation policy trend in Pella is Moderate, used by 52.4% of listings.
- There's a relatively balanced mix between guest-friendly (61.9%) and stricter (28.6%) policies, offering choices for different guest needs.
Recommendations for Hosts
- Consider adopting a Moderate policy to align with the 52.4% market standard in Pella.
- Regularly review your cancellation policy against competitors and market demand shifts in Pella.
Pella STR Booking Lead Time Analysis (2025)
Average Booking Lead Time by Month
Booking Lead Time Insights for Pella
- The overall average booking lead time for vacation rentals in Pella is 71 days.
- Guests book furthest in advance for stays during October (average 110 days), likely coinciding with peak travel demand or local events.
- The shortest booking windows occur for stays in March (average 9 days), indicating more last-minute travel plans during this time.
- Seasonally, Fall (91 days avg.) sees the longest lead times, while Winter (46 days avg.) has the shortest, reflecting typical travel planning cycles.
Recommendations for Hosts
- Use the overall average lead time (71 days) as a baseline for your pricing and availability strategy in Pella.
- For October stays, consider implementing length-of-stay discounts or slightly higher rates for bookings made less than 110 days out to capitalize on advance planning.
- During March, focus on last-minute booking availability and promotions, as guests book with very short notice (9 days avg.).
- Target marketing efforts for the Fall season well in advance (at least 91 days) to capture early planners.
- Monitor your own booking lead times against these Pella averages to identify opportunities for dynamic pricing adjustments.
Popular & Essential Airbnb Amenities in Pella (2025)
Amenity Prevalence
Amenity Insights for Pella
- Essential amenities in Pella that guests expect include: Hangers, Heating, Hair dryer. Lacking these (any) could significantly impact bookings.
- Popular amenities like Refrigerator, Hot water, Bed linens are common but not universal. Offering these can provide a competitive edge.
- Warning: Wifi is not universally provided but is considered essential globally. Ensure reliable Wifi is offered.
Recommendations for Hosts
- Ensure your listing includes all essential amenities for Pella: Hangers, Heating, Hair dryer.
- Prioritize adding missing essentials: Hangers, Heating, Hair dryer.
- Consider adding popular differentiators like Refrigerator or Hot water to increase appeal.
- Highlight unique or less common amenities you offer (e.g., hot tub, dedicated workspace, EV charger) in your listing description and photos.
- Regularly check competitor amenities in Pella to stay competitive.
Pella Airbnb Guest Demographics & Profile Analysis (2025)
Guest Profile Summary for Pella
- The typical guest profile for Airbnb in Pella consists of predominantly international visitors (91%), with top international origins including France, typically belonging to the Post-2000s (Gen Z/Alpha) group (50%), primarily speaking English or German.
- Domestic travelers account for 9.2% of guests.
- Key international markets include Germany (21.5%) and France (16.9%).
- Top languages spoken are English (37.1%) followed by German (18%).
- A significant demographic segment is the Post-2000s (Gen Z/Alpha) group, representing 50% of guests.
Recommendations for Hosts
- Focus marketing internationally, particularly towards travelers from France.
- Tailor amenities and listing descriptions to appeal to the dominant Post-2000s (Gen Z/Alpha) demographic (e.g., highlight fast WiFi, smart home features, local guides).
- Highlight unique local experiences or amenities relevant to the primary guest profile.
- Consider seasonal promotions aligned with peak travel times for key origin markets.
Nearby Short-Term Rental Market Comparison
How does the Pella Airbnb market stack up against its neighbors? Compare key performance metrics like average monthly revenue, ADR, and occupancy rates in surrounding areas to understand the broader regional STR landscape.
| Market | Active Properties | Monthly Revenue | Daily Rate | Avg. Occupancy |
|---|---|---|---|---|
| Lauterbrunnen | 525 | $7,079 | $546.45 | 54% |
| Matten bei Interlaken | 52 | $5,674 | $316.63 | 63% |
| Iseltwald | 14 | $5,491 | $331.95 | 58% |
| Habkern | 13 | $5,382 | $344.74 | 50% |
| Interlaken | 288 | $4,987 | $310.52 | 56% |
| Grindelwald | 489 | $4,921 | $345.40 | 57% |
| Laglio | 64 | $4,873 | $463.61 | 47% |
| Zermatt | 734 | $4,604 | $463.00 | 46% |
| Oberhofen am Thunersee | 24 | $4,572 | $265.94 | 55% |
| Monteu Roero | 16 | $4,432 | $540.14 | 36% |