Paesana Airbnb Market Analysis 2025: Short Term Rental Data & Vacation Rental Statistics in Piedmont, Italy
Is Airbnb profitable in Paesana in 2025? Explore comprehensive Airbnb analytics for Paesana, Piedmont, Italy to uncover income potential. This 2025 STR market report for Paesana, based on AirROI data from April 2024 to March 2025, reveals key trends in the niche market of 18 active listings.
Whether you're considering an Airbnb investment in Paesana, optimizing your existing vacation rental, or exploring rental arbitrage opportunities, understanding the Paesana Airbnb data is crucial. Navigating the high regulation landscape is key to maximizing your short term rental income potential. Let's dive into the specifics.
Key Paesana Airbnb Performance Metrics Overview
Monthly Airbnb Revenue Variations & Income Potential in Paesana (2025)
Understanding the monthly revenue variations for Airbnb listings in Paesana is key to maximizing your short term rental income potential. Seasonality significantly impacts earnings. Our analysis, based on data from the past 12 months, shows that the peak revenue month for STRs in Paesana is typically May, while January often presents the lowest earnings, highlighting opportunities for strategic pricing adjustments during shoulder and low seasons. Explore the typical Airbnb income in Paesana across different performance tiers:
- Best-in-class properties (Top 10%) achieve $2,295+ monthly, often utilizing dynamic pricing and superior guest experiences.
- Strong performing properties (Top 25%) earn $1,044 or more, indicating effective management and desirable locations/amenities.
- Typical properties (Median) generate around $590 per month, representing the average market performance.
- Entry-level properties (Bottom 25%) see earnings around $281, often with potential for optimization.
Average Monthly Airbnb Earnings Trend in Paesana
Paesana Airbnb Occupancy Rate Trends (2025)
Maximize your bookings by understanding the Paesana STR occupancy trends. Seasonal demand shifts significantly influence how often properties are booked. Typically, Maysees the highest demand (peak season occupancy), while April experiences the lowest (low season). Effective strategies, like adjusting minimum stays or offering promotions, can boost occupancy during slower periods. Here's how different property tiers perform in Paesana:
- Best-in-class properties (Top 10%) achieve 62%+ occupancy, indicating high desirability and potentially optimized availability.
- Strong performing properties (Top 25%) maintain 37% or higher occupancy, suggesting good market fit and guest satisfaction.
- Typical properties (Median) have an occupancy rate around 20%.
- Entry-level properties (Bottom 25%) average 11% occupancy, potentially facing higher vacancy.
Average Monthly Occupancy Rate Trend in Paesana
Average Daily Rate (ADR) Airbnb Trends in Paesana (2025)
Effective short term rental pricing strategy in Paesana involves understanding monthly ADR fluctuations. The Average Daily Rate (ADR) for Airbnb in Paesana typically peaks in December and dips lowest during May. Leveraging Airbnb dynamic pricing tools or strategies based on this seasonality can significantly boost revenue. Here's a look at the typical nightly rates achieved:
- Best-in-class properties (Top 10%) command rates of $98+ per night, often due to premium features or locations.
- Strong performing properties (Top 25%) achieve nightly rates of $91 or more.
- Typical properties (Median) charge around $77 per night.
- Entry-level properties (Bottom 25%) earn around $64 per night.
Average Daily Rate (ADR) Trend by Month in Paesana
Get Live Paesana Market Intelligence 👇

Explore Real-time Analytics
Airbnb Seasonality Analysis & Trends in Paesana (2025)
Peak Season (May, August, July)
- Revenue averages $1,476 per month
- Occupancy rates average 45.4%
- Daily rates average $75
Shoulder Season
- Revenue averages $841 per month
- Occupancy maintains around 23.1%
- Daily rates hold near $78
Low Season (January, February, December)
- Revenue drops to average $687 per month
- Occupancy decreases to average 23.4%
- Daily rates adjust to average $85
Seasonality Insights for Paesana
- The Airbnb seasonality in Paesana shows highly seasonal trends requiring careful strategy. While the sections above show seasonal averages, it's also insightful to look at the extremes:
- During the high season, the absolute peak month showcases Paesana's highest earning potential, with monthly revenues capable of climbing to $2,092, occupancy reaching a high of 52.7%, and ADRs peaking at $87.
- Conversely, the slowest single month of the year, typically falling within the low season, marks the market's lowest point. In this month, revenue might dip to $676, occupancy could drop to 16.7%, and ADRs may adjust down to $75.
- Understanding both the seasonal averages and these monthly peaks and troughs in revenue, occupancy, and ADR is crucial for maximizing your Airbnb profit potential in Paesana.
Seasonal Strategies for Maximizing Profit
- Peak Season: Maximize revenue through premium pricing and potentially longer minimum stays. Ensure high availability.
- Low Season: Offer competitive pricing, special promotions (e.g., extended stay discounts), and flexible cancellation policies. Target off-season travelers like remote workers or budget-conscious guests.
- Shoulder Seasons: Implement dynamic pricing that balances peak and low rates. Target weekend travelers or specific events. Offer slightly more flexible terms than peak season.
- Regularly analyze your own performance against these Paesana seasonality benchmarks and adjust your pricing and availability strategy accordingly.
Best Areas for Airbnb Investment in Paesana (2025)
Exploring the top neighborhoods for short-term rentals in Paesana? This section highlights key areas, outlining why they are attractive for hosts and guests, along with notable local attractions. Consider these locations based on your target guest profile and investment strategy.
| Neighborhood / Area | Why Host Here? (Target Guests & Appeal) | Key Attractions & Landmarks |
|---|---|---|
| Centro Storico | The historic center of Paesana, known for its charming streets and authentic Italian atmosphere. A great spot for tourists looking to explore local culture and enjoy traditional cuisine. | Chiesa di San Giovanni Battista, Museo della Civiltà Contadina, Piazza IV Novembre, Local trattorias and gelaterias |
| Valle Po | A beautiful valley with stunning natural landscapes and hiking opportunities. Ideal for nature lovers and outdoor enthusiasts. | Parco Naturale del Monviso, Hiking trails, Scenic views of the mountains, Cascate del Rio Monviso |
| Frazioni di Paesana | The surrounding hamlets of Paesana offer a more rural experience with picturesque views and a peaceful atmosphere, perfect for travelers wishing to escape the city. | Frazioni di San Giovanni, Frazioni di San Lorenzo, Local farms and vineyards, Traditional countryside festivals |
| Monviso | Famous for the Monviso mountain, it attracts climbers and tourists looking for adventure sports and breathtaking scenery. A key destination for outdoor activities. | Monviso summit, Skiing and snowboarding in winter, Climbing routes, Bird watching and nature tours |
| Paesana's Culinary Scene | Known for its local delicacies and traditional Piedmont cuisine. Attracts foodies and culinary tourists looking to taste authentic Italian dishes. | Local cheese and wine tastings, Gastronomic festivals, Trattorias serving homemade pasta, Cooking classes |
| Natural Wellness Retreats | Paesana offers wellness retreats focusing on relaxation and rejuvenation, ideal for tourists seeking a holistic escape. | Spa centers, Yoga retreats, Natural hot springs, Meditation workshops |
| Cultural Events and Festivals | Paesana hosts various cultural events throughout the year, attracting tourists interested in local traditions and festivities. | Ferragosto celebrations, Local artisan markets, Wine and food festivals, Music concerts |
| Adventure Sports Hub | A growing destination for adventure sports like mountain biking, paragliding and rafting, appealing to active travelers looking for excitement. | Mountain biking trails, Paragliding spots, Rafting on the Po River, Guided outdoor tours |
Understanding Airbnb License Requirements & STR Laws in Paesana (2025)
Yes, Paesana, Piedmont, Italy enforces high STR regulations. Obtaining a license and ensuring compliance is almost certainly required according to current 2025 STR laws. Always verify the latest short term rental regulations and Airbnb license requirements directly with local government authorities for Paesana to ensure full compliance before hosting.
(Source: AirROI data, 2025, based on 56% licensed listings)
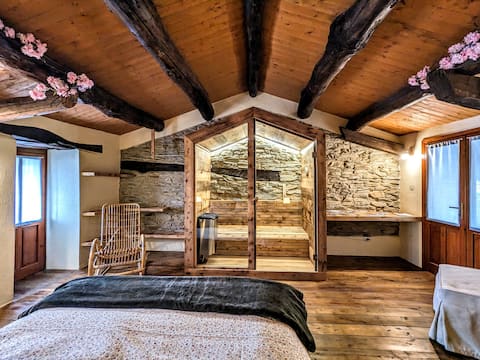
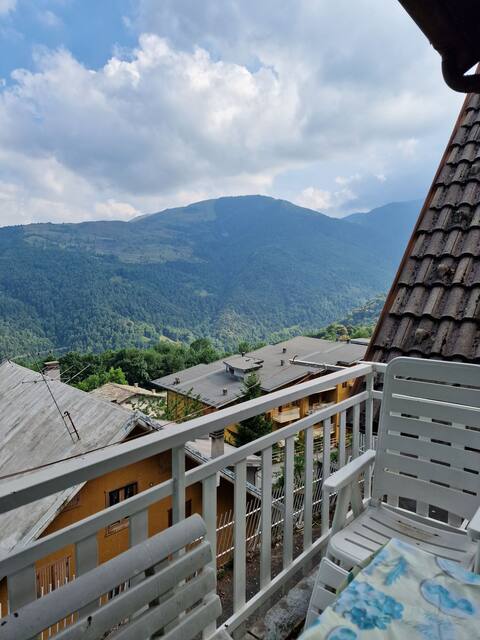
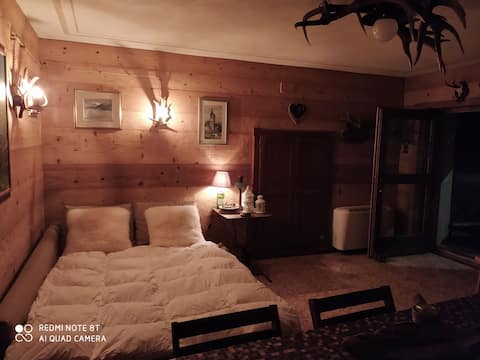
Top Performing Airbnb Properties in Paesana (2025)
Benchmark your potential! Explore examples of top-performing Airbnb properties in Paesanabased on Trailing Twelve Month (TTM) revenue. Analyze their characteristics, revenue, occupancy rate, and ADR to understand what drives success in this market.
casa nenella
Entire Place • 2 bedrooms
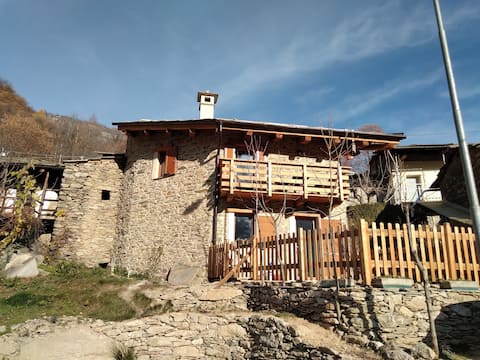
Badia: house surrounded by nature
Entire Place • 2 bedrooms
bellavista
Entire Place • 1 bedroom

Apartment VESULO in Paesana
Entire Place • 2 bedrooms

Casa Vacanze dal Ciavatin - Apartamento Garet
Entire Place • 1 bedroom
Da Meme'
Entire Place • 1 bedroom
Note: Performance varies based on location, size, amenities, seasonality, and management quality. Data reflects the past 12 months.
Top Performing Airbnb Hosts in Paesana (2025)
Learn from the best! This table showcases top-performing Airbnb hosts in Paesana based on the number of properties managed and estimated total revenue over the past year. Analyze their scale and performance metrics.
| Host Name | Properties | Grossing Revenue | Stay Reviews | Avg Rating |
|---|---|---|---|---|
| Gianni | 1 | $44,819 | 93 | 4.91/5.0 |
| Luciana | 2 | $17,733 | 65 | 4.91/5.0 |
| Valter | 3 | $13,893 | 13 | 4.82/5.0 |
| Host #192897497 | 1 | $11,905 | 8 | 3.63/5.0 |
| Paola | 1 | $6,285 | 28 | 4.75/5.0 |
| Laura | 1 | $5,482 | 19 | 5.00/5.0 |
| Host #64161119 | 1 | $5,474 | 0 | 0.00/5.0 |
| Daniela | 2 | $3,484 | 9 | 2.50/5.0 |
| Luciana | 1 | $3,366 | 29 | 4.93/5.0 |
| Luca | 1 | $1,922 | 3 | 5.00/5.0 |
Analyzing the strategies of top hosts, such as their property selection, pricing, and guest communication, can offer valuable lessons for optimizing your own Airbnb operations in Paesana.
Dive Deeper: Advanced Paesana STR Market Data (2025)
Ready to unlock more insights? AirROI provides access to advanced metrics and comprehensive Airbnb data for Paesana. Explore detailed analytics beyond this report to refine your investment strategy, optimize pricing, and maximize your vacation rental profits.
Explore Advanced MetricsPaesana Short-Term Rental Market Composition (2025): Property & Room Types
Room Type Distribution
Property Type Distribution
Market Composition Insights for Paesana
- The Paesana Airbnb market composition is heavily skewed towards Entire Home/Apt listings, which make up 100% of the 18 active rentals. This indicates strong guest preference for privacy and space.
- Looking at the property type distribution in Paesana, Apartment/Condo properties are the most common (66.7%), reflecting the local real estate landscape.
- Houses represent a significant 22.2% portion, catering likely to families or larger groups.
Paesana Airbnb Room Capacity Analysis (2025): Bedroom Distribution
Distribution of Listings by Number of Bedrooms
Room Capacity Insights for Paesana
- The dominant room capacity in Paesana is 1 bedroom listings, making up 55.6% of the market. This suggests a strong demand for properties suitable for couples or solo travelers.
- Together, 1 bedroom and 2 bedrooms properties represent 100.0% of the active Airbnb listings in Paesana, indicating a high concentration in these sizes.
- With over half the market (55.6%) consisting of studios or 1-bedroom units, Paesana is particularly well-suited for individuals or couples.
Paesana Vacation Rental Guest Capacity Trends (2025)
Distribution of Listings by Guest Capacity
Guest Capacity Insights for Paesana
- The most common guest capacity trend in Paesana vacation rentals is listings accommodating 4 guests (44.4%). This suggests the primary traveler segment is likely small families or groups.
- Properties designed for 4 guests and 3 guests dominate the Paesana STR market, accounting for 61.1% of listings.
- 16.7% of properties accommodate 6+ guests, serving the market segment for larger families or group travel in Paesana.
- On average, properties in Paesana are equipped to host 4.1 guests.
Paesana Airbnb Booking Patterns (2025): Available vs. Booked Days
Available Days Distribution
Booked Days Distribution
Booking Pattern Insights for Paesana
- The most common availability pattern in Paesana falls within the 271-366 days range, representing 83.3% of listings. This suggests many properties have significant open periods on their calendars.
- Approximately 88.9% of listings show high availability (181+ days open annually), indicating potential for increased bookings or specific owner usage patterns.
- For booked days, the 31-90 days range is most frequent in Paesana (50%), reflecting common guest stay durations or potential owner blocking patterns.
- A notable 11.2% of properties secure long booking periods (181+ days booked per year), highlighting successful long-term rental strategies or significant owner usage.
Paesana Airbnb Minimum Stay Requirements Analysis
Distribution of Listings by Minimum Night Requirement
1 Night
4 listings
26.7% of total
2 Nights
5 listings
33.3% of total
3 Nights
1 listings
6.7% of total
7-29 Nights
2 listings
13.3% of total
30+ Nights
3 listings
20% of total
Key Insights
- The most prevalent minimum stay requirement in Paesana is 2 Nights, adopted by 33.3% of listings. This highlights the market's preference for shorter, flexible bookings.
- A significant segment (20%) caters to monthly stays (30+ nights) in Paesana, pointing to opportunities in the extended-stay market.
Recommendations
- Align with the market by considering a 2 Nights minimum stay, as 33.3% of Paesana hosts use this setting.
- If feasible, allowing 1-night stays, especially midweek or during low season, could capture last-minute bookings, as only 26.7% currently do.
- Explore offering discounts for stays of 30+ nights to attract the 20% of the market seeking extended stays.
- Adjust minimum nights based on seasonality – potentially shorter during low season and longer during peak demand periods in Paesana.
Paesana Airbnb Cancellation Policy Trends Analysis (2025)
Flexible
8 listings
61.5% of total
Moderate
5 listings
38.5% of total
Cancellation Policy Insights for Paesana
- The prevailing Airbnb cancellation policy trend in Paesana is Flexible, used by 61.5% of listings.
- The market strongly favors guest-friendly terms, with 100.0% of listings offering Flexible or Moderate policies. This suggests guests in Paesana may expect booking flexibility.
Recommendations for Hosts
- Consider adopting a Flexible policy to align with the 61.5% market standard in Paesana.
- Given the high prevalence of Flexible policies (61.5%), offering this can enhance booking appeal, especially during shoulder seasons.
- Regularly review your cancellation policy against competitors and market demand shifts in Paesana.
Paesana STR Booking Lead Time Analysis (2025)
Average Booking Lead Time by Month
Booking Lead Time Insights for Paesana
- The overall average booking lead time for vacation rentals in Paesana is 48 days.
- Guests book furthest in advance for stays during June (average 118 days), likely coinciding with peak travel demand or local events.
- The shortest booking windows occur for stays in November (average 16 days), indicating more last-minute travel plans during this time.
- Seasonally, Summer (80 days avg.) sees the longest lead times, while Fall (37 days avg.) has the shortest, reflecting typical travel planning cycles.
Recommendations for Hosts
- Use the overall average lead time (48 days) as a baseline for your pricing and availability strategy in Paesana.
- For June stays, consider implementing length-of-stay discounts or slightly higher rates for bookings made less than 118 days out to capitalize on advance planning.
- Target marketing efforts for the Summer season well in advance (at least 80 days) to capture early planners.
- Monitor your own booking lead times against these Paesana averages to identify opportunities for dynamic pricing adjustments.
Popular & Essential Airbnb Amenities in Paesana (2025)
Amenity Prevalence
Amenity Insights for Paesana
- Popular amenities like Kitchen, Heating, TV are common but not universal. Offering these can provide a competitive edge.
- Warning: Wifi is not universally provided but is considered essential globally. Ensure reliable Wifi is offered.
Recommendations for Hosts
- Consider adding popular differentiators like Kitchen or Heating to increase appeal.
- Highlight unique or less common amenities you offer (e.g., hot tub, dedicated workspace, EV charger) in your listing description and photos.
- Regularly check competitor amenities in Paesana to stay competitive.
Paesana Airbnb Guest Demographics & Profile Analysis (2025)
Guest Profile Summary for Paesana
- The typical guest profile for Airbnb in Paesana consists of a mix of domestic (60%) and international guests, often arriving from nearby Milan, typically belonging to the Post-2000s (Gen Z/Alpha) group (50%), primarily speaking English or Italian.
- Domestic travelers account for 60.0% of guests.
- Key international markets include Italy (60%) and France (14.3%).
- Top languages spoken are English (32.6%) followed by Italian (23.6%).
- A significant demographic segment is the Post-2000s (Gen Z/Alpha) group, representing 50% of guests.
Recommendations for Hosts
- Balance marketing efforts between domestic and international channels based on the guest mix.
- Tailor amenities and listing descriptions to appeal to the dominant Post-2000s (Gen Z/Alpha) demographic (e.g., highlight fast WiFi, smart home features, local guides).
- Highlight unique local experiences or amenities relevant to the primary guest profile.
- Consider seasonal promotions aligned with peak travel times for key origin markets.
Nearby Short-Term Rental Market Comparison
How does the Paesana Airbnb market stack up against its neighbors? Compare key performance metrics like average monthly revenue, ADR, and occupancy rates in surrounding areas to understand the broader regional STR landscape.
| Market | Active Properties | Monthly Revenue | Daily Rate | Avg. Occupancy |
|---|---|---|---|---|
| Les Clefs | 30 | $5,741 | $323.11 | 44% |
| Monteu Roero | 16 | $4,432 | $540.14 | 36% |
| Manigod | 194 | $4,127 | $427.80 | 40% |
| Ramatuelle | 213 | $3,891 | $670.10 | 41% |
| Saint-Jean-Cap-Ferrat | 107 | $3,844 | $424.21 | 46% |
| Cossano Belbo | 13 | $3,632 | $284.21 | 42% |
| Saint-Tropez | 742 | $3,498 | $506.57 | 41% |
| Saint-Nicolas-la-Chapelle | 27 | $3,381 | $375.70 | 43% |
| Cassinasco | 18 | $3,219 | $545.40 | 41% |
| Charvonnex | 11 | $3,212 | $228.03 | 56% |