Ovada Airbnb Market Analysis 2025: Short Term Rental Data & Vacation Rental Statistics in Piedmont, Italy
Is Airbnb profitable in Ovada in 2025? Explore comprehensive Airbnb analytics for Ovada, Piedmont, Italy to uncover income potential. This 2025 STR market report for Ovada, based on AirROI data from April 2024 to March 2025, reveals key trends in the niche market of 34 active listings.
Whether you're considering an Airbnb investment in Ovada, optimizing your existing vacation rental, or exploring rental arbitrage opportunities, understanding the Ovada Airbnb data is crucial. Navigating the high regulation landscape is key to maximizing your short term rental income potential. Let's dive into the specifics.
Key Ovada Airbnb Performance Metrics Overview
Monthly Airbnb Revenue Variations & Income Potential in Ovada (2025)
Understanding the monthly revenue variations for Airbnb listings in Ovada is key to maximizing your short term rental income potential. Seasonality significantly impacts earnings. Our analysis, based on data from the past 12 months, shows that the peak revenue month for STRs in Ovada is typically July, while January often presents the lowest earnings, highlighting opportunities for strategic pricing adjustments during shoulder and low seasons. Explore the typical Airbnb income in Ovada across different performance tiers:
- Best-in-class properties (Top 10%) achieve $2,973+ monthly, often utilizing dynamic pricing and superior guest experiences.
- Strong performing properties (Top 25%) earn $1,596 or more, indicating effective management and desirable locations/amenities.
- Typical properties (Median) generate around $757 per month, representing the average market performance.
- Entry-level properties (Bottom 25%) see earnings around $354, often with potential for optimization.
Average Monthly Airbnb Earnings Trend in Ovada
Ovada Airbnb Occupancy Rate Trends (2025)
Maximize your bookings by understanding the Ovada STR occupancy trends. Seasonal demand shifts significantly influence how often properties are booked. Typically, Augustsees the highest demand (peak season occupancy), while March experiences the lowest (low season). Effective strategies, like adjusting minimum stays or offering promotions, can boost occupancy during slower periods. Here's how different property tiers perform in Ovada:
- Best-in-class properties (Top 10%) achieve 56%+ occupancy, indicating high desirability and potentially optimized availability.
- Strong performing properties (Top 25%) maintain 38% or higher occupancy, suggesting good market fit and guest satisfaction.
- Typical properties (Median) have an occupancy rate around 20%.
- Entry-level properties (Bottom 25%) average 10% occupancy, potentially facing higher vacancy.
Average Monthly Occupancy Rate Trend in Ovada
Average Daily Rate (ADR) Airbnb Trends in Ovada (2025)
Effective short term rental pricing strategy in Ovada involves understanding monthly ADR fluctuations. The Average Daily Rate (ADR) for Airbnb in Ovada typically peaks in July and dips lowest during October. Leveraging Airbnb dynamic pricing tools or strategies based on this seasonality can significantly boost revenue. Here's a look at the typical nightly rates achieved:
- Best-in-class properties (Top 10%) command rates of $261+ per night, often due to premium features or locations.
- Strong performing properties (Top 25%) achieve nightly rates of $156 or more.
- Typical properties (Median) charge around $115 per night.
- Entry-level properties (Bottom 25%) earn around $80 per night.
Average Daily Rate (ADR) Trend by Month in Ovada
Get Live Ovada Market Intelligence 👇

Explore Real-time Analytics
Airbnb Seasonality Analysis & Trends in Ovada (2025)
Peak Season (July, August, June)
- Revenue averages $2,224 per month
- Occupancy rates average 40.1%
- Daily rates average $148
Shoulder Season
- Revenue averages $1,028 per month
- Occupancy maintains around 23.1%
- Daily rates hold near $141
Low Season (January, February, March)
- Revenue drops to average $514 per month
- Occupancy decreases to average 19.4%
- Daily rates adjust to average $140
Seasonality Insights for Ovada
- The Airbnb seasonality in Ovada shows highly seasonal trends requiring careful strategy. While the sections above show seasonal averages, it's also insightful to look at the extremes:
- During the high season, the absolute peak month showcases Ovada's highest earning potential, with monthly revenues capable of climbing to $2,541, occupancy reaching a high of 48.0%, and ADRs peaking at $151.
- Conversely, the slowest single month of the year, typically falling within the low season, marks the market's lowest point. In this month, revenue might dip to $464, occupancy could drop to 16.7%, and ADRs may adjust down to $139.
- Understanding both the seasonal averages and these monthly peaks and troughs in revenue, occupancy, and ADR is crucial for maximizing your Airbnb profit potential in Ovada.
Seasonal Strategies for Maximizing Profit
- Peak Season: Maximize revenue through premium pricing and potentially longer minimum stays. Ensure high availability.
- Low Season: Offer competitive pricing, special promotions (e.g., extended stay discounts), and flexible cancellation policies. Target off-season travelers like remote workers or budget-conscious guests.
- Shoulder Seasons: Implement dynamic pricing that balances peak and low rates. Target weekend travelers or specific events. Offer slightly more flexible terms than peak season.
- Regularly analyze your own performance against these Ovada seasonality benchmarks and adjust your pricing and availability strategy accordingly.
Best Areas for Airbnb Investment in Ovada (2025)
Exploring the top neighborhoods for short-term rentals in Ovada? This section highlights key areas, outlining why they are attractive for hosts and guests, along with notable local attractions. Consider these locations based on your target guest profile and investment strategy.
| Neighborhood / Area | Why Host Here? (Target Guests & Appeal) | Key Attractions & Landmarks |
|---|---|---|
| Centro Storico | The historic center of Ovada featuring charming architecture and rich history. Ideal for tourists who enjoy exploring local culture, restaurants, and cafes. | Piazza della Libertà, Chiesa di San Domenico, Museo della Fisarmonica, Palazzo Montaldo, Parco della Rimembranza |
| Valle Bormida | A beautiful valley known for its natural landscapes and outdoor activities. Ideal for nature lovers and those seeking tranquility away from the city bustle. | Sentiero del Bormida, Parco Naturale Regionale delle Capanne di Marcarolo, Wine tasting in local vineyards |
| Castelletto d'Orba | A picturesque village close to Ovada, perfect for tourists looking for a quiet stay with beautiful countryside views. | Castello di Castelletto, trails for hiking, local wineries |
| Novi Ligure | Nearby town known for its shopping and rich history. A good base for visitors who want to explore both Ovada and its surroundings. | Fortino di Noviligure, Museo dei Campionissimi, Outlet Shopping |
| Acqui Terme | Famous for its thermal baths and spa culture. Attracts health-focused travelers and those wishing to relax and unwind. | Terme di Acqui, La Bollente, Grotte di Acqui Terme |
| Tortona | A larger town that offers various services and attractions. Good for business travelers or those looking for a vibrant local scene. | Torre di Tortona, Museum of the Tortona Countryside, Local markets |
| Local Wine Regions | Ovada is located near famous wine regions. Wine enthusiasts will find numerous wineries and tasting tours available. | Wine tours in Gavi, Local vineyards, Wine festivals |
| Cultural Sites | Ovada has several cultural sites and events that attract tourists interested in art, history, and local traditions. | Cultural festivals, Local artisan markets, Historical exhibitions |
Understanding Airbnb License Requirements & STR Laws in Ovada (2025)
Yes, Ovada, Piedmont, Italy enforces high STR regulations. Obtaining a license and ensuring compliance is almost certainly required according to current 2025 STR laws. Always verify the latest short term rental regulations and Airbnb license requirements directly with local government authorities for Ovada to ensure full compliance before hosting.
(Source: AirROI data, 2025, based on 85% licensed listings)
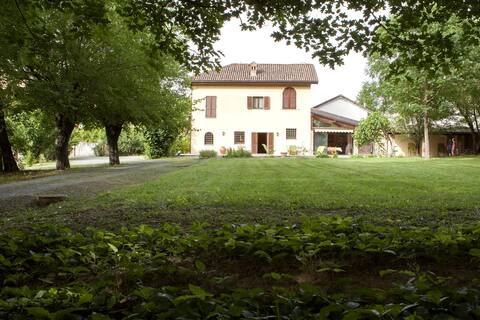
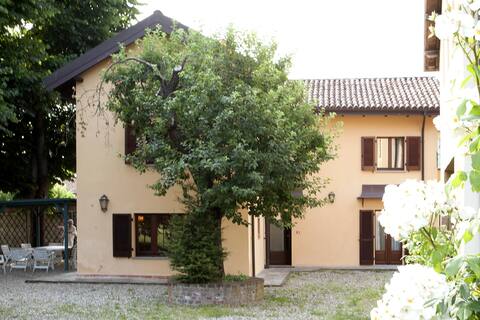
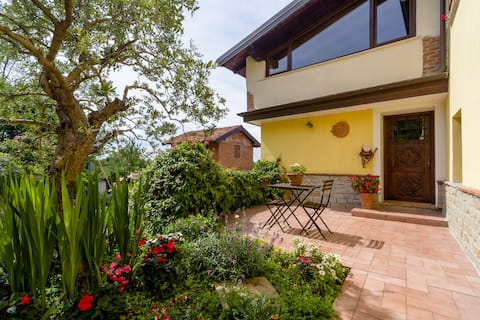
Top Performing Airbnb Properties in Ovada (2025)
Benchmark your potential! Explore examples of top-performing Airbnb properties in Ovadabased on Trailing Twelve Month (TTM) revenue. Analyze their characteristics, revenue, occupancy rate, and ADR to understand what drives success in this market.

Sant'Evasio by Interhome
Entire Place • 5 bedrooms
Guest House Oleandri Villa Schella Ovada
Entire Place • 3 bedrooms
Guest House Rose Villa Schella Ovada
Entire Place • 4 bedrooms

Il Gelsomino Apartment
Entire Place • 2 bedrooms

Claudia's garden "Cardamomo"
Entire Place • 2 bedrooms
Apartment Il Glicine
Entire Place • 2 bedrooms
Note: Performance varies based on location, size, amenities, seasonality, and management quality. Data reflects the past 12 months.
Top Performing Airbnb Hosts in Ovada (2025)
Learn from the best! This table showcases top-performing Airbnb hosts in Ovada based on the number of properties managed and estimated total revenue over the past year. Analyze their scale and performance metrics.
| Host Name | Properties | Grossing Revenue | Stay Reviews | Avg Rating |
|---|---|---|---|---|
| Maria | 2 | $74,940 | 18 | 4.63/5.0 |
| Antonella | 6 | $71,526 | 125 | 4.80/5.0 |
| Alessandra - Interhome Group | 1 | $48,773 | 15 | 4.80/5.0 |
| Federica | 4 | $27,237 | 42 | 4.83/5.0 |
| Ornella | 5 | $18,025 | 24 | 4.92/5.0 |
| Claudia | 1 | $15,666 | 108 | 4.90/5.0 |
| Luisa | 1 | $14,560 | 82 | 4.99/5.0 |
| Michele | 1 | $11,954 | 34 | 4.65/5.0 |
| Gabriella | 1 | $10,262 | 123 | 4.90/5.0 |
| Sophie | 1 | $8,101 | 25 | 4.80/5.0 |
Analyzing the strategies of top hosts, such as their property selection, pricing, and guest communication, can offer valuable lessons for optimizing your own Airbnb operations in Ovada.
Dive Deeper: Advanced Ovada STR Market Data (2025)
Ready to unlock more insights? AirROI provides access to advanced metrics and comprehensive Airbnb data for Ovada. Explore detailed analytics beyond this report to refine your investment strategy, optimize pricing, and maximize your vacation rental profits.
Explore Advanced MetricsOvada Short-Term Rental Market Composition (2025): Property & Room Types
Room Type Distribution
Property Type Distribution
Market Composition Insights for Ovada
- The Ovada Airbnb market composition is heavily skewed towards Entire Home/Apt listings, which make up 67.6% of the 34 active rentals. This indicates strong guest preference for privacy and space.
- However, a notable 32.4% share for Private Rooms suggests opportunities for budget-conscious travelers or hosts renting out spare rooms.
- Looking at the property type distribution in Ovada, Apartment/Condo properties are the most common (47.1%), reflecting the local real estate landscape.
- Houses represent a significant 38.2% portion, catering likely to families or larger groups.
- The presence of 14.7% Hotel/Boutique listings indicates integration with traditional hospitality.
Ovada Airbnb Room Capacity Analysis (2025): Bedroom Distribution
Distribution of Listings by Number of Bedrooms
Room Capacity Insights for Ovada
- The dominant room capacity in Ovada is 2 bedrooms listings, making up 35.3% of the market. This suggests a strong demand for properties suitable for couples or solo travelers.
- Together, 2 bedrooms and 1 bedroom properties represent 61.8% of the active Airbnb listings in Ovada, indicating a high concentration in these sizes.
Ovada Vacation Rental Guest Capacity Trends (2025)
Distribution of Listings by Guest Capacity
Guest Capacity Insights for Ovada
- The most common guest capacity trend in Ovada vacation rentals is listings accommodating 4 guests (20.6%). This suggests the primary traveler segment is likely small families or groups.
- Properties designed for 4 guests and 2 guests dominate the Ovada STR market, accounting for 35.3% of listings.
- 20.5% of properties accommodate 6+ guests, serving the market segment for larger families or group travel in Ovada.
- On average, properties in Ovada are equipped to host 3.2 guests.
Ovada Airbnb Booking Patterns (2025): Available vs. Booked Days
Available Days Distribution
Booked Days Distribution
Booking Pattern Insights for Ovada
- The most common availability pattern in Ovada falls within the 271-366 days range, representing 67.6% of listings. This suggests many properties have significant open periods on their calendars.
- Approximately 97.0% of listings show high availability (181+ days open annually), indicating potential for increased bookings or specific owner usage patterns.
- For booked days, the 31-90 days range is most frequent in Ovada (38.2%), reflecting common guest stay durations or potential owner blocking patterns.
- A notable 2.9% of properties secure long booking periods (181+ days booked per year), highlighting successful long-term rental strategies or significant owner usage.
Ovada Airbnb Minimum Stay Requirements Analysis
Distribution of Listings by Minimum Night Requirement
1 Night
25 listings
80.6% of total
2 Nights
2 listings
6.5% of total
3 Nights
1 listings
3.2% of total
4-6 Nights
3 listings
9.7% of total
Key Insights
- The most prevalent minimum stay requirement in Ovada is 1 Night, adopted by 80.6% of listings. This highlights the market's preference for shorter, flexible bookings.
- A strong majority (87.1%) of the Ovada Airbnb data shows acceptance of very short stays (1-2 nights), indicating a dynamic, high-turnover market.
Recommendations
- Align with the market by considering a 1 Night minimum stay, as 80.6% of Ovada hosts use this setting.
- Adjust minimum nights based on seasonality – potentially shorter during low season and longer during peak demand periods in Ovada.
Ovada Airbnb Cancellation Policy Trends Analysis (2025)
Super Strict 30 Days
2 listings
6.5% of total
Flexible
10 listings
32.3% of total
Moderate
8 listings
25.8% of total
Strict
11 listings
35.5% of total
Cancellation Policy Insights for Ovada
- The prevailing Airbnb cancellation policy trend in Ovada is Strict, used by 35.5% of listings.
- There's a relatively balanced mix between guest-friendly (58.1%) and stricter (35.5%) policies, offering choices for different guest needs.
Recommendations for Hosts
- Consider adopting a Strict policy to align with the 35.5% market standard in Ovada.
- With 35.5% using Strict terms, this is a viable option in Ovada, particularly for high-value properties or during peak demand periods.
- Regularly review your cancellation policy against competitors and market demand shifts in Ovada.
Ovada STR Booking Lead Time Analysis (2025)
Average Booking Lead Time by Month
Booking Lead Time Insights for Ovada
- The overall average booking lead time for vacation rentals in Ovada is 45 days.
- Guests book furthest in advance for stays during July (average 91 days), likely coinciding with peak travel demand or local events.
- The shortest booking windows occur for stays in February (average 20 days), indicating more last-minute travel plans during this time.
- Seasonally, Summer (68 days avg.) sees the longest lead times, while Winter (24 days avg.) has the shortest, reflecting typical travel planning cycles.
Recommendations for Hosts
- Use the overall average lead time (45 days) as a baseline for your pricing and availability strategy in Ovada.
- For July stays, consider implementing length-of-stay discounts or slightly higher rates for bookings made less than 91 days out to capitalize on advance planning.
- Target marketing efforts for the Summer season well in advance (at least 68 days) to capture early planners.
- Monitor your own booking lead times against these Ovada averages to identify opportunities for dynamic pricing adjustments.
Popular & Essential Airbnb Amenities in Ovada (2025)
Amenity Prevalence
Amenity Insights for Ovada
- Popular amenities like Heating, Kitchen, TV are common but not universal. Offering these can provide a competitive edge.
- Warning: Wifi is not universally provided but is considered essential globally. Ensure reliable Wifi is offered.
Recommendations for Hosts
- Consider adding popular differentiators like Heating or Kitchen to increase appeal.
- Highlight unique or less common amenities you offer (e.g., hot tub, dedicated workspace, EV charger) in your listing description and photos.
- Regularly check competitor amenities in Ovada to stay competitive.
Ovada Airbnb Guest Demographics & Profile Analysis (2025)
Guest Profile Summary for Ovada
- The typical guest profile for Airbnb in Ovada consists of predominantly international visitors (82%), with top international origins including Italy, typically belonging to the Post-2000s (Gen Z/Alpha) group (50%), primarily speaking English or French.
- Domestic travelers account for 18.3% of guests.
- Key international markets include France (30.5%) and Italy (18.3%).
- Top languages spoken are English (36.8%) followed by French (17.9%).
- A significant demographic segment is the Post-2000s (Gen Z/Alpha) group, representing 50% of guests.
Recommendations for Hosts
- Focus marketing internationally, particularly towards travelers from Italy.
- Tailor amenities and listing descriptions to appeal to the dominant Post-2000s (Gen Z/Alpha) demographic (e.g., highlight fast WiFi, smart home features, local guides).
- Highlight unique local experiences or amenities relevant to the primary guest profile.
- Consider seasonal promotions aligned with peak travel times for key origin markets.
Nearby Short-Term Rental Market Comparison
How does the Ovada Airbnb market stack up against its neighbors? Compare key performance metrics like average monthly revenue, ADR, and occupancy rates in surrounding areas to understand the broader regional STR landscape.
| Market | Active Properties | Monthly Revenue | Daily Rate | Avg. Occupancy |
|---|---|---|---|---|
| Laglio | 64 | $4,873 | $463.61 | 47% |
| Monteu Roero | 16 | $4,432 | $540.14 | 36% |
| Portofino | 68 | $4,086 | $454.35 | 44% |
| Saint-Jean-Cap-Ferrat | 107 | $3,844 | $424.21 | 46% |
| Sala Comacina | 64 | $3,794 | $400.27 | 50% |
| Cossano Belbo | 13 | $3,632 | $284.21 | 42% |
| Bellagio | 373 | $3,630 | $328.26 | 55% |
| Oliveto Lario | 99 | $3,509 | $327.42 | 55% |
| Carate Urio | 71 | $3,379 | $331.90 | 44% |
| Brienno | 39 | $3,327 | $337.92 | 45% |