Oulx Airbnb Market Analysis 2025: Short Term Rental Data & Vacation Rental Statistics in Piedmont, Italy
Is Airbnb profitable in Oulx in 2025? Explore comprehensive Airbnb analytics for Oulx, Piedmont, Italy to uncover income potential. This 2025 STR market report for Oulx, based on AirROI data from April 2024 to March 2025, reveals key trends in the niche market of 57 active listings.
Whether you're considering an Airbnb investment in Oulx, optimizing your existing vacation rental, or exploring rental arbitrage opportunities, understanding the Oulx Airbnb data is crucial. Navigating the high regulation landscape is key to maximizing your short term rental income potential. Let's dive into the specifics.
Key Oulx Airbnb Performance Metrics Overview
Monthly Airbnb Revenue Variations & Income Potential in Oulx (2025)
Understanding the monthly revenue variations for Airbnb listings in Oulx is key to maximizing your short term rental income potential. Seasonality significantly impacts earnings. Our analysis, based on data from the past 12 months, shows that the peak revenue month for STRs in Oulx is typically August, while October often presents the lowest earnings, highlighting opportunities for strategic pricing adjustments during shoulder and low seasons. Explore the typical Airbnb income in Oulx across different performance tiers:
- Best-in-class properties (Top 10%) achieve $2,402+ monthly, often utilizing dynamic pricing and superior guest experiences.
- Strong performing properties (Top 25%) earn $1,392 or more, indicating effective management and desirable locations/amenities.
- Typical properties (Median) generate around $843 per month, representing the average market performance.
- Entry-level properties (Bottom 25%) see earnings around $398, often with potential for optimization.
Average Monthly Airbnb Earnings Trend in Oulx
Oulx Airbnb Occupancy Rate Trends (2025)
Maximize your bookings by understanding the Oulx STR occupancy trends. Seasonal demand shifts significantly influence how often properties are booked. Typically, Augustsees the highest demand (peak season occupancy), while April experiences the lowest (low season). Effective strategies, like adjusting minimum stays or offering promotions, can boost occupancy during slower periods. Here's how different property tiers perform in Oulx:
- Best-in-class properties (Top 10%) achieve 57%+ occupancy, indicating high desirability and potentially optimized availability.
- Strong performing properties (Top 25%) maintain 41% or higher occupancy, suggesting good market fit and guest satisfaction.
- Typical properties (Median) have an occupancy rate around 24%.
- Entry-level properties (Bottom 25%) average 12% occupancy, potentially facing higher vacancy.
Average Monthly Occupancy Rate Trend in Oulx
Average Daily Rate (ADR) Airbnb Trends in Oulx (2025)
Effective short term rental pricing strategy in Oulx involves understanding monthly ADR fluctuations. The Average Daily Rate (ADR) for Airbnb in Oulx typically peaks in December and dips lowest during September. Leveraging Airbnb dynamic pricing tools or strategies based on this seasonality can significantly boost revenue. Here's a look at the typical nightly rates achieved:
- Best-in-class properties (Top 10%) command rates of $189+ per night, often due to premium features or locations.
- Strong performing properties (Top 25%) achieve nightly rates of $136 or more.
- Typical properties (Median) charge around $101 per night.
- Entry-level properties (Bottom 25%) earn around $79 per night.
Average Daily Rate (ADR) Trend by Month in Oulx
Get Live Oulx Market Intelligence 👇

Explore Real-time Analytics
Airbnb Seasonality Analysis & Trends in Oulx (2025)
Peak Season (August, July, February)
- Revenue averages $1,714 per month
- Occupancy rates average 45.8%
- Daily rates average $123
Shoulder Season
- Revenue averages $1,064 per month
- Occupancy maintains around 24.9%
- Daily rates hold near $123
Low Season (April, May, October)
- Revenue drops to average $731 per month
- Occupancy decreases to average 15.9%
- Daily rates adjust to average $121
Seasonality Insights for Oulx
- The Airbnb seasonality in Oulx shows highly seasonal trends requiring careful strategy. While the sections above show seasonal averages, it's also insightful to look at the extremes:
- During the high season, the absolute peak month showcases Oulx's highest earning potential, with monthly revenues capable of climbing to $2,103, occupancy reaching a high of 55.7%, and ADRs peaking at $129.
- Conversely, the slowest single month of the year, typically falling within the low season, marks the market's lowest point. In this month, revenue might dip to $660, occupancy could drop to 13.6%, and ADRs may adjust down to $118.
- Understanding both the seasonal averages and these monthly peaks and troughs in revenue, occupancy, and ADR is crucial for maximizing your Airbnb profit potential in Oulx.
Seasonal Strategies for Maximizing Profit
- Peak Season: Maximize revenue through premium pricing and potentially longer minimum stays. Ensure high availability.
- Low Season: Offer competitive pricing, special promotions (e.g., extended stay discounts), and flexible cancellation policies. Target off-season travelers like remote workers or budget-conscious guests.
- Shoulder Seasons: Implement dynamic pricing that balances peak and low rates. Target weekend travelers or specific events. Offer slightly more flexible terms than peak season.
- Regularly analyze your own performance against these Oulx seasonality benchmarks and adjust your pricing and availability strategy accordingly.
Best Areas for Airbnb Investment in Oulx (2025)
Exploring the top neighborhoods for short-term rentals in Oulx? This section highlights key areas, outlining why they are attractive for hosts and guests, along with notable local attractions. Consider these locations based on your target guest profile and investment strategy.
| Neighborhood / Area | Why Host Here? (Target Guests & Appeal) | Key Attractions & Landmarks |
|---|---|---|
| Centro Oulx | The heart of Oulx, close to local shops, restaurants, and cultural sites. Ideal for guests wanting to experience the local lifestyle and easy access to transportation. | Municipal Market, Chiesa di San Giovanni Battista, Piazza del Municipio, Oulx Heritage Museum, Local cafes and restaurants |
| Fenestrelle | A picturesque village known for its stunning fortification, Fenestrelle offers hiking and historical attractions. Perfect for nature lovers and history enthusiasts. | Fenestrelle Fort, Hiking trails, Scenic views of the Susa Valley, Local festivals, Cultural events |
| Cesana Torinese | A short drive from Oulx and part of the Milky Way ski area, it is a popular destination for winter sports, attracting tourists throughout the season. | Milky Way Ski Area, Monti della Luna, Cesana's historic village, Alpine skiing and snowboarding, Summer hiking trails |
| Sauze d'Oulx | Adjacent to Oulx, this ski resort town is vibrant with nightlife and outdoor activities, making it ideal for winter and summer travelers alike. | Ski resort, Nightclubs and bars, Parco Naturale del Gran Bosco, Scenic gondola rides, Cultural events |
| Sestriere | A renowned ski destination, Sestriere is part of the Italian Alps and is popular with international tourists, especially during winter for skiing. | Ski slopes and resorts, Golf courses, Luxury accommodations, Olympic history, Breathtaking mountain scenery |
| Germagnano | A small, traditional village that offers a quiet retreat from the tourist crowds, perfect for those seeking tranquility and nature. | Local hiking paths, Traditional stone houses, Local gastronomy, Natural parks, Friendly local atmosphere |
| Meana di Susa | Known for its rich history and connection to nature, Meana di Susa attracts those who appreciate local culture and the outdoors. | Historic churches, Scenic landscapes, Hiking and biking trails, Cultural festivals, Local artisanal products |
| Rivoli | Close enough to Oulx, Rivoli is known for its historic castle and vibrant local culture, making it attractive for short-term stays. | Castello di Rivoli, Local art galleries, Historic town center, Parks and green spaces, Culinary experiences |
Understanding Airbnb License Requirements & STR Laws in Oulx (2025)
Yes, Oulx, Piedmont, Italy enforces high STR regulations. Obtaining a license and ensuring compliance is almost certainly required according to current 2025 STR laws. Always verify the latest short term rental regulations and Airbnb license requirements directly with local government authorities for Oulx to ensure full compliance before hosting.
(Source: AirROI data, 2025, based on 63% licensed listings)
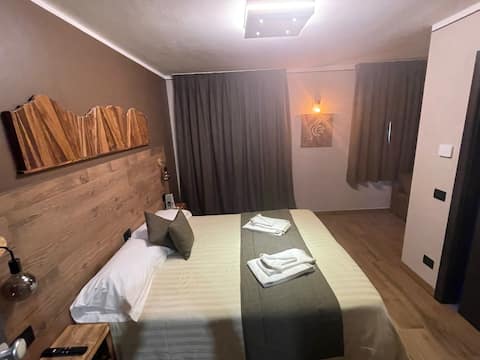
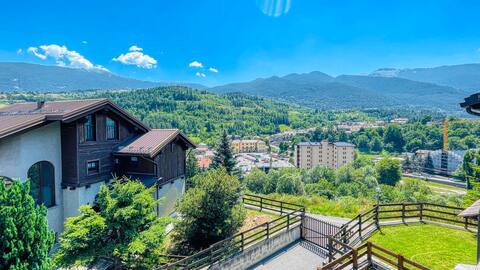
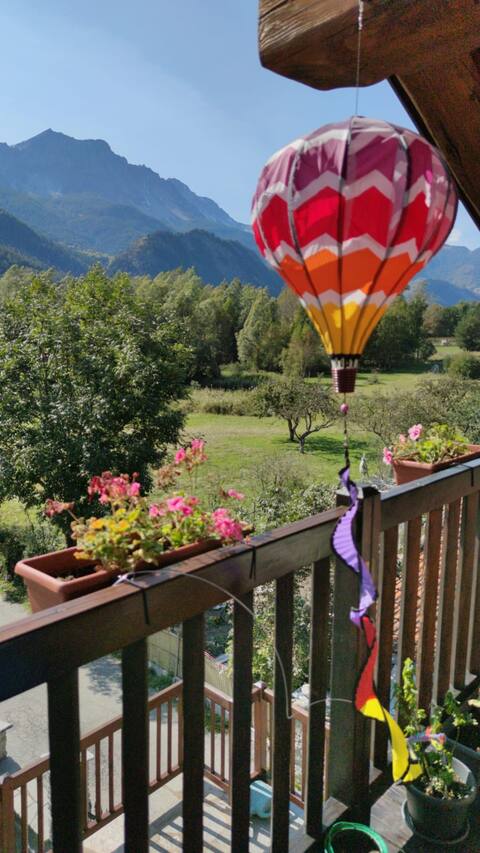
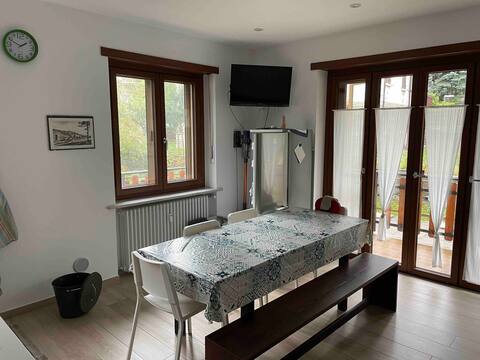
Top Performing Airbnb Properties in Oulx (2025)
Benchmark your potential! Explore examples of top-performing Airbnb properties in Oulxbased on Trailing Twelve Month (TTM) revenue. Analyze their characteristics, revenue, occupancy rate, and ADR to understand what drives success in this market.

Holiday in Charming Cabin Alta Val di Susa Oulx
Entire Place • 7 bedrooms
Affittacamere Room4You a Oulx
Private Room • 1 bedroom
Apartamento Bellavista - Short Term Rentals Italy
Entire Place • 1 bedroom
Cabin apartment
Entire Place • 2 bedrooms

Little paradise
Entire Place • 1 bedroom
2 room apartment - quiet place
Entire Place • 1 bedroom
Note: Performance varies based on location, size, amenities, seasonality, and management quality. Data reflects the past 12 months.
Top Performing Airbnb Hosts in Oulx (2025)
Learn from the best! This table showcases top-performing Airbnb hosts in Oulx based on the number of properties managed and estimated total revenue over the past year. Analyze their scale and performance metrics.
| Host Name | Properties | Grossing Revenue | Stay Reviews | Avg Rating |
|---|---|---|---|---|
| Dream Investments | 1 | $72,133 | 26 | 4.96/5.0 |
| Affitti Brevi Italia | 3 | $47,386 | 37 | 4.50/5.0 |
| Alessandro | 2 | $35,489 | 20 | 2.44/5.0 |
| Michel | 2 | $20,071 | 7 | 2.40/5.0 |
| Giorgio | 1 | $18,152 | 4 | 4.75/5.0 |
| Sergio | 1 | $17,379 | 4 | 5.00/5.0 |
| Riccardo | 1 | $15,852 | 13 | 4.62/5.0 |
| Rossana | 2 | $15,153 | 101 | 4.83/5.0 |
| Marco | 1 | $12,501 | 38 | 4.66/5.0 |
| Sarah Frances | 2 | $11,166 | 25 | 4.80/5.0 |
Analyzing the strategies of top hosts, such as their property selection, pricing, and guest communication, can offer valuable lessons for optimizing your own Airbnb operations in Oulx.
Dive Deeper: Advanced Oulx STR Market Data (2025)
Ready to unlock more insights? AirROI provides access to advanced metrics and comprehensive Airbnb data for Oulx. Explore detailed analytics beyond this report to refine your investment strategy, optimize pricing, and maximize your vacation rental profits.
Explore Advanced MetricsOulx Short-Term Rental Market Composition (2025): Property & Room Types
Room Type Distribution
Property Type Distribution
Market Composition Insights for Oulx
- The Oulx Airbnb market composition is heavily skewed towards Entire Home/Apt listings, which make up 93% of the 57 active rentals. This indicates strong guest preference for privacy and space.
- Looking at the property type distribution in Oulx, Apartment/Condo properties are the most common (71.9%), reflecting the local real estate landscape.
- Houses represent a significant 17.5% portion, catering likely to families or larger groups.
- The presence of 5.3% Hotel/Boutique listings indicates integration with traditional hospitality.
- Smaller segments like unique stays, outdoor/unique (combined 5.3%) offer potential for unique stay experiences.
Oulx Airbnb Room Capacity Analysis (2025): Bedroom Distribution
Distribution of Listings by Number of Bedrooms
Room Capacity Insights for Oulx
- The dominant room capacity in Oulx is 1 bedroom listings, making up 45.6% of the market. This suggests a strong demand for properties suitable for couples or solo travelers.
- Together, 1 bedroom and 2 bedrooms properties represent 84.2% of the active Airbnb listings in Oulx, indicating a high concentration in these sizes.
Oulx Vacation Rental Guest Capacity Trends (2025)
Distribution of Listings by Guest Capacity
Guest Capacity Insights for Oulx
- The most common guest capacity trend in Oulx vacation rentals is listings accommodating 4 guests (42.1%). This suggests the primary traveler segment is likely small families or groups.
- Properties designed for 4 guests and 5 guests dominate the Oulx STR market, accounting for 54.4% of listings.
- 22.8% of properties accommodate 6+ guests, serving the market segment for larger families or group travel in Oulx.
- On average, properties in Oulx are equipped to host 4.3 guests.
Oulx Airbnb Booking Patterns (2025): Available vs. Booked Days
Available Days Distribution
Booked Days Distribution
Booking Pattern Insights for Oulx
- The most common availability pattern in Oulx falls within the 271-366 days range, representing 73.7% of listings. This suggests many properties have significant open periods on their calendars.
- Approximately 98.3% of listings show high availability (181+ days open annually), indicating potential for increased bookings or specific owner usage patterns.
- For booked days, the 31-90 days range is most frequent in Oulx (40.4%), reflecting common guest stay durations or potential owner blocking patterns.
- A notable 3.5% of properties secure long booking periods (181+ days booked per year), highlighting successful long-term rental strategies or significant owner usage.
Oulx Airbnb Minimum Stay Requirements Analysis
Distribution of Listings by Minimum Night Requirement
1 Night
9 listings
16.7% of total
2 Nights
13 listings
24.1% of total
3 Nights
8 listings
14.8% of total
4-6 Nights
12 listings
22.2% of total
7-29 Nights
5 listings
9.3% of total
30+ Nights
7 listings
13% of total
Key Insights
- The most prevalent minimum stay requirement in Oulx is 2 Nights, adopted by 24.1% of listings. This highlights the market's preference for shorter, flexible bookings.
- A significant segment (13%) caters to monthly stays (30+ nights) in Oulx, pointing to opportunities in the extended-stay market.
Recommendations
- Align with the market by considering a 2 Nights minimum stay, as 24.1% of Oulx hosts use this setting.
- If feasible, allowing 1-night stays, especially midweek or during low season, could capture last-minute bookings, as only 16.7% currently do.
- Explore offering discounts for stays of 30+ nights to attract the 13% of the market seeking extended stays.
- Adjust minimum nights based on seasonality – potentially shorter during low season and longer during peak demand periods in Oulx.
Oulx Airbnb Cancellation Policy Trends Analysis (2025)
Flexible
13 listings
27.1% of total
Moderate
18 listings
37.5% of total
Strict
17 listings
35.4% of total
Cancellation Policy Insights for Oulx
- The prevailing Airbnb cancellation policy trend in Oulx is Moderate, used by 37.5% of listings.
- There's a relatively balanced mix between guest-friendly (64.6%) and stricter (35.4%) policies, offering choices for different guest needs.
Recommendations for Hosts
- Consider adopting a Moderate policy to align with the 37.5% market standard in Oulx.
- With 35.4% using Strict terms, this is a viable option in Oulx, particularly for high-value properties or during peak demand periods.
- Regularly review your cancellation policy against competitors and market demand shifts in Oulx.
Oulx STR Booking Lead Time Analysis (2025)
Average Booking Lead Time by Month
Booking Lead Time Insights for Oulx
- The overall average booking lead time for vacation rentals in Oulx is 52 days.
- Guests book furthest in advance for stays during August (average 79 days), likely coinciding with peak travel demand or local events.
- The shortest booking windows occur for stays in November (average 22 days), indicating more last-minute travel plans during this time.
- Seasonally, Summer (65 days avg.) sees the longest lead times, while Fall (37 days avg.) has the shortest, reflecting typical travel planning cycles.
Recommendations for Hosts
- Use the overall average lead time (52 days) as a baseline for your pricing and availability strategy in Oulx.
- For August stays, consider implementing length-of-stay discounts or slightly higher rates for bookings made less than 79 days out to capitalize on advance planning.
- Target marketing efforts for the Summer season well in advance (at least 65 days) to capture early planners.
- Monitor your own booking lead times against these Oulx averages to identify opportunities for dynamic pricing adjustments.
Popular & Essential Airbnb Amenities in Oulx (2025)
Amenity Prevalence
Amenity Insights for Oulx
- Essential amenities in Oulx that guests expect include: Heating. Lacking these (this) could significantly impact bookings.
- Popular amenities like Kitchen, Hot water, TV are common but not universal. Offering these can provide a competitive edge.
Recommendations for Hosts
- Ensure your listing includes all essential amenities for Oulx: Heating.
- Consider adding popular differentiators like Kitchen or Hot water to increase appeal.
- Highlight unique or less common amenities you offer (e.g., hot tub, dedicated workspace, EV charger) in your listing description and photos.
- Regularly check competitor amenities in Oulx to stay competitive.
Oulx Airbnb Guest Demographics & Profile Analysis (2025)
Guest Profile Summary for Oulx
- The typical guest profile for Airbnb in Oulx consists of a mix of domestic (54%) and international guests, often arriving from nearby Turin, typically belonging to the Post-2000s (Gen Z/Alpha) group (50%), primarily speaking English or Italian.
- Domestic travelers account for 53.6% of guests.
- Key international markets include Italy (53.6%) and France (16.7%).
- Top languages spoken are English (37.1%) followed by Italian (26.9%).
- A significant demographic segment is the Post-2000s (Gen Z/Alpha) group, representing 50% of guests.
Recommendations for Hosts
- Balance marketing efforts between domestic and international channels based on the guest mix.
- Tailor amenities and listing descriptions to appeal to the dominant Post-2000s (Gen Z/Alpha) demographic (e.g., highlight fast WiFi, smart home features, local guides).
- Highlight unique local experiences or amenities relevant to the primary guest profile.
- Consider seasonal promotions aligned with peak travel times for key origin markets.
Nearby Short-Term Rental Market Comparison
How does the Oulx Airbnb market stack up against its neighbors? Compare key performance metrics like average monthly revenue, ADR, and occupancy rates in surrounding areas to understand the broader regional STR landscape.
| Market | Active Properties | Monthly Revenue | Daily Rate | Avg. Occupancy |
|---|---|---|---|---|
| Lauterbrunnen | 525 | $7,079 | $546.45 | 54% |
| La Rivière-Enverse | 17 | $5,972 | $624.02 | 41% |
| Les Clefs | 30 | $5,741 | $323.11 | 44% |
| Matten bei Interlaken | 52 | $5,674 | $316.63 | 63% |
| Iseltwald | 14 | $5,491 | $331.95 | 58% |
| Habkern | 13 | $5,382 | $344.74 | 50% |
| Interlaken | 288 | $4,987 | $310.52 | 56% |
| Zermatt | 734 | $4,604 | $463.00 | 46% |
| Oberhofen am Thunersee | 24 | $4,572 | $265.94 | 55% |
| Monteu Roero | 16 | $4,432 | $540.14 | 36% |