Novi Ligure Airbnb Market Analysis 2025: Short Term Rental Data & Vacation Rental Statistics in Piedmont, Italy
Is Airbnb profitable in Novi Ligure in 2025? Explore comprehensive Airbnb analytics for Novi Ligure, Piedmont, Italy to uncover income potential. This 2025 STR market report for Novi Ligure, based on AirROI data from April 2024 to March 2025, reveals key trends in the niche market of 31 active listings.
Whether you're considering an Airbnb investment in Novi Ligure, optimizing your existing vacation rental, or exploring rental arbitrage opportunities, understanding the Novi Ligure Airbnb data is crucial. Navigating the high regulation landscape is key to maximizing your short term rental income potential. Let's dive into the specifics.
Key Novi Ligure Airbnb Performance Metrics Overview
Monthly Airbnb Revenue Variations & Income Potential in Novi Ligure (2025)
Understanding the monthly revenue variations for Airbnb listings in Novi Ligure is key to maximizing your short term rental income potential. Seasonality significantly impacts earnings. Our analysis, based on data from the past 12 months, shows that the peak revenue month for STRs in Novi Ligure is typically May, while March often presents the lowest earnings, highlighting opportunities for strategic pricing adjustments during shoulder and low seasons. Explore the typical Airbnb income in Novi Ligure across different performance tiers:
- Best-in-class properties (Top 10%) achieve $2,437+ monthly, often utilizing dynamic pricing and superior guest experiences.
- Strong performing properties (Top 25%) earn $1,678 or more, indicating effective management and desirable locations/amenities.
- Typical properties (Median) generate around $1,111 per month, representing the average market performance.
- Entry-level properties (Bottom 25%) see earnings around $601, often with potential for optimization.
Average Monthly Airbnb Earnings Trend in Novi Ligure
Novi Ligure Airbnb Occupancy Rate Trends (2025)
Maximize your bookings by understanding the Novi Ligure STR occupancy trends. Seasonal demand shifts significantly influence how often properties are booked. Typically, Maysees the highest demand (peak season occupancy), while March experiences the lowest (low season). Effective strategies, like adjusting minimum stays or offering promotions, can boost occupancy during slower periods. Here's how different property tiers perform in Novi Ligure:
- Best-in-class properties (Top 10%) achieve 79%+ occupancy, indicating high desirability and potentially optimized availability.
- Strong performing properties (Top 25%) maintain 60% or higher occupancy, suggesting good market fit and guest satisfaction.
- Typical properties (Median) have an occupancy rate around 37%.
- Entry-level properties (Bottom 25%) average 17% occupancy, potentially facing higher vacancy.
Average Monthly Occupancy Rate Trend in Novi Ligure
Average Daily Rate (ADR) Airbnb Trends in Novi Ligure (2025)
Effective short term rental pricing strategy in Novi Ligure involves understanding monthly ADR fluctuations. The Average Daily Rate (ADR) for Airbnb in Novi Ligure typically peaks in July and dips lowest during February. Leveraging Airbnb dynamic pricing tools or strategies based on this seasonality can significantly boost revenue. Here's a look at the typical nightly rates achieved:
- Best-in-class properties (Top 10%) command rates of $118+ per night, often due to premium features or locations.
- Strong performing properties (Top 25%) achieve nightly rates of $97 or more.
- Typical properties (Median) charge around $81 per night.
- Entry-level properties (Bottom 25%) earn around $69 per night.
Average Daily Rate (ADR) Trend by Month in Novi Ligure
Get Live Novi Ligure Market Intelligence 👇

Explore Real-time Analytics
Airbnb Seasonality Analysis & Trends in Novi Ligure (2025)
Peak Season (May, April, June)
- Revenue averages $1,928 per month
- Occupancy rates average 47.6%
- Daily rates average $97
Shoulder Season
- Revenue averages $1,274 per month
- Occupancy maintains around 42.6%
- Daily rates hold near $95
Low Season (February, March, October)
- Revenue drops to average $770 per month
- Occupancy decreases to average 30.7%
- Daily rates adjust to average $93
Seasonality Insights for Novi Ligure
- The Airbnb seasonality in Novi Ligure shows highly seasonal trends requiring careful strategy. While the sections above show seasonal averages, it's also insightful to look at the extremes:
- During the high season, the absolute peak month showcases Novi Ligure's highest earning potential, with monthly revenues capable of climbing to $2,164, occupancy reaching a high of 57.5%, and ADRs peaking at $98.
- Conversely, the slowest single month of the year, typically falling within the low season, marks the market's lowest point. In this month, revenue might dip to $680, occupancy could drop to 27.7%, and ADRs may adjust down to $90.
- Understanding both the seasonal averages and these monthly peaks and troughs in revenue, occupancy, and ADR is crucial for maximizing your Airbnb profit potential in Novi Ligure.
Seasonal Strategies for Maximizing Profit
- Peak Season: Maximize revenue through premium pricing and potentially longer minimum stays. Ensure high availability.
- Low Season: Offer competitive pricing, special promotions (e.g., extended stay discounts), and flexible cancellation policies. Target off-season travelers like remote workers or budget-conscious guests.
- Shoulder Seasons: Implement dynamic pricing that balances peak and low rates. Target weekend travelers or specific events. Offer slightly more flexible terms than peak season.
- Regularly analyze your own performance against these Novi Ligure seasonality benchmarks and adjust your pricing and availability strategy accordingly.
Best Areas for Airbnb Investment in Novi Ligure (2025)
Exploring the top neighborhoods for short-term rentals in Novi Ligure? This section highlights key areas, outlining why they are attractive for hosts and guests, along with notable local attractions. Consider these locations based on your target guest profile and investment strategy.
| Neighborhood / Area | Why Host Here? (Target Guests & Appeal) | Key Attractions & Landmarks |
|---|---|---|
| Centro Storico | The historical center of Novi Ligure, featuring picturesque streets and historical buildings. This area attracts tourists interested in culture and history, making it a prime spot for Airbnb. | Castello di Novi Ligure, Museo dei Campionissimi, Piazza Garibaldi, Chiesa di San Lorenzo, Palazzo Comunale |
| Parco delle Rimembranze | A beautiful park area ideal for families and outdoor enthusiasts. Its green spaces and tranquility attract those looking for a relaxing stay with nature access. | Parco delle Rimembranze, Picnic areas, Walking trails, Children's playground, Cultural events |
| Via Roma | Main shopping street of Novi Ligure, offering various shops, cafes, and restaurants. It draws visitors looking for retail therapy and local delicacies. | Local boutiques, Cafes and restaurants, Historical architecture, Weekly markets, Cultural festivals |
| Monferrato Region | Famous for its vineyards and scenic landscapes, this surrounding area attracts wine lovers and those interested in exploring the Piedmont countryside. | Vineyard tours, Wine tasting, Hiking trails, Breathtaking views, Local gastronomy |
| Sant'Antonio | Residential area near the town center, appealing to visitors seeking a quieter stay without being far from attractions and amenities. | Local markets, Nearby shops, Parks and gardens, Cultural sites, Public transport access |
| Novi Ligure Outlets | Close to famous outlet shopping centers, drawing fashion enthusiasts and bargain hunters looking for deals on designer items. | Serravalle Designer Outlet, Shopping deals, Dining options nearby, Entertainment facilities, Seasonal events |
| Piazza della Libertà | A central square that serves as a hub for events and gatherings. Great for tourists who want to experience local life and cultural events. | Local festivals, Cafes and restaurants, Cultural performances, Historical monuments, Market days |
| Borgo di Novi | A charming part of town with historical architecture and local character, ideal for those wanting an authentic experience of the region. | Historical landmarks, Community events, Artisan shops, Scenic views, Cultural heritage |
Understanding Airbnb License Requirements & STR Laws in Novi Ligure (2025)
Yes, Novi Ligure, Piedmont, Italy enforces high STR regulations. Obtaining a license and ensuring compliance is almost certainly required according to current 2025 STR laws. Always verify the latest short term rental regulations and Airbnb license requirements directly with local government authorities for Novi Ligure to ensure full compliance before hosting.
(Source: AirROI data, 2025, based on 81% licensed listings)
Top Performing Airbnb Properties in Novi Ligure (2025)
Benchmark your potential! Explore examples of top-performing Airbnb properties in Novi Ligurebased on Trailing Twelve Month (TTM) revenue. Analyze their characteristics, revenue, occupancy rate, and ADR to understand what drives success in this market.
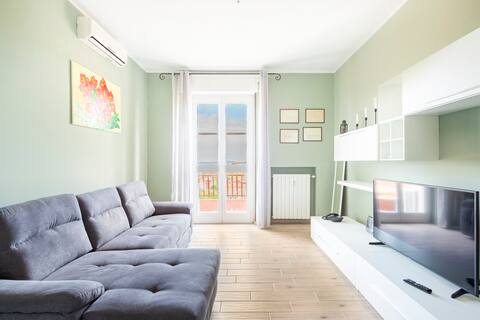
Spacious with view,5 minutes to Outlet Serravalle
Entire Place • 2 bedrooms

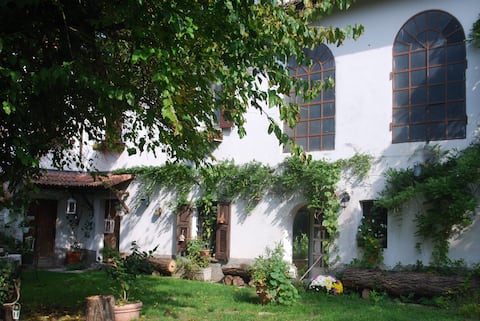
Ancient Villa with pool in wineyard
Entire Place • 5 bedrooms
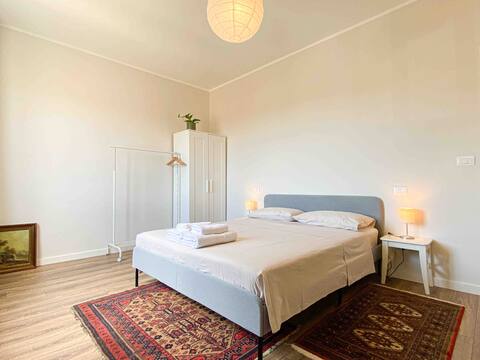
CasaJila
Entire Place • 1 bedroom
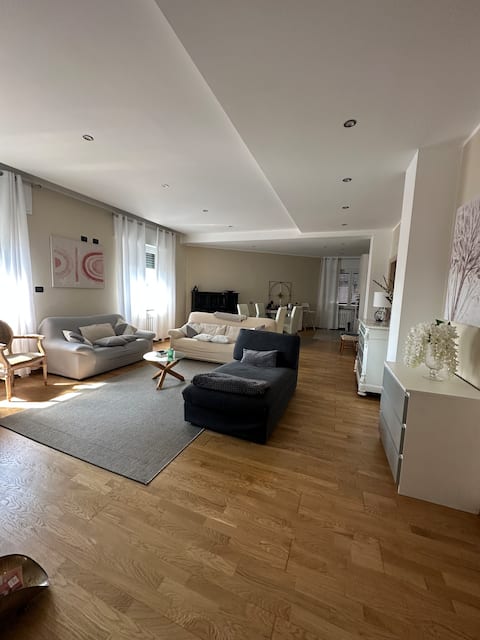
Luxury Apartment
Entire Place • 2 bedrooms
GREEN HOUSE
Entire Place • 2 bedrooms

Novi Outlet Apartment Air conditioning
Entire Place • 1 bedroom
Note: Performance varies based on location, size, amenities, seasonality, and management quality. Data reflects the past 12 months.
Top Performing Airbnb Hosts in Novi Ligure (2025)
Learn from the best! This table showcases top-performing Airbnb hosts in Novi Ligure based on the number of properties managed and estimated total revenue over the past year. Analyze their scale and performance metrics.
| Host Name | Properties | Grossing Revenue | Stay Reviews | Avg Rating |
|---|---|---|---|---|
| Andrea | 4 | $63,028 | 141 | 4.76/5.0 |
| Gianluca | 1 | $42,390 | 20 | 4.85/5.0 |
| Cascina | 2 | $34,679 | 90 | 4.33/5.0 |
| Paola Francesca | 2 | $29,393 | 203 | 4.89/5.0 |
| Francesco | 1 | $25,745 | 22 | 4.64/5.0 |
| Jila | 1 | $23,794 | 222 | 4.95/5.0 |
| Marcela | 1 | $23,575 | 19 | 4.68/5.0 |
| Dario | 1 | $22,389 | 15 | 4.93/5.0 |
| Federica | 2 | $21,190 | 31 | 4.86/5.0 |
| Sergio | 2 | $20,173 | 31 | 4.98/5.0 |
Analyzing the strategies of top hosts, such as their property selection, pricing, and guest communication, can offer valuable lessons for optimizing your own Airbnb operations in Novi Ligure.
Dive Deeper: Advanced Novi Ligure STR Market Data (2025)
Ready to unlock more insights? AirROI provides access to advanced metrics and comprehensive Airbnb data for Novi Ligure. Explore detailed analytics beyond this report to refine your investment strategy, optimize pricing, and maximize your vacation rental profits.
Explore Advanced MetricsNovi Ligure Short-Term Rental Market Composition (2025): Property & Room Types
Room Type Distribution
Property Type Distribution
Market Composition Insights for Novi Ligure
- The Novi Ligure Airbnb market composition is heavily skewed towards Entire Home/Apt listings, which make up 80.6% of the 31 active rentals. This indicates strong guest preference for privacy and space.
- Looking at the property type distribution in Novi Ligure, Apartment/Condo properties are the most common (54.8%), reflecting the local real estate landscape.
- Houses represent a significant 29% portion, catering likely to families or larger groups.
- The presence of 9.7% Hotel/Boutique listings indicates integration with traditional hospitality.
Novi Ligure Airbnb Room Capacity Analysis (2025): Bedroom Distribution
Distribution of Listings by Number of Bedrooms
Room Capacity Insights for Novi Ligure
- The dominant room capacity in Novi Ligure is 1 bedroom listings, making up 67.7% of the market. This suggests a strong demand for properties suitable for couples or solo travelers.
- Together, 1 bedroom and 2 bedrooms properties represent 90.3% of the active Airbnb listings in Novi Ligure, indicating a high concentration in these sizes.
- With over half the market (67.7%) consisting of studios or 1-bedroom units, Novi Ligure is particularly well-suited for individuals or couples.
- Listings with 3+ bedrooms (3.2%) represent a smaller niche, potentially indicating an underserved market for larger group accommodations in Novi Ligure.
Novi Ligure Vacation Rental Guest Capacity Trends (2025)
Distribution of Listings by Guest Capacity
Guest Capacity Insights for Novi Ligure
- The most common guest capacity trend in Novi Ligure vacation rentals is listings accommodating 4 guests (32.3%). This suggests the primary traveler segment is likely small families or groups.
- Properties designed for 4 guests and 2 guests dominate the Novi Ligure STR market, accounting for 58.1% of listings.
- Listings for large groups (6+ guests) are relatively rare (3.2%), potentially indicating an opportunity for hosts targeting this segment in Novi Ligure.
- On average, properties in Novi Ligure are equipped to host 3.1 guests.
Novi Ligure Airbnb Booking Patterns (2025): Available vs. Booked Days
Available Days Distribution
Booked Days Distribution
Booking Pattern Insights for Novi Ligure
- The most common availability pattern in Novi Ligure falls within the 271-366 days range, representing 41.9% of listings. This suggests many properties have significant open periods on their calendars.
- Approximately 70.9% of listings show high availability (181+ days open annually), indicating potential for increased bookings or specific owner usage patterns.
- For booked days, the 31-90 days range is most frequent in Novi Ligure (38.7%), reflecting common guest stay durations or potential owner blocking patterns.
- A notable 38.8% of properties secure long booking periods (181+ days booked per year), highlighting successful long-term rental strategies or significant owner usage.
Novi Ligure Airbnb Minimum Stay Requirements Analysis
Distribution of Listings by Minimum Night Requirement
1 Night
23 listings
74.2% of total
2 Nights
3 listings
9.7% of total
3 Nights
1 listings
3.2% of total
4-6 Nights
2 listings
6.5% of total
7-29 Nights
2 listings
6.5% of total
Key Insights
- The most prevalent minimum stay requirement in Novi Ligure is 1 Night, adopted by 74.2% of listings. This highlights the market's preference for shorter, flexible bookings.
- A strong majority (83.9%) of the Novi Ligure Airbnb data shows acceptance of very short stays (1-2 nights), indicating a dynamic, high-turnover market.
Recommendations
- Align with the market by considering a 1 Night minimum stay, as 74.2% of Novi Ligure hosts use this setting.
- Adjust minimum nights based on seasonality – potentially shorter during low season and longer during peak demand periods in Novi Ligure.
Novi Ligure Airbnb Cancellation Policy Trends Analysis (2025)
Super Strict 30 Days
1 listings
3.6% of total
Flexible
14 listings
50% of total
Moderate
12 listings
42.9% of total
Strict
1 listings
3.6% of total
Cancellation Policy Insights for Novi Ligure
- The prevailing Airbnb cancellation policy trend in Novi Ligure is Flexible, used by 50% of listings.
- The market strongly favors guest-friendly terms, with 92.9% of listings offering Flexible or Moderate policies. This suggests guests in Novi Ligure may expect booking flexibility.
- Strict cancellation policies are quite rare (3.6%), potentially making listings with this policy less competitive unless justified by high demand or property type.
Recommendations for Hosts
- Consider adopting a Flexible policy to align with the 50% market standard in Novi Ligure.
- Using a Strict policy might deter some guests, as only 3.6% of listings use it. Evaluate if potential revenue protection outweighs possible lower booking rates.
- Regularly review your cancellation policy against competitors and market demand shifts in Novi Ligure.
Novi Ligure STR Booking Lead Time Analysis (2025)
Average Booking Lead Time by Month
Booking Lead Time Insights for Novi Ligure
- The overall average booking lead time for vacation rentals in Novi Ligure is 39 days.
- Guests book furthest in advance for stays during July (average 69 days), likely coinciding with peak travel demand or local events.
- The shortest booking windows occur for stays in January (average 24 days), indicating more last-minute travel plans during this time.
- Seasonally, Summer (68 days avg.) sees the longest lead times, while Winter (33 days avg.) has the shortest, reflecting typical travel planning cycles.
Recommendations for Hosts
- Use the overall average lead time (39 days) as a baseline for your pricing and availability strategy in Novi Ligure.
- For July stays, consider implementing length-of-stay discounts or slightly higher rates for bookings made less than 69 days out to capitalize on advance planning.
- Target marketing efforts for the Summer season well in advance (at least 68 days) to capture early planners.
- Monitor your own booking lead times against these Novi Ligure averages to identify opportunities for dynamic pricing adjustments.
Popular & Essential Airbnb Amenities in Novi Ligure (2025)
Amenity Prevalence
Amenity Insights for Novi Ligure
- Popular amenities like Heating, TV, Wifi are common but not universal. Offering these can provide a competitive edge.
- Warning: Wifi is not universally provided but is considered essential globally. Ensure reliable Wifi is offered.
Recommendations for Hosts
- Consider adding popular differentiators like Heating or TV to increase appeal.
- Highlight unique or less common amenities you offer (e.g., hot tub, dedicated workspace, EV charger) in your listing description and photos.
- Regularly check competitor amenities in Novi Ligure to stay competitive.
Novi Ligure Airbnb Guest Demographics & Profile Analysis (2025)
Guest Profile Summary for Novi Ligure
- The typical guest profile for Airbnb in Novi Ligure consists of predominantly international visitors (79%), with top international origins including Italy, typically belonging to the Post-2000s (Gen Z/Alpha) group (50%), primarily speaking English or French.
- Domestic travelers account for 21.2% of guests.
- Key international markets include France (24.8%) and Italy (21.2%).
- Top languages spoken are English (37%) followed by French (16.7%).
- A significant demographic segment is the Post-2000s (Gen Z/Alpha) group, representing 50% of guests.
Recommendations for Hosts
- Focus marketing internationally, particularly towards travelers from Italy.
- Tailor amenities and listing descriptions to appeal to the dominant Post-2000s (Gen Z/Alpha) demographic (e.g., highlight fast WiFi, smart home features, local guides).
- Highlight unique local experiences or amenities relevant to the primary guest profile.
- Consider seasonal promotions aligned with peak travel times for key origin markets.
Nearby Short-Term Rental Market Comparison
How does the Novi Ligure Airbnb market stack up against its neighbors? Compare key performance metrics like average monthly revenue, ADR, and occupancy rates in surrounding areas to understand the broader regional STR landscape.
| Market | Active Properties | Monthly Revenue | Daily Rate | Avg. Occupancy |
|---|---|---|---|---|
| Laglio | 64 | $4,873 | $463.61 | 47% |
| Monteu Roero | 16 | $4,432 | $540.14 | 36% |
| Portofino | 68 | $4,086 | $454.35 | 44% |
| Saint-Jean-Cap-Ferrat | 107 | $3,844 | $424.21 | 46% |
| Sala Comacina | 64 | $3,794 | $400.27 | 50% |
| Cossano Belbo | 13 | $3,632 | $284.21 | 42% |
| Bellagio | 373 | $3,630 | $328.26 | 55% |
| Oliveto Lario | 99 | $3,509 | $327.42 | 55% |
| Carate Urio | 71 | $3,379 | $331.90 | 44% |
| Brienno | 39 | $3,327 | $337.92 | 45% |