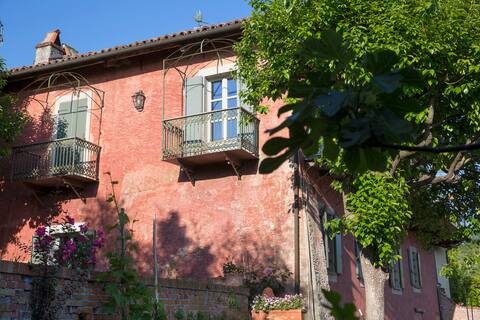
Murazzano Airbnb Market Analysis 2025: Short Term Rental Data & Vacation Rental Statistics in Piedmont, Italy
Is Airbnb profitable in Murazzano in 2025? Explore comprehensive Airbnb analytics for Murazzano, Piedmont, Italy to uncover income potential. This 2025 STR market report for Murazzano, based on AirROI data from April 2024 to March 2025, reveals key trends in the niche market of 21 active listings.
Whether you're considering an Airbnb investment in Murazzano, optimizing your existing vacation rental, or exploring rental arbitrage opportunities, understanding the Murazzano Airbnb data is crucial. Navigating the high regulation landscape is key to maximizing your short term rental income potential. Let's dive into the specifics.
Key Murazzano Airbnb Performance Metrics Overview
Monthly Airbnb Revenue Variations & Income Potential in Murazzano (2025)
Understanding the monthly revenue variations for Airbnb listings in Murazzano is key to maximizing your short term rental income potential. Seasonality significantly impacts earnings. Our analysis, based on data from the past 12 months, shows that the peak revenue month for STRs in Murazzano is typically April, while March often presents the lowest earnings, highlighting opportunities for strategic pricing adjustments during shoulder and low seasons. Explore the typical Airbnb income in Murazzano across different performance tiers:
- Best-in-class properties (Top 10%) achieve $4,276+ monthly, often utilizing dynamic pricing and superior guest experiences.
- Strong performing properties (Top 25%) earn $1,905 or more, indicating effective management and desirable locations/amenities.
- Typical properties (Median) generate around $1,212 per month, representing the average market performance.
- Entry-level properties (Bottom 25%) see earnings around $584, often with potential for optimization.
Average Monthly Airbnb Earnings Trend in Murazzano
Murazzano Airbnb Occupancy Rate Trends (2025)
Maximize your bookings by understanding the Murazzano STR occupancy trends. Seasonal demand shifts significantly influence how often properties are booked. Typically, Augustsees the highest demand (peak season occupancy), while May experiences the lowest (low season). Effective strategies, like adjusting minimum stays or offering promotions, can boost occupancy during slower periods. Here's how different property tiers perform in Murazzano:
- Best-in-class properties (Top 10%) achieve 55%+ occupancy, indicating high desirability and potentially optimized availability.
- Strong performing properties (Top 25%) maintain 40% or higher occupancy, suggesting good market fit and guest satisfaction.
- Typical properties (Median) have an occupancy rate around 27%.
- Entry-level properties (Bottom 25%) average 12% occupancy, potentially facing higher vacancy.
Average Monthly Occupancy Rate Trend in Murazzano
Average Daily Rate (ADR) Airbnb Trends in Murazzano (2025)
Effective short term rental pricing strategy in Murazzano involves understanding monthly ADR fluctuations. The Average Daily Rate (ADR) for Airbnb in Murazzano typically peaks in July and dips lowest during March. Leveraging Airbnb dynamic pricing tools or strategies based on this seasonality can significantly boost revenue. Here's a look at the typical nightly rates achieved:
- Best-in-class properties (Top 10%) command rates of $204+ per night, often due to premium features or locations.
- Strong performing properties (Top 25%) achieve nightly rates of $168 or more.
- Typical properties (Median) charge around $133 per night.
- Entry-level properties (Bottom 25%) earn around $96 per night.
Average Daily Rate (ADR) Trend by Month in Murazzano
Get Live Murazzano Market Intelligence 👇

Explore Real-time Analytics
Airbnb Seasonality Analysis & Trends in Murazzano (2025)
Peak Season (April, August, July)
- Revenue averages $3,074 per month
- Occupancy rates average 41.6%
- Daily rates average $179
Shoulder Season
- Revenue averages $1,420 per month
- Occupancy maintains around 27.0%
- Daily rates hold near $168
Low Season (January, March, October)
- Revenue drops to average $838 per month
- Occupancy decreases to average 24.9%
- Daily rates adjust to average $162
Seasonality Insights for Murazzano
- The Airbnb seasonality in Murazzano shows highly seasonal trends requiring careful strategy. While the sections above show seasonal averages, it's also insightful to look at the extremes:
- During the high season, the absolute peak month showcases Murazzano's highest earning potential, with monthly revenues capable of climbing to $3,474, occupancy reaching a high of 52.2%, and ADRs peaking at $182.
- Conversely, the slowest single month of the year, typically falling within the low season, marks the market's lowest point. In this month, revenue might dip to $680, occupancy could drop to 19.4%, and ADRs may adjust down to $154.
- Understanding both the seasonal averages and these monthly peaks and troughs in revenue, occupancy, and ADR is crucial for maximizing your Airbnb profit potential in Murazzano.
Seasonal Strategies for Maximizing Profit
- Peak Season: Maximize revenue through premium pricing and potentially longer minimum stays. Ensure high availability.
- Low Season: Offer competitive pricing, special promotions (e.g., extended stay discounts), and flexible cancellation policies. Target off-season travelers like remote workers or budget-conscious guests.
- Shoulder Seasons: Implement dynamic pricing that balances peak and low rates. Target weekend travelers or specific events. Offer slightly more flexible terms than peak season.
- Regularly analyze your own performance against these Murazzano seasonality benchmarks and adjust your pricing and availability strategy accordingly.
Best Areas for Airbnb Investment in Murazzano (2025)
Exploring the top neighborhoods for short-term rentals in Murazzano? This section highlights key areas, outlining why they are attractive for hosts and guests, along with notable local attractions. Consider these locations based on your target guest profile and investment strategy.
| Neighborhood / Area | Why Host Here? (Target Guests & Appeal) | Key Attractions & Landmarks |
|---|---|---|
| Murazzano Old Town | Charming medieval village with narrow streets and traditional architecture, perfect for tourists looking for an authentic Italian experience. It's conveniently located for exploring the surrounding vineyard-covered hills. | Church of San Giovanni Battista, Castello di Murazzano, Piedmont wine tours, Local trattorias and cafes, Scenic countryside views |
| Langhe Region | Famous for its wines and gastronomy, the Langhe Region attracts visitors who are food and wine enthusiasts. Perfect for creating a getaway experience with wine tastings and local cuisine. | Barolo Wine Region, Truffle hunting experiences, Local wineries, Restaurants featuring Piedmontese cuisine, Scenic vineyard landscapes |
| Dogliani | Close to Murazzano, this town is known for its Dolcetto wine and offers a peaceful atmosphere. It's great for guests seeking tranquility and wine culture. | Dogliani's historical center, Cantina Comunale di Dogliani, Cascina L'Abbadia, Wine tasting tours, Close to hiking trails |
| Monforte d'Alba | A picturesque village renowned for its stunning views and wine production. Attracts tourists looking for beauty and relaxation in a rural setting. | Monforte d'Alba castle, Wine bars and enotecas, Vineyard walks, Annual music and cultural festivals, Breathtaking viewpoints |
| Santo Stefano Belbo | Known for its cultural ties to the famous writer Cesare Pavese, this area is appealing to literary lovers who want to explore the Italian countryside. | Casa Natale di Cesare Pavese, Wine estates, Outdoor hiking paths, Local food markets, Cultural festivals |
| Castiglione Falletto | This small village offers stunning landscapes and an authentic rural experience, making it perfect for those seeking peace and natural beauty. | Castiglione Falletto castle, Vineyard experiences, Local enogastronomy tours, Cultural traditions, Proximity to larger towns |
| La Morra | Famous for its wine and panoramic views, La Morra is a must-visit for wine lovers and those interested in stunning scenery. | Belvedere di La Morra, Local wineries, Traditional food festivals, Cultural events, Vineyard tours |
| Barolo | Renowned for the prestigious Barolo wine, this area is a hotspot for tourists seeking wine tastings, elegant dining, and beautiful landscapes. | Barolo Wine Museum, Wineries and wine tastings, Castello Falletti di Barolo, Culinary experiences, Nearby hiking trails |
Understanding Airbnb License Requirements & STR Laws in Murazzano (2025)
Yes, Murazzano, Piedmont, Italy enforces high STR regulations. Obtaining a license and ensuring compliance is almost certainly required according to current 2025 STR laws. Always verify the latest short term rental regulations and Airbnb license requirements directly with local government authorities for Murazzano to ensure full compliance before hosting.
(Source: AirROI data, 2025, based on 86% licensed listings)
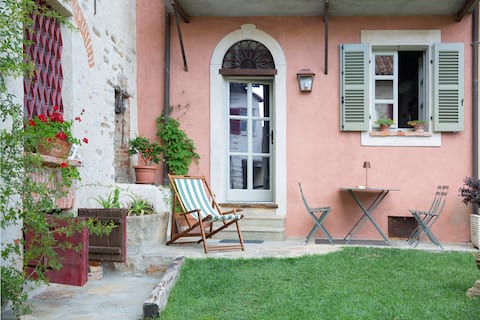
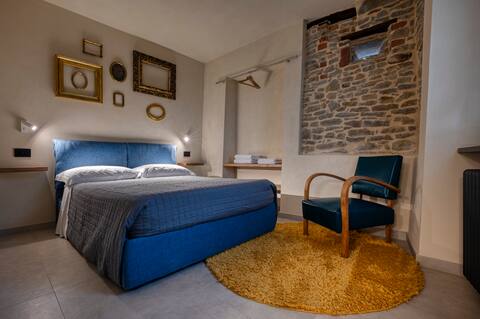
Top Performing Airbnb Properties in Murazzano (2025)
Benchmark your potential! Explore examples of top-performing Airbnb properties in Murazzanobased on Trailing Twelve Month (TTM) revenue. Analyze their characteristics, revenue, occupancy rate, and ADR to understand what drives success in this market.
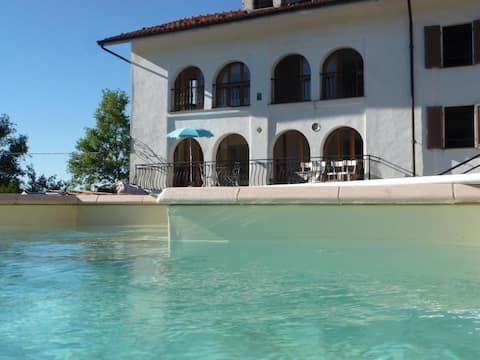
Villa Cadenza with Pool - Langhe, Piemonte
Entire Place • 6 bedrooms
Murazzano, an independent House for all seasons
Entire Place • 1 bedroom
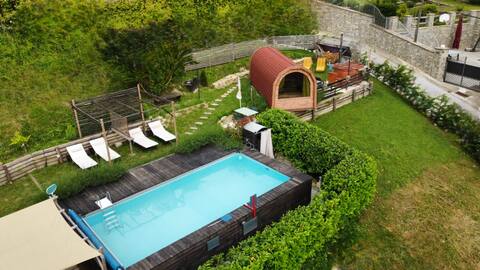
Il Bricco del Trobolo sleep in an unusual place
Private Room • 1 bedroom
Margot's House - Blue
Entire Place • 1 bedroom
MURAZZANO, A SECRET GARDEN OVERLOOKING THE LANGHE
Private Room • N/A
Langhetta's house - Alta Langa
Entire Place • 1 bedroom
Note: Performance varies based on location, size, amenities, seasonality, and management quality. Data reflects the past 12 months.
Top Performing Airbnb Hosts in Murazzano (2025)
Learn from the best! This table showcases top-performing Airbnb hosts in Murazzano based on the number of properties managed and estimated total revenue over the past year. Analyze their scale and performance metrics.
| Host Name | Properties | Grossing Revenue | Stay Reviews | Avg Rating |
|---|---|---|---|---|
| Shaminder | 1 | $63,308 | 46 | 4.72/5.0 |
| Clemente | 5 | $59,971 | 78 | 4.90/5.0 |
| Joelle | 3 | $47,000 | 180 | 4.99/5.0 |
| Piercarlo | 3 | $34,239 | 22 | 4.96/5.0 |
| Tea | 3 | $30,878 | 31 | 3.32/5.0 |
| Francesca | 1 | $17,856 | 12 | 5.00/5.0 |
| Francesca | 1 | $9,229 | 10 | 4.80/5.0 |
| Host #153921150 | 1 | $7,125 | 0 | 0.00/5.0 |
| Emilio | 1 | $4,642 | 4 | 5.00/5.0 |
| Laura | 2 | $1,646 | 12 | 5.00/5.0 |
Analyzing the strategies of top hosts, such as their property selection, pricing, and guest communication, can offer valuable lessons for optimizing your own Airbnb operations in Murazzano.
Dive Deeper: Advanced Murazzano STR Market Data (2025)
Ready to unlock more insights? AirROI provides access to advanced metrics and comprehensive Airbnb data for Murazzano. Explore detailed analytics beyond this report to refine your investment strategy, optimize pricing, and maximize your vacation rental profits.
Explore Advanced MetricsMurazzano Short-Term Rental Market Composition (2025): Property & Room Types
Room Type Distribution
Property Type Distribution
Market Composition Insights for Murazzano
- The Murazzano Airbnb market composition is heavily skewed towards Entire Home/Apt listings, which make up 76.2% of the 21 active rentals. This indicates strong guest preference for privacy and space.
- Looking at the property type distribution in Murazzano, House properties are the most common (47.6%), reflecting the local real estate landscape.
- Houses represent a significant 47.6% portion, catering likely to families or larger groups.
- The presence of 14.3% Hotel/Boutique listings indicates integration with traditional hospitality.
Murazzano Airbnb Room Capacity Analysis (2025): Bedroom Distribution
Distribution of Listings by Number of Bedrooms
Room Capacity Insights for Murazzano
- The dominant room capacity in Murazzano is 1 bedroom listings, making up 61.9% of the market. This suggests a strong demand for properties suitable for couples or solo travelers.
- Together, 1 bedroom and 2 bedrooms properties represent 76.2% of the active Airbnb listings in Murazzano, indicating a high concentration in these sizes.
- With over half the market (61.9%) consisting of studios or 1-bedroom units, Murazzano is particularly well-suited for individuals or couples.
- Listings with 3+ bedrooms (9.6%) represent a smaller niche, potentially indicating an underserved market for larger group accommodations in Murazzano.
Murazzano Vacation Rental Guest Capacity Trends (2025)
Distribution of Listings by Guest Capacity
Guest Capacity Insights for Murazzano
- The most common guest capacity trend in Murazzano vacation rentals is listings accommodating 4 guests (38.1%). This suggests the primary traveler segment is likely small families or groups.
- Properties designed for 4 guests and 2 guests dominate the Murazzano STR market, accounting for 61.9% of listings.
- On average, properties in Murazzano are equipped to host 3.3 guests.
Murazzano Airbnb Booking Patterns (2025): Available vs. Booked Days
Available Days Distribution
Booked Days Distribution
Booking Pattern Insights for Murazzano
- The most common availability pattern in Murazzano falls within the 271-366 days range, representing 57.1% of listings. This suggests many properties have significant open periods on their calendars.
- Approximately 90.4% of listings show high availability (181+ days open annually), indicating potential for increased bookings or specific owner usage patterns.
- For booked days, the 31-90 days range is most frequent in Murazzano (42.9%), reflecting common guest stay durations or potential owner blocking patterns.
- A notable 9.5% of properties secure long booking periods (181+ days booked per year), highlighting successful long-term rental strategies or significant owner usage.
Murazzano Airbnb Minimum Stay Requirements Analysis
Distribution of Listings by Minimum Night Requirement
1 Night
4 listings
20% of total
2 Nights
6 listings
30% of total
3 Nights
1 listings
5% of total
4-6 Nights
5 listings
25% of total
7-29 Nights
1 listings
5% of total
30+ Nights
3 listings
15% of total
Key Insights
- The most prevalent minimum stay requirement in Murazzano is 2 Nights, adopted by 30% of listings. This highlights the market's preference for shorter, flexible bookings.
- A significant segment (15%) caters to monthly stays (30+ nights) in Murazzano, pointing to opportunities in the extended-stay market.
Recommendations
- Align with the market by considering a 2 Nights minimum stay, as 30% of Murazzano hosts use this setting.
- If feasible, allowing 1-night stays, especially midweek or during low season, could capture last-minute bookings, as only 20% currently do.
- Explore offering discounts for stays of 30+ nights to attract the 15% of the market seeking extended stays.
- Adjust minimum nights based on seasonality – potentially shorter during low season and longer during peak demand periods in Murazzano.
Murazzano Airbnb Cancellation Policy Trends Analysis (2025)
Flexible
1 listings
5.3% of total
Moderate
8 listings
42.1% of total
Strict
10 listings
52.6% of total
Cancellation Policy Insights for Murazzano
- The prevailing Airbnb cancellation policy trend in Murazzano is Strict, used by 52.6% of listings.
- A majority (52.6%) of hosts in Murazzano utilize Firm or Strict policies, indicating a market where hosts prioritize booking security.
Recommendations for Hosts
- Consider adopting a Strict policy to align with the 52.6% market standard in Murazzano.
- With 52.6% using Strict terms, this is a viable option in Murazzano, particularly for high-value properties or during peak demand periods.
- Regularly review your cancellation policy against competitors and market demand shifts in Murazzano.
Murazzano STR Booking Lead Time Analysis (2025)
Average Booking Lead Time by Month
Booking Lead Time Insights for Murazzano
- The overall average booking lead time for vacation rentals in Murazzano is 59 days.
- Guests book furthest in advance for stays during August (average 114 days), likely coinciding with peak travel demand or local events.
- The shortest booking windows occur for stays in November (average 23 days), indicating more last-minute travel plans during this time.
- Seasonally, Summer (96 days avg.) sees the longest lead times, while Winter (43 days avg.) has the shortest, reflecting typical travel planning cycles.
Recommendations for Hosts
- Use the overall average lead time (59 days) as a baseline for your pricing and availability strategy in Murazzano.
- For August stays, consider implementing length-of-stay discounts or slightly higher rates for bookings made less than 114 days out to capitalize on advance planning.
- Target marketing efforts for the Summer season well in advance (at least 96 days) to capture early planners.
- Monitor your own booking lead times against these Murazzano averages to identify opportunities for dynamic pricing adjustments.
Popular & Essential Airbnb Amenities in Murazzano (2025)
Amenity Prevalence
Amenity Insights for Murazzano
- Essential amenities in Murazzano that guests expect include: Hair dryer, Essentials, Hot water, Wifi, Private entrance, Hangers. Lacking these (any) could significantly impact bookings.
- Popular amenities like Refrigerator, Kitchen, Heating are common but not universal. Offering these can provide a competitive edge.
Recommendations for Hosts
- Ensure your listing includes all essential amenities for Murazzano: Hair dryer, Essentials, Hot water, Wifi, Private entrance, Hangers.
- Prioritize adding missing essentials: Hot water, Wifi, Private entrance, Hangers.
- Consider adding popular differentiators like Refrigerator or Kitchen to increase appeal.
- Highlight unique or less common amenities you offer (e.g., hot tub, dedicated workspace, EV charger) in your listing description and photos.
- Regularly check competitor amenities in Murazzano to stay competitive.
Murazzano Airbnb Guest Demographics & Profile Analysis (2025)
Guest Profile Summary for Murazzano
- The typical guest profile for Airbnb in Murazzano consists of predominantly international visitors (74%), with top international origins including Germany, typically belonging to the Post-2000s (Gen Z/Alpha) group (50%), primarily speaking English or Italian.
- Domestic travelers account for 26.2% of guests.
- Key international markets include Italy (26.2%) and Germany (13.8%).
- Top languages spoken are English (34.1%) followed by Italian (20%).
- A significant demographic segment is the Post-2000s (Gen Z/Alpha) group, representing 50% of guests.
Recommendations for Hosts
- Focus marketing internationally, particularly towards travelers from Germany.
- Tailor amenities and listing descriptions to appeal to the dominant Post-2000s (Gen Z/Alpha) demographic (e.g., highlight fast WiFi, smart home features, local guides).
- Highlight unique local experiences or amenities relevant to the primary guest profile.
- Consider seasonal promotions aligned with peak travel times for key origin markets.
Nearby Short-Term Rental Market Comparison
How does the Murazzano Airbnb market stack up against its neighbors? Compare key performance metrics like average monthly revenue, ADR, and occupancy rates in surrounding areas to understand the broader regional STR landscape.
| Market | Active Properties | Monthly Revenue | Daily Rate | Avg. Occupancy |
|---|---|---|---|---|
| Laglio | 64 | $4,873 | $463.61 | 47% |
| Monteu Roero | 16 | $4,432 | $540.14 | 36% |
| Portofino | 68 | $4,086 | $454.35 | 44% |
| Saint-Jean-Cap-Ferrat | 107 | $3,844 | $424.21 | 46% |
| Sala Comacina | 64 | $3,794 | $400.27 | 50% |
| Cossano Belbo | 13 | $3,632 | $284.21 | 42% |
| Bellagio | 373 | $3,630 | $328.26 | 55% |
| Oliveto Lario | 99 | $3,509 | $327.42 | 55% |
| Carate Urio | 71 | $3,379 | $331.90 | 44% |
| Brienno | 39 | $3,327 | $337.92 | 45% |