Macugnaga Airbnb Market Analysis 2025: Short Term Rental Data & Vacation Rental Statistics in Piedmont, Italy
Is Airbnb profitable in Macugnaga in 2025? Explore comprehensive Airbnb analytics for Macugnaga, Piedmont, Italy to uncover income potential. This 2025 STR market report for Macugnaga, based on AirROI data from April 2024 to March 2025, reveals key trends in the niche market of 25 active listings.
Whether you're considering an Airbnb investment in Macugnaga, optimizing your existing vacation rental, or exploring rental arbitrage opportunities, understanding the Macugnaga Airbnb data is crucial. Navigating the high regulation landscape is key to maximizing your short term rental income potential. Let's dive into the specifics.
Key Macugnaga Airbnb Performance Metrics Overview
Monthly Airbnb Revenue Variations & Income Potential in Macugnaga (2025)
Understanding the monthly revenue variations for Airbnb listings in Macugnaga is key to maximizing your short term rental income potential. Seasonality significantly impacts earnings. Our analysis, based on data from the past 12 months, shows that the peak revenue month for STRs in Macugnaga is typically July, while October often presents the lowest earnings, highlighting opportunities for strategic pricing adjustments during shoulder and low seasons. Explore the typical Airbnb income in Macugnaga across different performance tiers:
- Best-in-class properties (Top 10%) achieve $2,826+ monthly, often utilizing dynamic pricing and superior guest experiences.
- Strong performing properties (Top 25%) earn $1,787 or more, indicating effective management and desirable locations/amenities.
- Typical properties (Median) generate around $1,080 per month, representing the average market performance.
- Entry-level properties (Bottom 25%) see earnings around $565, often with potential for optimization.
Average Monthly Airbnb Earnings Trend in Macugnaga
Macugnaga Airbnb Occupancy Rate Trends (2025)
Maximize your bookings by understanding the Macugnaga STR occupancy trends. Seasonal demand shifts significantly influence how often properties are booked. Typically, Julysees the highest demand (peak season occupancy), while October experiences the lowest (low season). Effective strategies, like adjusting minimum stays or offering promotions, can boost occupancy during slower periods. Here's how different property tiers perform in Macugnaga:
- Best-in-class properties (Top 10%) achieve 57%+ occupancy, indicating high desirability and potentially optimized availability.
- Strong performing properties (Top 25%) maintain 38% or higher occupancy, suggesting good market fit and guest satisfaction.
- Typical properties (Median) have an occupancy rate around 21%.
- Entry-level properties (Bottom 25%) average 14% occupancy, potentially facing higher vacancy.
Average Monthly Occupancy Rate Trend in Macugnaga
Average Daily Rate (ADR) Airbnb Trends in Macugnaga (2025)
Effective short term rental pricing strategy in Macugnaga involves understanding monthly ADR fluctuations. The Average Daily Rate (ADR) for Airbnb in Macugnaga typically peaks in August and dips lowest during November. Leveraging Airbnb dynamic pricing tools or strategies based on this seasonality can significantly boost revenue. Here's a look at the typical nightly rates achieved:
- Best-in-class properties (Top 10%) command rates of $264+ per night, often due to premium features or locations.
- Strong performing properties (Top 25%) achieve nightly rates of $208 or more.
- Typical properties (Median) charge around $143 per night.
- Entry-level properties (Bottom 25%) earn around $104 per night.
Average Daily Rate (ADR) Trend by Month in Macugnaga
Get Live Macugnaga Market Intelligence 👇

Explore Real-time Analytics
Airbnb Seasonality Analysis & Trends in Macugnaga (2025)
Peak Season (July, August, December)
- Revenue averages $2,276 per month
- Occupancy rates average 45.0%
- Daily rates average $174
Shoulder Season
- Revenue averages $1,132 per month
- Occupancy maintains around 23.0%
- Daily rates hold near $168
Low Season (March, October, November)
- Revenue drops to average $800 per month
- Occupancy decreases to average 17.4%
- Daily rates adjust to average $161
Seasonality Insights for Macugnaga
- The Airbnb seasonality in Macugnaga shows highly seasonal trends requiring careful strategy. While the sections above show seasonal averages, it's also insightful to look at the extremes:
- During the high season, the absolute peak month showcases Macugnaga's highest earning potential, with monthly revenues capable of climbing to $2,804, occupancy reaching a high of 56.8%, and ADRs peaking at $178.
- Conversely, the slowest single month of the year, typically falling within the low season, marks the market's lowest point. In this month, revenue might dip to $517, occupancy could drop to 11.3%, and ADRs may adjust down to $156.
- Understanding both the seasonal averages and these monthly peaks and troughs in revenue, occupancy, and ADR is crucial for maximizing your Airbnb profit potential in Macugnaga.
Seasonal Strategies for Maximizing Profit
- Peak Season: Maximize revenue through premium pricing and potentially longer minimum stays. Ensure high availability.
- Low Season: Offer competitive pricing, special promotions (e.g., extended stay discounts), and flexible cancellation policies. Target off-season travelers like remote workers or budget-conscious guests.
- Shoulder Seasons: Implement dynamic pricing that balances peak and low rates. Target weekend travelers or specific events. Offer slightly more flexible terms than peak season.
- Regularly analyze your own performance against these Macugnaga seasonality benchmarks and adjust your pricing and availability strategy accordingly.
Best Areas for Airbnb Investment in Macugnaga (2025)
Exploring the top neighborhoods for short-term rentals in Macugnaga? This section highlights key areas, outlining why they are attractive for hosts and guests, along with notable local attractions. Consider these locations based on your target guest profile and investment strategy.
| Neighborhood / Area | Why Host Here? (Target Guests & Appeal) | Key Attractions & Landmarks |
|---|---|---|
| Frazione Staffa | A picturesque village with stunning views of the surrounding mountains and easy access to hiking and winter sports. Ideal for guests seeking a peaceful mountain retreat and outdoor adventures. | Monte Rosa, Antigorio Valley, Hiking trails, Natural parks, Ski resorts |
| Macugnaga | The main town of Macugnaga is vibrant with local shops, restaurants, and a rich history related to mountain climbing and skiing. Visitors can enjoy both cultural and outdoor activities here. | Walser Museum, Bergamot gondola, Ski Macugnaga, Local cuisine, Historical sites |
| Frazione Borca | Known for its tranquil atmosphere and beautiful landscapes, this fraction offers an authentic Italian mountain experience, perfect for families and couples. | Valley views, Rural hikes, Traditional Walser architecture, Local festivals, Nature trails |
| Frazione Pecetto | This area provides a secluded getaway amidst nature. It attracts those looking for an escape and moments of relaxation, making it ideal for boutique Airbnb hosting. | Peaceful environment, Scenic landscapes, Nature escapes, Rugged terrain, Hiking paths |
| Monte Moro | An ideal area for adventure seekers, Monte Moro offers incredible skiing opportunities in winter and hiking in summer, attracting thrill-seekers year-round. | Skiing slopes, Hiking routes, Panoramic viewpoints, Mountain biking trails, Natural parks |
| Frazione Isella | A small yet charming area popular for its authentic atmosphere, appealing to tourists who wish to experience traditional mountain life. | Rustic environment, Local culture, Agricultural beauty, Flora and fauna, Walser traditions |
| Frazione Gatta | Gatta is an emerging spot for visitors looking for less touristy experiences. It offers a blend of nature, local life, and authenticity for Airbnb guests. | Local artisan shops, Countryside, Cultural experiences, Culinary delights, Seasonal fairs |
| Bocconcino | A serene location away from the hustle and bustle, Bocconcino is perfect for those wanting solitude and nature, attractive especially in the summer months. | Quiet nature, Private retreats, Scenic vistas, Bird watching, Hiking trails |
Understanding Airbnb License Requirements & STR Laws in Macugnaga (2025)
Yes, Macugnaga, Piedmont, Italy enforces high STR regulations. Obtaining a license and ensuring compliance is almost certainly required according to current 2025 STR laws. Always verify the latest short term rental regulations and Airbnb license requirements directly with local government authorities for Macugnaga to ensure full compliance before hosting.
(Source: AirROI data, 2025, based on 76% licensed listings)
Top Performing Airbnb Properties in Macugnaga (2025)
Benchmark your potential! Explore examples of top-performing Airbnb properties in Macugnagabased on Trailing Twelve Month (TTM) revenue. Analyze their characteristics, revenue, occupancy rate, and ADR to understand what drives success in this market.

Testa 9
Entire Place • 4 bedrooms

Casa Gianni
Entire Place • 3 bedrooms
Family apartment with garden
Entire Place • 2 bedrooms
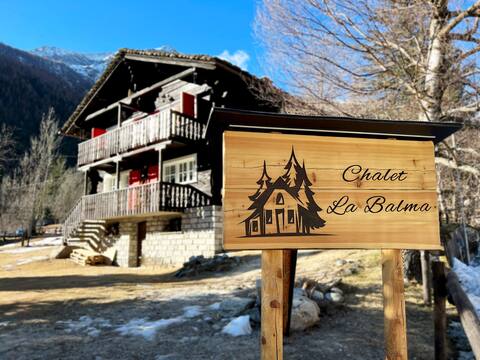
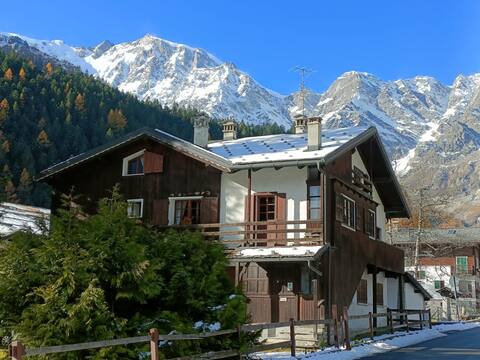
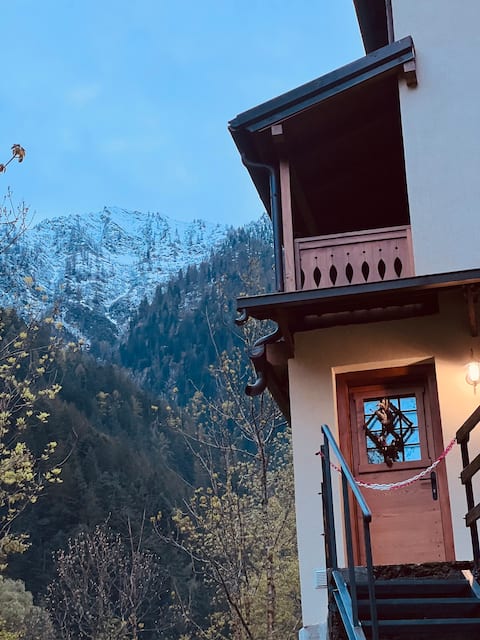
Chalet La Balma
Entire Place • 2 bedrooms
Dario's Chalet Macugnagamonterosa 2
Entire Place • 2 bedrooms

BETO'S HOUSE B&B - chalet rooms-
Private Room • 2 bedrooms
Note: Performance varies based on location, size, amenities, seasonality, and management quality. Data reflects the past 12 months.
Top Performing Airbnb Hosts in Macugnaga (2025)
Learn from the best! This table showcases top-performing Airbnb hosts in Macugnaga based on the number of properties managed and estimated total revenue over the past year. Analyze their scale and performance metrics.
| Host Name | Properties | Grossing Revenue | Stay Reviews | Avg Rating |
|---|---|---|---|---|
| Stefano | 7 | $81,440 | 30 | 4.83/5.0 |
| Dario | 2 | $34,201 | 53 | 4.64/5.0 |
| Monica | 1 | $28,181 | 14 | 5.00/5.0 |
| Mario | 1 | $23,749 | 18 | 4.39/5.0 |
| Marco | 1 | $22,313 | 6 | 5.00/5.0 |
| Beto | 1 | $19,379 | 229 | 4.96/5.0 |
| Daniela | 1 | $13,535 | 25 | 4.96/5.0 |
| Roberta Maura | 1 | $12,352 | 23 | 4.83/5.0 |
| Veronica | 1 | $10,205 | 5 | 5.00/5.0 |
| Maria Pia | 2 | $9,832 | 28 | 4.83/5.0 |
Analyzing the strategies of top hosts, such as their property selection, pricing, and guest communication, can offer valuable lessons for optimizing your own Airbnb operations in Macugnaga.
Dive Deeper: Advanced Macugnaga STR Market Data (2025)
Ready to unlock more insights? AirROI provides access to advanced metrics and comprehensive Airbnb data for Macugnaga. Explore detailed analytics beyond this report to refine your investment strategy, optimize pricing, and maximize your vacation rental profits.
Explore Advanced MetricsMacugnaga Short-Term Rental Market Composition (2025): Property & Room Types
Room Type Distribution
Property Type Distribution
Market Composition Insights for Macugnaga
- The Macugnaga Airbnb market composition is heavily skewed towards Entire Home/Apt listings, which make up 96% of the 25 active rentals. This indicates strong guest preference for privacy and space.
- Looking at the property type distribution in Macugnaga, Apartment/Condo properties are the most common (60%), reflecting the local real estate landscape.
Macugnaga Airbnb Room Capacity Analysis (2025): Bedroom Distribution
Distribution of Listings by Number of Bedrooms
Room Capacity Insights for Macugnaga
- The dominant room capacity in Macugnaga is 2 bedrooms listings, making up 36% of the market. This suggests a strong demand for properties suitable for couples or solo travelers.
- Together, 2 bedrooms and 1 bedroom properties represent 72.0% of the active Airbnb listings in Macugnaga, indicating a high concentration in these sizes.
- A significant 24.0% of listings offer 3+ bedrooms, catering to larger groups and families seeking more space in Macugnaga.
Macugnaga Vacation Rental Guest Capacity Trends (2025)
Distribution of Listings by Guest Capacity
Guest Capacity Insights for Macugnaga
- The most common guest capacity trend in Macugnaga vacation rentals is listings accommodating 6 guests (28%). This suggests the primary traveler segment is likely larger groups.
- Properties designed for 6 guests and 4 guests dominate the Macugnaga STR market, accounting for 52.0% of listings.
- 48.0% of properties accommodate 6+ guests, serving the market segment for larger families or group travel in Macugnaga.
- On average, properties in Macugnaga are equipped to host 5.2 guests.
Macugnaga Airbnb Booking Patterns (2025): Available vs. Booked Days
Available Days Distribution
Booked Days Distribution
Booking Pattern Insights for Macugnaga
- The most common availability pattern in Macugnaga falls within the 271-366 days range, representing 68% of listings. This suggests many properties have significant open periods on their calendars.
- Approximately 88.0% of listings show high availability (181+ days open annually), indicating potential for increased bookings or specific owner usage patterns.
- For booked days, the 31-90 days range is most frequent in Macugnaga (40%), reflecting common guest stay durations or potential owner blocking patterns.
- A notable 12.0% of properties secure long booking periods (181+ days booked per year), highlighting successful long-term rental strategies or significant owner usage.
Macugnaga Airbnb Minimum Stay Requirements Analysis
Distribution of Listings by Minimum Night Requirement
1 Night
5 listings
20.8% of total
2 Nights
9 listings
37.5% of total
3 Nights
2 listings
8.3% of total
4-6 Nights
4 listings
16.7% of total
7-29 Nights
2 listings
8.3% of total
30+ Nights
2 listings
8.3% of total
Key Insights
- The most prevalent minimum stay requirement in Macugnaga is 2 Nights, adopted by 37.5% of listings. This highlights the market's preference for shorter, flexible bookings.
Recommendations
- Align with the market by considering a 2 Nights minimum stay, as 37.5% of Macugnaga hosts use this setting.
- If feasible, allowing 1-night stays, especially midweek or during low season, could capture last-minute bookings, as only 20.8% currently do.
- Explore offering discounts for stays of 30+ nights to attract the 8.3% of the market seeking extended stays.
- Adjust minimum nights based on seasonality – potentially shorter during low season and longer during peak demand periods in Macugnaga.
Macugnaga Airbnb Cancellation Policy Trends Analysis (2025)
Super Strict 30 Days
1 listings
4.2% of total
Moderate
18 listings
75% of total
Strict
5 listings
20.8% of total
Cancellation Policy Insights for Macugnaga
- The prevailing Airbnb cancellation policy trend in Macugnaga is Moderate, used by 75% of listings.
- The market strongly favors guest-friendly terms, with 75.0% of listings offering Flexible or Moderate policies. This suggests guests in Macugnaga may expect booking flexibility.
Recommendations for Hosts
- Consider adopting a Moderate policy to align with the 75% market standard in Macugnaga.
- Regularly review your cancellation policy against competitors and market demand shifts in Macugnaga.
Macugnaga STR Booking Lead Time Analysis (2025)
Average Booking Lead Time by Month
Booking Lead Time Insights for Macugnaga
- The overall average booking lead time for vacation rentals in Macugnaga is 73 days.
- Guests book furthest in advance for stays during July (average 109 days), likely coinciding with peak travel demand or local events.
- The shortest booking windows occur for stays in April (average 17 days), indicating more last-minute travel plans during this time.
- Seasonally, Summer (88 days avg.) sees the longest lead times, while Spring (40 days avg.) has the shortest, reflecting typical travel planning cycles.
Recommendations for Hosts
- Use the overall average lead time (73 days) as a baseline for your pricing and availability strategy in Macugnaga.
- For July stays, consider implementing length-of-stay discounts or slightly higher rates for bookings made less than 109 days out to capitalize on advance planning.
- Target marketing efforts for the Summer season well in advance (at least 88 days) to capture early planners.
- Monitor your own booking lead times against these Macugnaga averages to identify opportunities for dynamic pricing adjustments.
Popular & Essential Airbnb Amenities in Macugnaga (2025)
Amenity Prevalence
Amenity Insights for Macugnaga
- Essential amenities in Macugnaga that guests expect include: Kitchen, Heating, Dishes and silverware. Lacking these (any) could significantly impact bookings.
- Popular amenities like Hangers, Refrigerator, TV are common but not universal. Offering these can provide a competitive edge.
- Warning: Wifi is not universally provided but is considered essential globally. Ensure reliable Wifi is offered.
Recommendations for Hosts
- Ensure your listing includes all essential amenities for Macugnaga: Kitchen, Heating, Dishes and silverware.
- Prioritize adding missing essentials: Kitchen, Heating, Dishes and silverware.
- Consider adding popular differentiators like Hangers or Refrigerator to increase appeal.
- Highlight unique or less common amenities you offer (e.g., hot tub, dedicated workspace, EV charger) in your listing description and photos.
- Regularly check competitor amenities in Macugnaga to stay competitive.
Macugnaga Airbnb Guest Demographics & Profile Analysis (2025)
Guest Profile Summary for Macugnaga
- The typical guest profile for Airbnb in Macugnaga consists of primarily domestic travelers (69%), often arriving from nearby Milan, typically belonging to the Post-2000s (Gen Z/Alpha) group (50%), primarily speaking English or Italian.
- Domestic travelers account for 69.0% of guests.
- Key international markets include Italy (69%) and Netherlands (7%).
- Top languages spoken are English (37.3%) followed by Italian (28.9%).
- A significant demographic segment is the Post-2000s (Gen Z/Alpha) group, representing 50% of guests.
Recommendations for Hosts
- Target domestic marketing efforts towards travelers from Milan and Varese.
- Tailor amenities and listing descriptions to appeal to the dominant Post-2000s (Gen Z/Alpha) demographic (e.g., highlight fast WiFi, smart home features, local guides).
- Highlight unique local experiences or amenities relevant to the primary guest profile.
- Consider seasonal promotions aligned with peak travel times for key origin markets.
Nearby Short-Term Rental Market Comparison
How does the Macugnaga Airbnb market stack up against its neighbors? Compare key performance metrics like average monthly revenue, ADR, and occupancy rates in surrounding areas to understand the broader regional STR landscape.
| Market | Active Properties | Monthly Revenue | Daily Rate | Avg. Occupancy |
|---|---|---|---|---|
| Lauterbrunnen | 525 | $7,079 | $546.45 | 54% |
| La Rivière-Enverse | 17 | $5,972 | $624.02 | 41% |
| Les Clefs | 30 | $5,741 | $323.11 | 44% |
| Matten bei Interlaken | 52 | $5,674 | $316.63 | 63% |
| Iseltwald | 14 | $5,491 | $331.95 | 58% |
| Habkern | 13 | $5,382 | $344.74 | 50% |
| Interlaken | 288 | $4,987 | $310.52 | 56% |
| Grindelwald | 489 | $4,921 | $345.40 | 57% |
| Zermatt | 734 | $4,604 | $463.00 | 46% |
| Oberhofen am Thunersee | 24 | $4,572 | $265.94 | 55% |