Cherasco Airbnb Market Analysis 2025: Short Term Rental Data & Vacation Rental Statistics in Piedmont, Italy
Is Airbnb profitable in Cherasco in 2025? Explore comprehensive Airbnb analytics for Cherasco, Piedmont, Italy to uncover income potential. This 2025 STR market report for Cherasco, based on AirROI data from April 2024 to March 2025, reveals key trends in the niche market of 38 active listings.
Whether you're considering an Airbnb investment in Cherasco, optimizing your existing vacation rental, or exploring rental arbitrage opportunities, understanding the Cherasco Airbnb data is crucial. Navigating the high regulation landscape is key to maximizing your short term rental income potential. Let's dive into the specifics.
Key Cherasco Airbnb Performance Metrics Overview
Monthly Airbnb Revenue Variations & Income Potential in Cherasco (2025)
Understanding the monthly revenue variations for Airbnb listings in Cherasco is key to maximizing your short term rental income potential. Seasonality significantly impacts earnings. Our analysis, based on data from the past 12 months, shows that the peak revenue month for STRs in Cherasco is typically April, while December often presents the lowest earnings, highlighting opportunities for strategic pricing adjustments during shoulder and low seasons. Explore the typical Airbnb income in Cherasco across different performance tiers:
- Best-in-class properties (Top 10%) achieve $4,656+ monthly, often utilizing dynamic pricing and superior guest experiences.
- Strong performing properties (Top 25%) earn $1,968 or more, indicating effective management and desirable locations/amenities.
- Typical properties (Median) generate around $989 per month, representing the average market performance.
- Entry-level properties (Bottom 25%) see earnings around $486, often with potential for optimization.
Average Monthly Airbnb Earnings Trend in Cherasco
Cherasco Airbnb Occupancy Rate Trends (2025)
Maximize your bookings by understanding the Cherasco STR occupancy trends. Seasonal demand shifts significantly influence how often properties are booked. Typically, Augustsees the highest demand (peak season occupancy), while January experiences the lowest (low season). Effective strategies, like adjusting minimum stays or offering promotions, can boost occupancy during slower periods. Here's how different property tiers perform in Cherasco:
- Best-in-class properties (Top 10%) achieve 55%+ occupancy, indicating high desirability and potentially optimized availability.
- Strong performing properties (Top 25%) maintain 39% or higher occupancy, suggesting good market fit and guest satisfaction.
- Typical properties (Median) have an occupancy rate around 26%.
- Entry-level properties (Bottom 25%) average 13% occupancy, potentially facing higher vacancy.
Average Monthly Occupancy Rate Trend in Cherasco
Average Daily Rate (ADR) Airbnb Trends in Cherasco (2025)
Effective short term rental pricing strategy in Cherasco involves understanding monthly ADR fluctuations. The Average Daily Rate (ADR) for Airbnb in Cherasco typically peaks in November and dips lowest during April. Leveraging Airbnb dynamic pricing tools or strategies based on this seasonality can significantly boost revenue. Here's a look at the typical nightly rates achieved:
- Best-in-class properties (Top 10%) command rates of $299+ per night, often due to premium features or locations.
- Strong performing properties (Top 25%) achieve nightly rates of $155 or more.
- Typical properties (Median) charge around $94 per night.
- Entry-level properties (Bottom 25%) earn around $76 per night.
Average Daily Rate (ADR) Trend by Month in Cherasco
Get Live Cherasco Market Intelligence 👇

Explore Real-time Analytics
Airbnb Seasonality Analysis & Trends in Cherasco (2025)
Peak Season (April, August, July)
- Revenue averages $3,024 per month
- Occupancy rates average 34.9%
- Daily rates average $164
Shoulder Season
- Revenue averages $2,123 per month
- Occupancy maintains around 29.1%
- Daily rates hold near $177
Low Season (January, November, December)
- Revenue drops to average $1,596 per month
- Occupancy decreases to average 22.8%
- Daily rates adjust to average $205
Seasonality Insights for Cherasco
- The Airbnb seasonality in Cherasco shows highly seasonal trends requiring careful strategy. While the sections above show seasonal averages, it's also insightful to look at the extremes:
- During the high season, the absolute peak month showcases Cherasco's highest earning potential, with monthly revenues capable of climbing to $3,305, occupancy reaching a high of 45.0%, and ADRs peaking at $222.
- Conversely, the slowest single month of the year, typically falling within the low season, marks the market's lowest point. In this month, revenue might dip to $1,299, occupancy could drop to 19.7%, and ADRs may adjust down to $161.
- Understanding both the seasonal averages and these monthly peaks and troughs in revenue, occupancy, and ADR is crucial for maximizing your Airbnb profit potential in Cherasco.
Seasonal Strategies for Maximizing Profit
- Peak Season: Maximize revenue through premium pricing and potentially longer minimum stays. Ensure high availability.
- Low Season: Offer competitive pricing, special promotions (e.g., extended stay discounts), and flexible cancellation policies. Target off-season travelers like remote workers or budget-conscious guests.
- Shoulder Seasons: Implement dynamic pricing that balances peak and low rates. Target weekend travelers or specific events. Offer slightly more flexible terms than peak season.
- Regularly analyze your own performance against these Cherasco seasonality benchmarks and adjust your pricing and availability strategy accordingly.
Best Areas for Airbnb Investment in Cherasco (2025)
Exploring the top neighborhoods for short-term rentals in Cherasco? This section highlights key areas, outlining why they are attractive for hosts and guests, along with notable local attractions. Consider these locations based on your target guest profile and investment strategy.
| Neighborhood / Area | Why Host Here? (Target Guests & Appeal) | Key Attractions & Landmarks |
|---|---|---|
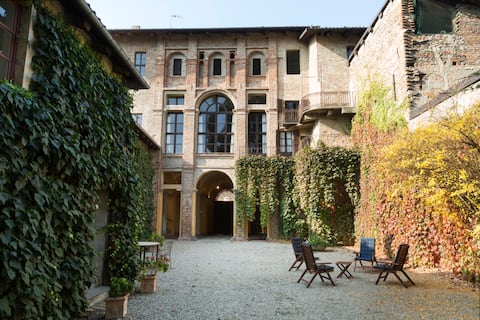
| Centro Storico | The historic center of Cherasco, known for its charming medieval architecture and lively atmosphere. Ideal for tourists who want to experience the town's rich history and culture. | Piazza degli Aranci, Church of San Pietro, Museo della Magia, Castello di Cherasco, Porta Torino |
| Langhe Wine Region | Cherasco is close to the famous Langhe wine region, which attracts wine lovers and tourists looking to explore vineyards and enjoy wine tastings. | Barolo, Barbaresco, Vineyard tours, Wine tastings, Local enogastronomy |
| Borgo Vecchio | A picturesque old village area with narrow streets and traditional restaurants. Popular for those wanting an authentic Italian experience away from the busy tourist paths. | Local trattorias, Boutique shops, Cultural events, Artisan workshops, Scenic views |
| Parco della Rimembranza | A beautiful park in Cherasco that offers a peaceful retreat and scenic walking paths. Great for families and outdoor enthusiasts. | Walking trails, Picnic areas, Children's play areas, Natural scenery, Seasonal events |
| Cherasco's Food Scene | Known for its gastronomy, especially the famous Cherasco snails and local truffles, it draws food lovers and culinary tourism. | Snail festivals, Local markets, Gourmet restaurants, Cooking classes, Truffle hunting |
| Nearby Monforte d'Alba | A short distance from Cherasco and famous for its wine production and beautiful landscapes, attracting visitors for wine tourism. | Wine estates, Historic landmarks, Local festivals, Scenic hikes, Exquisite dining |
| Cherasco Antiques Market | A well-known monthly antiques market that attracts collectors and enthusiasts, making it a unique destination for visitors. | Antique shops, Collectibles, Local crafts, Bargain hunting, Cultural exchange |
| Cultural Events in Cherasco | Throughout the year, Cherasco hosts various cultural and historical events which attract many visitors. A lively area during festival times. | Historical reenactments, Art exhibitions, Music festivals, Food fairs, Local traditions |
Understanding Airbnb License Requirements & STR Laws in Cherasco (2025)
Yes, Cherasco, Piedmont, Italy enforces high STR regulations. Obtaining a license and ensuring compliance is almost certainly required according to current 2025 STR laws. Always verify the latest short term rental regulations and Airbnb license requirements directly with local government authorities for Cherasco to ensure full compliance before hosting.
(Source: AirROI data, 2025, based on 68% licensed listings)
Top Performing Airbnb Properties in Cherasco (2025)
Benchmark your potential! Explore examples of top-performing Airbnb properties in Cherascobased on Trailing Twelve Month (TTM) revenue. Analyze their characteristics, revenue, occupancy rate, and ADR to understand what drives success in this market.
CASA VACANZA DI LUSSO
Entire Place • 4 bedrooms
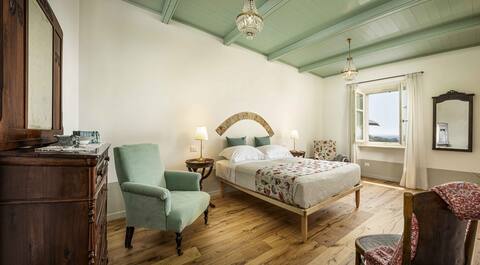
Casa Elmo
Entire Place • 5 bedrooms
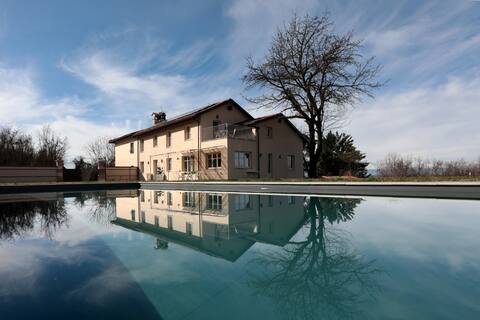
Three-room apartment1 in ancient country villa with vineyards
Entire Place • 2 bedrooms
Best Quality®Cherasco Centro E-Bike-Beauty-Member
Entire Place • 1 bedroom

Scenic penthouse in Cherasco
Entire Place • 2 bedrooms
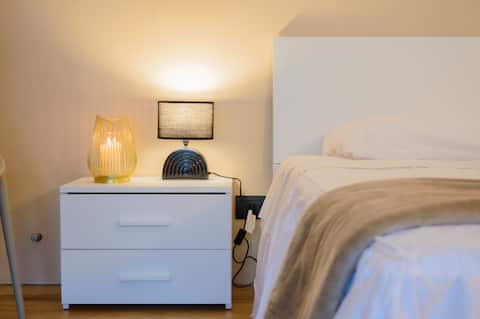
Suite via Roma - apartment la Palma + parking
Entire Place • 1 bedroom
Note: Performance varies based on location, size, amenities, seasonality, and management quality. Data reflects the past 12 months.
Top Performing Airbnb Hosts in Cherasco (2025)
Learn from the best! This table showcases top-performing Airbnb hosts in Cherasco based on the number of properties managed and estimated total revenue over the past year. Analyze their scale and performance metrics.
| Host Name | Properties | Grossing Revenue | Stay Reviews | Avg Rating |
|---|---|---|---|---|
| Host #451789396 | 1 | $159,492 | 0 | 0.00/5.0 |
| Riccardo | 1 | $102,384 | 14 | 4.86/5.0 |
| Edgar | 7 | $99,642 | 53 | 4.88/5.0 |
| Piero | 5 | $44,360 | 913 | 4.87/5.0 |
| Francesca | 2 | $28,703 | 12 | 5.00/5.0 |
| Host #478786288 | 1 | $26,176 | 6 | 4.67/5.0 |
| Giovanni | 1 | $24,810 | 7 | 5.00/5.0 |
| Daniele | 2 | $21,879 | 24 | 5.00/5.0 |
| Erica | 1 | $15,320 | 5 | 4.40/5.0 |
| Laura | 1 | $14,199 | 45 | 4.73/5.0 |
Analyzing the strategies of top hosts, such as their property selection, pricing, and guest communication, can offer valuable lessons for optimizing your own Airbnb operations in Cherasco.
Dive Deeper: Advanced Cherasco STR Market Data (2025)
Ready to unlock more insights? AirROI provides access to advanced metrics and comprehensive Airbnb data for Cherasco. Explore detailed analytics beyond this report to refine your investment strategy, optimize pricing, and maximize your vacation rental profits.
Explore Advanced MetricsCherasco Short-Term Rental Market Composition (2025): Property & Room Types
Room Type Distribution
Property Type Distribution
Market Composition Insights for Cherasco
- The Cherasco Airbnb market composition is heavily skewed towards Entire Home/Apt listings, which make up 92.1% of the 38 active rentals. This indicates strong guest preference for privacy and space.
- Looking at the property type distribution in Cherasco, Apartment/Condo properties are the most common (50%), reflecting the local real estate landscape.
- Houses represent a significant 42.1% portion, catering likely to families or larger groups.
- The presence of 5.3% Hotel/Boutique listings indicates integration with traditional hospitality.
- Smaller segments like others (combined 2.6%) offer potential for unique stay experiences.
Cherasco Airbnb Room Capacity Analysis (2025): Bedroom Distribution
Distribution of Listings by Number of Bedrooms
Room Capacity Insights for Cherasco
- The dominant room capacity in Cherasco is 1 bedroom listings, making up 68.4% of the market. This suggests a strong demand for properties suitable for couples or solo travelers.
- Together, 1 bedroom and 2 bedrooms properties represent 89.5% of the active Airbnb listings in Cherasco, indicating a high concentration in these sizes.
- With over half the market (68.4%) consisting of studios or 1-bedroom units, Cherasco is particularly well-suited for individuals or couples.
- Listings with 3+ bedrooms (5.2%) represent a smaller niche, potentially indicating an underserved market for larger group accommodations in Cherasco.
Cherasco Vacation Rental Guest Capacity Trends (2025)
Distribution of Listings by Guest Capacity
Guest Capacity Insights for Cherasco
- The most common guest capacity trend in Cherasco vacation rentals is listings accommodating 2 guests (39.5%). This suggests the primary traveler segment is likely couples or solo travelers.
- Properties designed for 2 guests and 4 guests dominate the Cherasco STR market, accounting for 79.0% of listings.
- 13.2% of properties accommodate 6+ guests, serving the market segment for larger families or group travel in Cherasco.
- On average, properties in Cherasco are equipped to host 3.3 guests.
Cherasco Airbnb Booking Patterns (2025): Available vs. Booked Days
Available Days Distribution
Booked Days Distribution
Booking Pattern Insights for Cherasco
- The most common availability pattern in Cherasco falls within the 271-366 days range, representing 73.7% of listings. This suggests many properties have significant open periods on their calendars.
- Approximately 92.1% of listings show high availability (181+ days open annually), indicating potential for increased bookings or specific owner usage patterns.
- For booked days, the 31-90 days range is most frequent in Cherasco (52.6%), reflecting common guest stay durations or potential owner blocking patterns.
- A notable 10.5% of properties secure long booking periods (181+ days booked per year), highlighting successful long-term rental strategies or significant owner usage.
Cherasco Airbnb Minimum Stay Requirements Analysis
Distribution of Listings by Minimum Night Requirement
1 Night
9 listings
24.3% of total
2 Nights
15 listings
40.5% of total
3 Nights
5 listings
13.5% of total
7-29 Nights
4 listings
10.8% of total
30+ Nights
4 listings
10.8% of total
Key Insights
- The most prevalent minimum stay requirement in Cherasco is 2 Nights, adopted by 40.5% of listings. This highlights the market's preference for shorter, flexible bookings.
- A strong majority (64.8%) of the Cherasco Airbnb data shows acceptance of very short stays (1-2 nights), indicating a dynamic, high-turnover market.
- A significant segment (10.8%) caters to monthly stays (30+ nights) in Cherasco, pointing to opportunities in the extended-stay market.
Recommendations
- Align with the market by considering a 2 Nights minimum stay, as 40.5% of Cherasco hosts use this setting.
- If feasible, allowing 1-night stays, especially midweek or during low season, could capture last-minute bookings, as only 24.3% currently do.
- Explore offering discounts for stays of 30+ nights to attract the 10.8% of the market seeking extended stays.
- Adjust minimum nights based on seasonality – potentially shorter during low season and longer during peak demand periods in Cherasco.
Cherasco Airbnb Cancellation Policy Trends Analysis (2025)
Super Strict 30 Days
1 listings
3.1% of total
Flexible
13 listings
40.6% of total
Moderate
14 listings
43.8% of total
Strict
4 listings
12.5% of total
Cancellation Policy Insights for Cherasco
- The prevailing Airbnb cancellation policy trend in Cherasco is Moderate, used by 43.8% of listings.
- The market strongly favors guest-friendly terms, with 84.4% of listings offering Flexible or Moderate policies. This suggests guests in Cherasco may expect booking flexibility.
Recommendations for Hosts
- Consider adopting a Moderate policy to align with the 43.8% market standard in Cherasco.
- Using a Strict policy might deter some guests, as only 12.5% of listings use it. Evaluate if potential revenue protection outweighs possible lower booking rates.
- Regularly review your cancellation policy against competitors and market demand shifts in Cherasco.
Cherasco STR Booking Lead Time Analysis (2025)
Average Booking Lead Time by Month
Booking Lead Time Insights for Cherasco
- The overall average booking lead time for vacation rentals in Cherasco is 39 days.
- Guests book furthest in advance for stays during July (average 95 days), likely coinciding with peak travel demand or local events.
- The shortest booking windows occur for stays in November (average 22 days), indicating more last-minute travel plans during this time.
- Seasonally, Summer (73 days avg.) sees the longest lead times, while Fall (34 days avg.) has the shortest, reflecting typical travel planning cycles.
Recommendations for Hosts
- Use the overall average lead time (39 days) as a baseline for your pricing and availability strategy in Cherasco.
- For July stays, consider implementing length-of-stay discounts or slightly higher rates for bookings made less than 95 days out to capitalize on advance planning.
- Target marketing efforts for the Summer season well in advance (at least 73 days) to capture early planners.
- Monitor your own booking lead times against these Cherasco averages to identify opportunities for dynamic pricing adjustments.
Popular & Essential Airbnb Amenities in Cherasco (2025)
Amenity Prevalence
Amenity Insights for Cherasco
- Essential amenities in Cherasco that guests expect include: Heating. Lacking these (this) could significantly impact bookings.
- Popular amenities like Essentials, Wifi, Hot water are common but not universal. Offering these can provide a competitive edge.
- Warning: Wifi is not universally provided but is considered essential globally. Ensure reliable Wifi is offered.
Recommendations for Hosts
- Ensure your listing includes all essential amenities for Cherasco: Heating.
- Consider adding popular differentiators like Essentials or Wifi to increase appeal.
- Highlight unique or less common amenities you offer (e.g., hot tub, dedicated workspace, EV charger) in your listing description and photos.
- Regularly check competitor amenities in Cherasco to stay competitive.
Cherasco Airbnb Guest Demographics & Profile Analysis (2025)
Guest Profile Summary for Cherasco
- The typical guest profile for Airbnb in Cherasco consists of a mix of domestic (47%) and international guests, with top international origins including Germany, typically belonging to the Post-2000s (Gen Z/Alpha) group (50%), primarily speaking English or Italian.
- Domestic travelers account for 46.5% of guests.
- Key international markets include Italy (46.5%) and Germany (10.3%).
- Top languages spoken are English (34.2%) followed by Italian (19.8%).
- A significant demographic segment is the Post-2000s (Gen Z/Alpha) group, representing 50% of guests.
Recommendations for Hosts
- Balance marketing efforts between domestic and international channels based on the guest mix.
- Tailor amenities and listing descriptions to appeal to the dominant Post-2000s (Gen Z/Alpha) demographic (e.g., highlight fast WiFi, smart home features, local guides).
- Highlight unique local experiences or amenities relevant to the primary guest profile.
- Consider seasonal promotions aligned with peak travel times for key origin markets.
Nearby Short-Term Rental Market Comparison
How does the Cherasco Airbnb market stack up against its neighbors? Compare key performance metrics like average monthly revenue, ADR, and occupancy rates in surrounding areas to understand the broader regional STR landscape.
| Market | Active Properties | Monthly Revenue | Daily Rate | Avg. Occupancy |
|---|---|---|---|---|
| Les Clefs | 30 | $5,741 | $323.11 | 44% |
| Monteu Roero | 16 | $4,432 | $540.14 | 36% |
| Manigod | 194 | $4,127 | $427.80 | 40% |
| Ramatuelle | 213 | $3,891 | $670.10 | 41% |
| Saint-Jean-Cap-Ferrat | 107 | $3,844 | $424.21 | 46% |
| Cossano Belbo | 13 | $3,632 | $284.21 | 42% |
| Saint-Tropez | 742 | $3,498 | $506.57 | 41% |
| Saint-Nicolas-la-Chapelle | 27 | $3,381 | $375.70 | 43% |
| Cassinasco | 18 | $3,219 | $545.40 | 41% |
| Charvonnex | 11 | $3,212 | $228.03 | 56% |