Cassinasco Airbnb Market Analysis 2025: Short Term Rental Data & Vacation Rental Statistics in Piedmont, Italy
Is Airbnb profitable in Cassinasco in 2025? Explore comprehensive Airbnb analytics for Cassinasco, Piedmont, Italy to uncover income potential. This 2025 STR market report for Cassinasco, based on AirROI data from April 2024 to March 2025, reveals key trends in the niche market of 18 active listings.
Whether you're considering an Airbnb investment in Cassinasco, optimizing your existing vacation rental, or exploring rental arbitrage opportunities, understanding the Cassinasco Airbnb data is crucial. Navigating the high regulation landscape is key to maximizing your short term rental income potential. Let's dive into the specifics.
Key Cassinasco Airbnb Performance Metrics Overview
Monthly Airbnb Revenue Variations & Income Potential in Cassinasco (2025)
Understanding the monthly revenue variations for Airbnb listings in Cassinasco is key to maximizing your short term rental income potential. Seasonality significantly impacts earnings. Our analysis, based on data from the past 12 months, shows that the peak revenue month for STRs in Cassinasco is typically May, while February often presents the lowest earnings, highlighting opportunities for strategic pricing adjustments during shoulder and low seasons. Explore the typical Airbnb income in Cassinasco across different performance tiers:
- Best-in-class properties (Top 10%) achieve $6,523+ monthly, often utilizing dynamic pricing and superior guest experiences.
- Strong performing properties (Top 25%) earn $5,431 or more, indicating effective management and desirable locations/amenities.
- Typical properties (Median) generate around $3,959 per month, representing the average market performance.
- Entry-level properties (Bottom 25%) see earnings around $2,353, often with potential for optimization.
Average Monthly Airbnb Earnings Trend in Cassinasco
Cassinasco Airbnb Occupancy Rate Trends (2025)
Maximize your bookings by understanding the Cassinasco STR occupancy trends. Seasonal demand shifts significantly influence how often properties are booked. Typically, Augustsees the highest demand (peak season occupancy), while January experiences the lowest (low season). Effective strategies, like adjusting minimum stays or offering promotions, can boost occupancy during slower periods. Here's how different property tiers perform in Cassinasco:
- Best-in-class properties (Top 10%) achieve 49%+ occupancy, indicating high desirability and potentially optimized availability.
- Strong performing properties (Top 25%) maintain 42% or higher occupancy, suggesting good market fit and guest satisfaction.
- Typical properties (Median) have an occupancy rate around 31%.
- Entry-level properties (Bottom 25%) average 23% occupancy, potentially facing higher vacancy.
Average Monthly Occupancy Rate Trend in Cassinasco
Average Daily Rate (ADR) Airbnb Trends in Cassinasco (2025)
Effective short term rental pricing strategy in Cassinasco involves understanding monthly ADR fluctuations. The Average Daily Rate (ADR) for Airbnb in Cassinasco typically peaks in December and dips lowest during September. Leveraging Airbnb dynamic pricing tools or strategies based on this seasonality can significantly boost revenue. Here's a look at the typical nightly rates achieved:
- Best-in-class properties (Top 10%) command rates of $694+ per night, often due to premium features or locations.
- Strong performing properties (Top 25%) achieve nightly rates of $620 or more.
- Typical properties (Median) charge around $594 per night.
- Entry-level properties (Bottom 25%) earn around $408 per night.
Average Daily Rate (ADR) Trend by Month in Cassinasco
Get Live Cassinasco Market Intelligence 👇

Explore Real-time Analytics
Airbnb Seasonality Analysis & Trends in Cassinasco (2025)
Peak Season (May, April, August)
- Revenue averages $6,527 per month
- Occupancy rates average 44.4%
- Daily rates average $269
Shoulder Season
- Revenue averages $4,232 per month
- Occupancy maintains around 36.6%
- Daily rates hold near $462
Low Season (January, February, December)
- Revenue drops to average $1,498 per month
- Occupancy decreases to average 12.5%
- Daily rates adjust to average $909
Seasonality Insights for Cassinasco
- The Airbnb seasonality in Cassinasco shows highly seasonal trends requiring careful strategy. While the sections above show seasonal averages, it's also insightful to look at the extremes:
- During the high season, the absolute peak month showcases Cassinasco's highest earning potential, with monthly revenues capable of climbing to $6,680, occupancy reaching a high of 73.6%, and ADRs peaking at $975.
- Conversely, the slowest single month of the year, typically falling within the low season, marks the market's lowest point. In this month, revenue might dip to $1,191, occupancy could drop to 7.1%, and ADRs may adjust down to $242.
- Understanding both the seasonal averages and these monthly peaks and troughs in revenue, occupancy, and ADR is crucial for maximizing your Airbnb profit potential in Cassinasco.
Seasonal Strategies for Maximizing Profit
- Peak Season: Maximize revenue through premium pricing and potentially longer minimum stays. Ensure high availability.
- Low Season: Offer competitive pricing, special promotions (e.g., extended stay discounts), and flexible cancellation policies. Target off-season travelers like remote workers or budget-conscious guests.
- Shoulder Seasons: Implement dynamic pricing that balances peak and low rates. Target weekend travelers or specific events. Offer slightly more flexible terms than peak season.
- Regularly analyze your own performance against these Cassinasco seasonality benchmarks and adjust your pricing and availability strategy accordingly.
Best Areas for Airbnb Investment in Cassinasco (2025)
Exploring the top neighborhoods for short-term rentals in Cassinasco? This section highlights key areas, outlining why they are attractive for hosts and guests, along with notable local attractions. Consider these locations based on your target guest profile and investment strategy.
| Neighborhood / Area | Why Host Here? (Target Guests & Appeal) | Key Attractions & Landmarks |
|---|---|---|
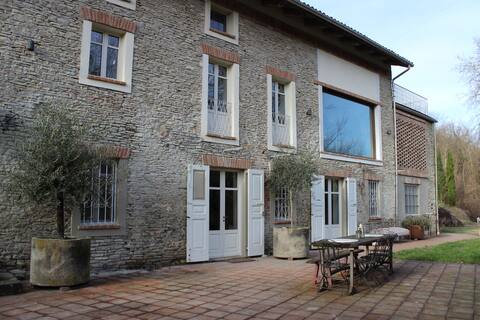
| Cassinasco Village | A charming village known for its picturesque landscapes and wine production. Attracts tourists looking for a peaceful retreat in the heart of Piedmont's wine country. | Wine cellars, San Giovanni Battista Church, Vineyard tours, Local festivals, Nature trails |
| Nearby Asti | The historical city of Asti is famous for its medieval architecture and wine, making it a popular destination for tourists who want to explore the culture and history of the region. | Asti Cathedral, Palio di Asti, Piazza Alfieri, Vineyard tours, Local cuisine |
| Monferrato Region | A UNESCO World Heritage site known for its rolling hills and vineyards. Perfect for wine lovers and those seeking outdoor activities. | Vineyard trails, Historic castles, Wine tastings, Local agriturismos, Cycling routes |
| Barolo | Famous wine region known for its Barolo wines. A popular destination for wine enthusiasts, offering stunning views and gourmet food. | Barolo Castle, Wine cellars, Local restaurants, Vineyards, Wine events |
| Alba | Known as the 'Capital of the Langhe' and famous for its white truffles and fine wines. Attracts foodies and wine lovers year-round. | Alba Cathedral, Truffle fairs, Wine tastings, Piazza Risorgimento, Local markets |
| Neive | A picturesque medieval village offering a unique experience with its historic architecture and beautiful countryside, great for weekend getaways. | Historic wineries, Neive Castle, Scenic views, Local restaurants, Cultural festivals |
| Trezzo Tinella | A small village surrounded by vineyards, ideal for those seeking peace and tranquility in a rural setting while offering wine experiences. | Nature walks, Winery tours, Local agriturismos, Cultural events, Wine festivals |
| Canelli | Famous for its sparkling wine, this town offers rich history and beautiful landscape, making it a favorite among wine tourists. | Grotto of Canelli, Wine cellars, Vineyard tours, Historic buildings, Local cuisine |
Understanding Airbnb License Requirements & STR Laws in Cassinasco (2025)
Yes, Cassinasco, Piedmont, Italy enforces high STR regulations. Obtaining a license and ensuring compliance is almost certainly required according to current 2025 STR laws. Always verify the latest short term rental regulations and Airbnb license requirements directly with local government authorities for Cassinasco to ensure full compliance before hosting.
(Source: AirROI data, 2025, based on 78% licensed listings)
Top Performing Airbnb Properties in Cassinasco (2025)
Benchmark your potential! Explore examples of top-performing Airbnb properties in Cassinascobased on Trailing Twelve Month (TTM) revenue. Analyze their characteristics, revenue, occupancy rate, and ADR to understand what drives success in this market.
CASCINA ALBA LANGHE
Entire Place • 6 bedrooms

Gorgeous & Spacious 2BR Overlooking Langhe Hills
Entire Place • 2 bedrooms
Sunny & Romantic 2BR Overlooking Langhe Hills
Entire Place • 2 bedrooms
Delightful & Charming 1BR in Le Langhe
Entire Place • 1 bedroom

Romantic & Comfy Studio Overlooking Langhe Hills
Entire Place • 1 bedroom

Beautiful villa with pool and amazing view
Entire Place • 4 bedrooms
Note: Performance varies based on location, size, amenities, seasonality, and management quality. Data reflects the past 12 months.
Top Performing Airbnb Hosts in Cassinasco (2025)
Learn from the best! This table showcases top-performing Airbnb hosts in Cassinasco based on the number of properties managed and estimated total revenue over the past year. Analyze their scale and performance metrics.
| Host Name | Properties | Grossing Revenue | Stay Reviews | Avg Rating |
|---|---|---|---|---|
| Federico | 13 | $504,062 | 202 | 4.15/5.0 |
| Gabriella | 2 | $135,702 | 106 | 4.98/5.0 |
| Gerd | 1 | $46,577 | 6 | 5.00/5.0 |
| Gianni | 2 | $8,871 | 35 | 4.99/5.0 |
Analyzing the strategies of top hosts, such as their property selection, pricing, and guest communication, can offer valuable lessons for optimizing your own Airbnb operations in Cassinasco.
Dive Deeper: Advanced Cassinasco STR Market Data (2025)
Ready to unlock more insights? AirROI provides access to advanced metrics and comprehensive Airbnb data for Cassinasco. Explore detailed analytics beyond this report to refine your investment strategy, optimize pricing, and maximize your vacation rental profits.
Explore Advanced MetricsCassinasco Short-Term Rental Market Composition (2025): Property & Room Types
Room Type Distribution
Property Type Distribution
Market Composition Insights for Cassinasco
- The Cassinasco Airbnb market composition is heavily skewed towards Entire Home/Apt listings, which make up 100% of the 18 active rentals. This indicates strong guest preference for privacy and space.
- Looking at the property type distribution in Cassinasco, Apartment/Condo properties are the most common (77.8%), reflecting the local real estate landscape.
- Houses represent a significant 22.2% portion, catering likely to families or larger groups.
Cassinasco Airbnb Room Capacity Analysis (2025): Bedroom Distribution
Distribution of Listings by Number of Bedrooms
Room Capacity Insights for Cassinasco
- The dominant room capacity in Cassinasco is 1 bedroom listings, making up 72.2% of the market. This suggests a strong demand for properties suitable for couples or solo travelers.
- Together, 1 bedroom and 5+ bedrooms properties represent 83.3% of the active Airbnb listings in Cassinasco, indicating a high concentration in these sizes.
- With over half the market (72.2%) consisting of studios or 1-bedroom units, Cassinasco is particularly well-suited for individuals or couples.
Cassinasco Vacation Rental Guest Capacity Trends (2025)
Distribution of Listings by Guest Capacity
Guest Capacity Insights for Cassinasco
- The most common guest capacity trend in Cassinasco vacation rentals is listings accommodating 2 guests (55.6%). This suggests the primary traveler segment is likely couples or solo travelers.
- Properties designed for 2 guests and 4 guests dominate the Cassinasco STR market, accounting for 77.8% of listings.
- A significant 55.6% of listings cater specifically to 1-2 guests, highlighting strong demand from couples and solo travelers in Cassinasco.
- 16.7% of properties accommodate 6+ guests, serving the market segment for larger families or group travel in Cassinasco.
- On average, properties in Cassinasco are equipped to host 3.5 guests.
Cassinasco Airbnb Booking Patterns (2025): Available vs. Booked Days
Available Days Distribution
Booked Days Distribution
Booking Pattern Insights for Cassinasco
- The most common availability pattern in Cassinasco falls within the 181-270 days range, representing 66.7% of listings. This suggests many properties have significant open periods on their calendars.
- Approximately 94.5% of listings show high availability (181+ days open annually), indicating potential for increased bookings or specific owner usage patterns.
- For booked days, the 91-180 days range is most frequent in Cassinasco (61.1%), reflecting common guest stay durations or potential owner blocking patterns.
- A notable 11.1% of properties secure long booking periods (181+ days booked per year), highlighting successful long-term rental strategies or significant owner usage.
Cassinasco Airbnb Minimum Stay Requirements Analysis
Distribution of Listings by Minimum Night Requirement
2 Nights
3 listings
16.7% of total
3 Nights
13 listings
72.2% of total
4-6 Nights
1 listings
5.6% of total
30+ Nights
1 listings
5.6% of total
Key Insights
- The most prevalent minimum stay requirement in Cassinasco is 3 Nights, adopted by 72.2% of listings. This highlights the market's preference for longer commitments.
- Very short stays (1-2 nights) are less common (16.7%), suggesting hosts prefer slightly longer bookings to optimize turnover.
Recommendations
- Align with the market by considering a 3 Nights minimum stay, as 72.2% of Cassinasco hosts use this setting.
- Explore offering discounts for stays of 30+ nights to attract the 5.6% of the market seeking extended stays.
- Adjust minimum nights based on seasonality – potentially shorter during low season and longer during peak demand periods in Cassinasco.
Cassinasco Airbnb Cancellation Policy Trends Analysis (2025)
Flexible
2 listings
12.5% of total
Moderate
12 listings
75% of total
Strict
2 listings
12.5% of total
Cancellation Policy Insights for Cassinasco
- The prevailing Airbnb cancellation policy trend in Cassinasco is Moderate, used by 75% of listings.
- The market strongly favors guest-friendly terms, with 87.5% of listings offering Flexible or Moderate policies. This suggests guests in Cassinasco may expect booking flexibility.
Recommendations for Hosts
- Consider adopting a Moderate policy to align with the 75% market standard in Cassinasco.
- Using a Strict policy might deter some guests, as only 12.5% of listings use it. Evaluate if potential revenue protection outweighs possible lower booking rates.
- Regularly review your cancellation policy against competitors and market demand shifts in Cassinasco.
Cassinasco STR Booking Lead Time Analysis (2025)
Average Booking Lead Time by Month
Booking Lead Time Insights for Cassinasco
- The overall average booking lead time for vacation rentals in Cassinasco is 38 days.
- Guests book furthest in advance for stays during July (average 179 days), likely coinciding with peak travel demand or local events.
- The shortest booking windows occur for stays in December (average 8 days), indicating more last-minute travel plans during this time.
- Seasonally, Summer (117 days avg.) sees the longest lead times, while Winter (22 days avg.) has the shortest, reflecting typical travel planning cycles.
Recommendations for Hosts
- Use the overall average lead time (38 days) as a baseline for your pricing and availability strategy in Cassinasco.
- For July stays, consider implementing length-of-stay discounts or slightly higher rates for bookings made less than 179 days out to capitalize on advance planning.
- During December, focus on last-minute booking availability and promotions, as guests book with very short notice (8 days avg.).
- Target marketing efforts for the Summer season well in advance (at least 117 days) to capture early planners.
- Monitor your own booking lead times against these Cassinasco averages to identify opportunities for dynamic pricing adjustments.
Popular & Essential Airbnb Amenities in Cassinasco (2025)
Amenity Prevalence
Amenity Insights for Cassinasco
- Essential amenities in Cassinasco that guests expect include: Hair dryer, Hangers, Wifi, Backyard, Essentials, Washer, Free parking on premises. Lacking these (any) could significantly impact bookings.
- Popular amenities like Hot water, Heating, Iron are common but not universal. Offering these can provide a competitive edge.
Recommendations for Hosts
- Ensure your listing includes all essential amenities for Cassinasco: Hair dryer, Hangers, Wifi, Backyard, Essentials, Washer, Free parking on premises.
- Consider adding popular differentiators like Hot water or Heating to increase appeal.
- Highlight unique or less common amenities you offer (e.g., hot tub, dedicated workspace, EV charger) in your listing description and photos.
- Regularly check competitor amenities in Cassinasco to stay competitive.
Cassinasco Airbnb Guest Demographics & Profile Analysis (2025)
Guest Profile Summary for Cassinasco
- The typical guest profile for Airbnb in Cassinasco consists of predominantly international visitors (86%), with top international origins including Netherlands, typically belonging to the Post-2000s (Gen Z/Alpha) group (50%), primarily speaking English or German.
- Domestic travelers account for 14.0% of guests.
- Key international markets include Switzerland (18.4%) and Netherlands (14.7%).
- Top languages spoken are English (34.9%) followed by German (17.8%).
- A significant demographic segment is the Post-2000s (Gen Z/Alpha) group, representing 50% of guests.
Recommendations for Hosts
- Focus marketing internationally, particularly towards travelers from Netherlands.
- Tailor amenities and listing descriptions to appeal to the dominant Post-2000s (Gen Z/Alpha) demographic (e.g., highlight fast WiFi, smart home features, local guides).
- Highlight unique local experiences or amenities relevant to the primary guest profile.
- Consider seasonal promotions aligned with peak travel times for key origin markets.
Nearby Short-Term Rental Market Comparison
How does the Cassinasco Airbnb market stack up against its neighbors? Compare key performance metrics like average monthly revenue, ADR, and occupancy rates in surrounding areas to understand the broader regional STR landscape.
| Market | Active Properties | Monthly Revenue | Daily Rate | Avg. Occupancy |
|---|---|---|---|---|
| Laglio | 64 | $4,873 | $463.61 | 47% |
| Monteu Roero | 16 | $4,432 | $540.14 | 36% |
| Portofino | 68 | $4,086 | $454.35 | 44% |
| Saint-Jean-Cap-Ferrat | 107 | $3,844 | $424.21 | 46% |
| Sala Comacina | 64 | $3,794 | $400.27 | 50% |
| Cossano Belbo | 13 | $3,632 | $284.21 | 42% |
| Bellagio | 373 | $3,630 | $328.26 | 55% |
| Oliveto Lario | 99 | $3,509 | $327.42 | 55% |
| Carate Urio | 71 | $3,379 | $331.90 | 44% |
| Brienno | 39 | $3,327 | $337.92 | 45% |