Bra Airbnb Market Analysis 2025: Short Term Rental Data & Vacation Rental Statistics in Piedmont, Italy
Is Airbnb profitable in Bra in 2025? Explore comprehensive Airbnb analytics for Bra, Piedmont, Italy to uncover income potential. This 2025 STR market report for Bra, based on AirROI data from April 2024 to March 2025, reveals key trends in the niche market of 59 active listings.
Whether you're considering an Airbnb investment in Bra, optimizing your existing vacation rental, or exploring rental arbitrage opportunities, understanding the Bra Airbnb data is crucial. Navigating the high regulation landscape is key to maximizing your short term rental income potential. Let's dive into the specifics.
Key Bra Airbnb Performance Metrics Overview
Monthly Airbnb Revenue Variations & Income Potential in Bra (2025)
Understanding the monthly revenue variations for Airbnb listings in Bra is key to maximizing your short term rental income potential. Seasonality significantly impacts earnings. Our analysis, based on data from the past 12 months, shows that the peak revenue month for STRs in Bra is typically August, while February often presents the lowest earnings, highlighting opportunities for strategic pricing adjustments during shoulder and low seasons. Explore the typical Airbnb income in Bra across different performance tiers:
- Best-in-class properties (Top 10%) achieve $2,535+ monthly, often utilizing dynamic pricing and superior guest experiences.
- Strong performing properties (Top 25%) earn $1,737 or more, indicating effective management and desirable locations/amenities.
- Typical properties (Median) generate around $880 per month, representing the average market performance.
- Entry-level properties (Bottom 25%) see earnings around $373, often with potential for optimization.
Average Monthly Airbnb Earnings Trend in Bra
Bra Airbnb Occupancy Rate Trends (2025)
Maximize your bookings by understanding the Bra STR occupancy trends. Seasonal demand shifts significantly influence how often properties are booked. Typically, Augustsees the highest demand (peak season occupancy), while February experiences the lowest (low season). Effective strategies, like adjusting minimum stays or offering promotions, can boost occupancy during slower periods. Here's how different property tiers perform in Bra:
- Best-in-class properties (Top 10%) achieve 65%+ occupancy, indicating high desirability and potentially optimized availability.
- Strong performing properties (Top 25%) maintain 49% or higher occupancy, suggesting good market fit and guest satisfaction.
- Typical properties (Median) have an occupancy rate around 28%.
- Entry-level properties (Bottom 25%) average 13% occupancy, potentially facing higher vacancy.
Average Monthly Occupancy Rate Trend in Bra
Average Daily Rate (ADR) Airbnb Trends in Bra (2025)
Effective short term rental pricing strategy in Bra involves understanding monthly ADR fluctuations. The Average Daily Rate (ADR) for Airbnb in Bra typically peaks in December and dips lowest during August. Leveraging Airbnb dynamic pricing tools or strategies based on this seasonality can significantly boost revenue. Here's a look at the typical nightly rates achieved:
- Best-in-class properties (Top 10%) command rates of $150+ per night, often due to premium features or locations.
- Strong performing properties (Top 25%) achieve nightly rates of $113 or more.
- Typical properties (Median) charge around $90 per night.
- Entry-level properties (Bottom 25%) earn around $71 per night.
Average Daily Rate (ADR) Trend by Month in Bra
Get Live Bra Market Intelligence 👇

Explore Real-time Analytics
Airbnb Seasonality Analysis & Trends in Bra (2025)
Peak Season (August, May, September)
- Revenue averages $1,638 per month
- Occupancy rates average 42.5%
- Daily rates average $108
Shoulder Season
- Revenue averages $1,260 per month
- Occupancy maintains around 33.7%
- Daily rates hold near $110
Low Season (January, February, March)
- Revenue drops to average $650 per month
- Occupancy decreases to average 21.9%
- Daily rates adjust to average $107
Seasonality Insights for Bra
- The Airbnb seasonality in Bra shows highly seasonal trends requiring careful strategy. While the sections above show seasonal averages, it's also insightful to look at the extremes:
- During the high season, the absolute peak month showcases Bra's highest earning potential, with monthly revenues capable of climbing to $1,749, occupancy reaching a high of 44.8%, and ADRs peaking at $125.
- Conversely, the slowest single month of the year, typically falling within the low season, marks the market's lowest point. In this month, revenue might dip to $500, occupancy could drop to 19.9%, and ADRs may adjust down to $102.
- Understanding both the seasonal averages and these monthly peaks and troughs in revenue, occupancy, and ADR is crucial for maximizing your Airbnb profit potential in Bra.
Seasonal Strategies for Maximizing Profit
- Peak Season: Maximize revenue through premium pricing and potentially longer minimum stays. Ensure high availability.
- Low Season: Offer competitive pricing, special promotions (e.g., extended stay discounts), and flexible cancellation policies. Target off-season travelers like remote workers or budget-conscious guests.
- Shoulder Seasons: Implement dynamic pricing that balances peak and low rates. Target weekend travelers or specific events. Offer slightly more flexible terms than peak season.
- Regularly analyze your own performance against these Bra seasonality benchmarks and adjust your pricing and availability strategy accordingly.
Best Areas for Airbnb Investment in Bra (2025)
Exploring the top neighborhoods for short-term rentals in Bra? This section highlights key areas, outlining why they are attractive for hosts and guests, along with notable local attractions. Consider these locations based on your target guest profile and investment strategy.
| Neighborhood / Area | Why Host Here? (Target Guests & Appeal) | Key Attractions & Landmarks |
|---|---|---|
| Centro Storico | The historic center of Bra is rich in culture and history, attractive to tourists visiting historical sites and local cuisine. It's vibrant with shops, cafes, and historical architecture. | Piazza Carlo Alberto, Museo del Giocattolo, Casa della Tavola Racconta, Chiesa di Santa Chiara, Palazzo Comunale, Teatro Sociale |
| Pollenzo | Known for its beautiful landscapes and the University of Gastronomic Sciences, Pollenzo attracts culinary enthusiasts and those interested in slow food culture. | Castello di Pollenzo, Università di Scienze Gastronomiche, Vigna di Pollenzo, Wine cellars, Gastronomic events |
| Bra, Corso Garibaldi | Corso Garibaldi is a bustling street in Bra with shops, restaurants, and a lively atmosphere. It’s popular among both locals and visitors looking for dining and shopping options. | Caffè Adamo, Numerous boutiques, Gelato shops, Street events, Piazza XX Settembre |
| San Matteo | A residential area that is becoming popular for visitors looking for a more authentic experience away from the tourist spots, yet still conveniently located. | Local bakeries, Traditional restaurants, Nearby parks, Charming residences, Community markets |
| Riserva Naturale Speciale dei Ciciu del Villar | This natural reserve offers beautiful excursions and is appealing to nature lovers looking to escape the city while still being nearby. | Hiking paths, Natural rock formations, Wildlife watching, Picnic areas, Scenic views |
| Monviso | The Monviso area is ideal for outdoor enthusiasts, offering stunning mountain views and activities such as hiking and skiing. | Monte Monviso, Adventure sports, Scenic trails, Photography spots, Exquisite landscapes |
| Santa Maria | This area is known for its peaceful ambiance and proximity to various amenities, attracting families and long-term travelers. | Local parks, Family-friendly activities, Quiet neighborhoods, Proximity to schools, Community centers |
| Bra, Via Asilo | A quaint street in Bra known for its family-friendly environment, making it perfect for hosting families seeking a comfortable stay. | Children's playgrounds, Family-operated stores, Rural attractions, Culinary experiences, Local festivals |
Understanding Airbnb License Requirements & STR Laws in Bra (2025)
Yes, Bra, Piedmont, Italy enforces high STR regulations. Obtaining a license and ensuring compliance is almost certainly required according to current 2025 STR laws. Always verify the latest short term rental regulations and Airbnb license requirements directly with local government authorities for Bra to ensure full compliance before hosting.
(Source: AirROI data, 2025, based on 66% licensed listings)
Top Performing Airbnb Properties in Bra (2025)
Benchmark your potential! Explore examples of top-performing Airbnb properties in Brabased on Trailing Twelve Month (TTM) revenue. Analyze their characteristics, revenue, occupancy rate, and ADR to understand what drives success in this market.

_RELAXATION IN THE ROERO:BRA _"AMERICA OF THE WOODS"
Entire Place • 4 bedrooms
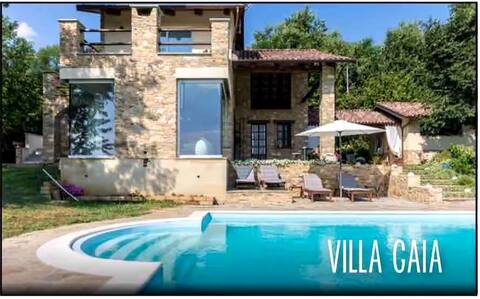
Villa with pool perfect for relax
Entire Place • 2 bedrooms
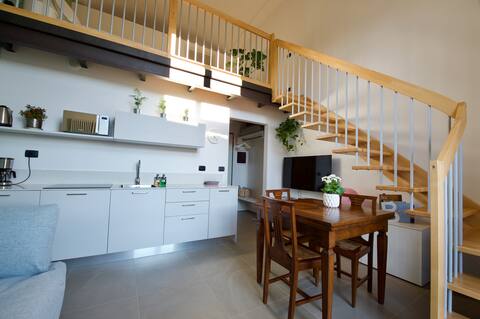
Loft Trevisan: Slow Food, Langhe, Comfort
Entire Place • 1 bedroom
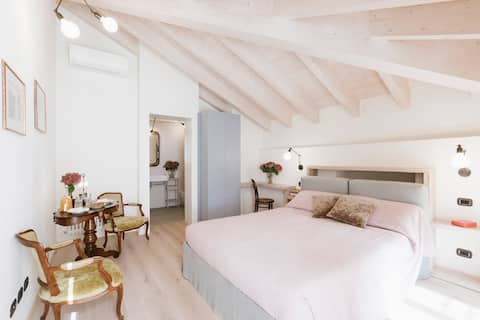
Villa Trisano - Double room "Sofora"
Private Room • N/A
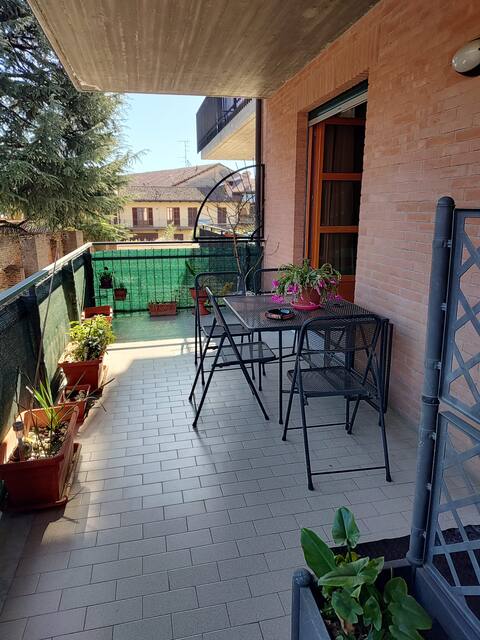
Two-room apartment with spacious terrace
Entire Place • 1 bedroom
Santa Chiara / NEW Apartment in the center of Bra
Entire Place • 1 bedroom
Note: Performance varies based on location, size, amenities, seasonality, and management quality. Data reflects the past 12 months.
Top Performing Airbnb Hosts in Bra (2025)
Learn from the best! This table showcases top-performing Airbnb hosts in Bra based on the number of properties managed and estimated total revenue over the past year. Analyze their scale and performance metrics.
| Host Name | Properties | Grossing Revenue | Stay Reviews | Avg Rating |
|---|---|---|---|---|
| Simone | 5 | $69,823 | 177 | 4.87/5.0 |
| Scalfino | 1 | $48,682 | 25 | 4.72/5.0 |
| Carlo | 3 | $48,506 | 52 | 4.95/5.0 |
| Pina | 1 | $41,324 | 64 | 4.80/5.0 |
| Mauro | 2 | $35,705 | 14 | 4.95/5.0 |
| Luciana | 3 | $29,952 | 4 | 1.67/5.0 |
| Silvia | 1 | $23,974 | 23 | 5.00/5.0 |
| Simona | 2 | $23,453 | 9 | 5.00/5.0 |
| Silvia | 1 | $21,367 | 8 | 4.88/5.0 |
| Caterina | 1 | $19,293 | 29 | 5.00/5.0 |
Analyzing the strategies of top hosts, such as their property selection, pricing, and guest communication, can offer valuable lessons for optimizing your own Airbnb operations in Bra.
Dive Deeper: Advanced Bra STR Market Data (2025)
Ready to unlock more insights? AirROI provides access to advanced metrics and comprehensive Airbnb data for Bra. Explore detailed analytics beyond this report to refine your investment strategy, optimize pricing, and maximize your vacation rental profits.
Explore Advanced MetricsBra Short-Term Rental Market Composition (2025): Property & Room Types
Room Type Distribution
Property Type Distribution
Market Composition Insights for Bra
- The Bra Airbnb market composition is heavily skewed towards Entire Home/Apt listings, which make up 62.7% of the 59 active rentals. This indicates strong guest preference for privacy and space.
- However, a notable 37.3% share for Private Rooms suggests opportunities for budget-conscious travelers or hosts renting out spare rooms.
- Looking at the property type distribution in Bra, Apartment/Condo properties are the most common (52.5%), reflecting the local real estate landscape.
- Houses represent a significant 35.6% portion, catering likely to families or larger groups.
- The presence of 5.1% Hotel/Boutique listings indicates integration with traditional hospitality.
- Smaller segments like others (combined 1.7%) offer potential for unique stay experiences.
Bra Airbnb Room Capacity Analysis (2025): Bedroom Distribution
Distribution of Listings by Number of Bedrooms
Room Capacity Insights for Bra
- The dominant room capacity in Bra is 1 bedroom listings, making up 54.2% of the market. This suggests a strong demand for properties suitable for couples or solo travelers.
- Together, 1 bedroom and 2 bedrooms properties represent 69.5% of the active Airbnb listings in Bra, indicating a high concentration in these sizes.
- With over half the market (54.2%) consisting of studios or 1-bedroom units, Bra is particularly well-suited for individuals or couples.
- Listings with 3+ bedrooms (8.5%) represent a smaller niche, potentially indicating an underserved market for larger group accommodations in Bra.
Bra Vacation Rental Guest Capacity Trends (2025)
Distribution of Listings by Guest Capacity
Guest Capacity Insights for Bra
- The most common guest capacity trend in Bra vacation rentals is listings accommodating 4 guests (32.2%). This suggests the primary traveler segment is likely small families or groups.
- Properties designed for 4 guests and 2 guests dominate the Bra STR market, accounting for 50.8% of listings.
- On average, properties in Bra are equipped to host 2.8 guests.
Bra Airbnb Booking Patterns (2025): Available vs. Booked Days
Available Days Distribution
Booked Days Distribution
Booking Pattern Insights for Bra
- The most common availability pattern in Bra falls within the 271-366 days range, representing 50.8% of listings. This suggests many properties have significant open periods on their calendars.
- Approximately 86.4% of listings show high availability (181+ days open annually), indicating potential for increased bookings or specific owner usage patterns.
- For booked days, the 91-180 days range is most frequent in Bra (35.6%), reflecting common guest stay durations or potential owner blocking patterns.
- A notable 13.6% of properties secure long booking periods (181+ days booked per year), highlighting successful long-term rental strategies or significant owner usage.
Bra Airbnb Minimum Stay Requirements Analysis
Distribution of Listings by Minimum Night Requirement
1 Night
33 listings
57.9% of total
2 Nights
15 listings
26.3% of total
3 Nights
1 listings
1.8% of total
7-29 Nights
4 listings
7% of total
30+ Nights
4 listings
7% of total
Key Insights
- The most prevalent minimum stay requirement in Bra is 1 Night, adopted by 57.9% of listings. This highlights the market's preference for shorter, flexible bookings.
- A strong majority (84.2%) of the Bra Airbnb data shows acceptance of very short stays (1-2 nights), indicating a dynamic, high-turnover market.
Recommendations
- Align with the market by considering a 1 Night minimum stay, as 57.9% of Bra hosts use this setting.
- Explore offering discounts for stays of 30+ nights to attract the 7% of the market seeking extended stays.
- Adjust minimum nights based on seasonality – potentially shorter during low season and longer during peak demand periods in Bra.
Bra Airbnb Cancellation Policy Trends Analysis (2025)
Flexible
22 listings
44% of total
Moderate
22 listings
44% of total
Strict
6 listings
12% of total
Cancellation Policy Insights for Bra
- The prevailing Airbnb cancellation policy trend in Bra is Flexible, used by 44% of listings.
- The market strongly favors guest-friendly terms, with 88.0% of listings offering Flexible or Moderate policies. This suggests guests in Bra may expect booking flexibility.
Recommendations for Hosts
- Consider adopting a Flexible policy to align with the 44% market standard in Bra.
- Using a Strict policy might deter some guests, as only 12% of listings use it. Evaluate if potential revenue protection outweighs possible lower booking rates.
- Regularly review your cancellation policy against competitors and market demand shifts in Bra.
Bra STR Booking Lead Time Analysis (2025)
Average Booking Lead Time by Month
Booking Lead Time Insights for Bra
- The overall average booking lead time for vacation rentals in Bra is 37 days.
- Guests book furthest in advance for stays during July (average 62 days), likely coinciding with peak travel demand or local events.
- The shortest booking windows occur for stays in November (average 25 days), indicating more last-minute travel plans during this time.
- Seasonally, Summer (55 days avg.) sees the longest lead times, while Winter (33 days avg.) has the shortest, reflecting typical travel planning cycles.
Recommendations for Hosts
- Use the overall average lead time (37 days) as a baseline for your pricing and availability strategy in Bra.
- For July stays, consider implementing length-of-stay discounts or slightly higher rates for bookings made less than 62 days out to capitalize on advance planning.
- Target marketing efforts for the Summer season well in advance (at least 55 days) to capture early planners.
- Monitor your own booking lead times against these Bra averages to identify opportunities for dynamic pricing adjustments.
Popular & Essential Airbnb Amenities in Bra (2025)
Amenity Prevalence
Amenity Insights for Bra
- Popular amenities like Heating, Wifi, Hair dryer are common but not universal. Offering these can provide a competitive edge.
- Warning: Wifi is not universally provided but is considered essential globally. Ensure reliable Wifi is offered.
Recommendations for Hosts
- Consider adding popular differentiators like Heating or Wifi to increase appeal.
- Highlight unique or less common amenities you offer (e.g., hot tub, dedicated workspace, EV charger) in your listing description and photos.
- Regularly check competitor amenities in Bra to stay competitive.
Bra Airbnb Guest Demographics & Profile Analysis (2025)
Guest Profile Summary for Bra
- The typical guest profile for Airbnb in Bra consists of a mix of domestic (41%) and international guests, with top international origins including France, typically belonging to the Post-2000s (Gen Z/Alpha) group (50%), primarily speaking English or Italian.
- Domestic travelers account for 41.3% of guests.
- Key international markets include Italy (41.3%) and France (10%).
- Top languages spoken are English (35.1%) followed by Italian (18.8%).
- A significant demographic segment is the Post-2000s (Gen Z/Alpha) group, representing 50% of guests.
Recommendations for Hosts
- Balance marketing efforts between domestic and international channels based on the guest mix.
- Tailor amenities and listing descriptions to appeal to the dominant Post-2000s (Gen Z/Alpha) demographic (e.g., highlight fast WiFi, smart home features, local guides).
- Highlight unique local experiences or amenities relevant to the primary guest profile.
- Consider seasonal promotions aligned with peak travel times for key origin markets.
Nearby Short-Term Rental Market Comparison
How does the Bra Airbnb market stack up against its neighbors? Compare key performance metrics like average monthly revenue, ADR, and occupancy rates in surrounding areas to understand the broader regional STR landscape.
| Market | Active Properties | Monthly Revenue | Daily Rate | Avg. Occupancy |
|---|---|---|---|---|
| Les Clefs | 30 | $5,741 | $323.11 | 44% |
| Monteu Roero | 16 | $4,432 | $540.14 | 36% |
| Manigod | 194 | $4,127 | $427.80 | 40% |
| Ramatuelle | 213 | $3,891 | $670.10 | 41% |
| Saint-Jean-Cap-Ferrat | 107 | $3,844 | $424.21 | 46% |
| Cossano Belbo | 13 | $3,632 | $284.21 | 42% |
| Saint-Tropez | 742 | $3,498 | $506.57 | 41% |
| Saint-Nicolas-la-Chapelle | 27 | $3,381 | $375.70 | 43% |
| Cassinasco | 18 | $3,219 | $545.40 | 41% |
| Charvonnex | 11 | $3,212 | $228.03 | 56% |