Barolo Airbnb Market Analysis 2025: Short Term Rental Data & Vacation Rental Statistics in Piedmont, Italy
Is Airbnb profitable in Barolo in 2025? Explore comprehensive Airbnb analytics for Barolo, Piedmont, Italy to uncover income potential. This 2025 STR market report for Barolo, based on AirROI data from April 2024 to March 2025, reveals key trends in the niche market of 51 active listings.
Whether you're considering an Airbnb investment in Barolo, optimizing your existing vacation rental, or exploring rental arbitrage opportunities, understanding the Barolo Airbnb data is crucial. Navigating the high regulation landscape is key to maximizing your short term rental income potential. Let's dive into the specifics.
Key Barolo Airbnb Performance Metrics Overview
Monthly Airbnb Revenue Variations & Income Potential in Barolo (2025)
Understanding the monthly revenue variations for Airbnb listings in Barolo is key to maximizing your short term rental income potential. Seasonality significantly impacts earnings. Our analysis, based on data from the past 12 months, shows that the peak revenue month for STRs in Barolo is typically July, while January often presents the lowest earnings, highlighting opportunities for strategic pricing adjustments during shoulder and low seasons. Explore the typical Airbnb income in Barolo across different performance tiers:
- Best-in-class properties (Top 10%) achieve $4,867+ monthly, often utilizing dynamic pricing and superior guest experiences.
- Strong performing properties (Top 25%) earn $2,780 or more, indicating effective management and desirable locations/amenities.
- Typical properties (Median) generate around $1,314 per month, representing the average market performance.
- Entry-level properties (Bottom 25%) see earnings around $597, often with potential for optimization.
Average Monthly Airbnb Earnings Trend in Barolo
Barolo Airbnb Occupancy Rate Trends (2025)
Maximize your bookings by understanding the Barolo STR occupancy trends. Seasonal demand shifts significantly influence how often properties are booked. Typically, Septembersees the highest demand (peak season occupancy), while January experiences the lowest (low season). Effective strategies, like adjusting minimum stays or offering promotions, can boost occupancy during slower periods. Here's how different property tiers perform in Barolo:
- Best-in-class properties (Top 10%) achieve 63%+ occupancy, indicating high desirability and potentially optimized availability.
- Strong performing properties (Top 25%) maintain 44% or higher occupancy, suggesting good market fit and guest satisfaction.
- Typical properties (Median) have an occupancy rate around 24%.
- Entry-level properties (Bottom 25%) average 12% occupancy, potentially facing higher vacancy.
Average Monthly Occupancy Rate Trend in Barolo
Average Daily Rate (ADR) Airbnb Trends in Barolo (2025)
Effective short term rental pricing strategy in Barolo involves understanding monthly ADR fluctuations. The Average Daily Rate (ADR) for Airbnb in Barolo typically peaks in November and dips lowest during April. Leveraging Airbnb dynamic pricing tools or strategies based on this seasonality can significantly boost revenue. Here's a look at the typical nightly rates achieved:
- Best-in-class properties (Top 10%) command rates of $412+ per night, often due to premium features or locations.
- Strong performing properties (Top 25%) achieve nightly rates of $243 or more.
- Typical properties (Median) charge around $144 per night.
- Entry-level properties (Bottom 25%) earn around $115 per night.
Average Daily Rate (ADR) Trend by Month in Barolo
Get Live Barolo Market Intelligence 👇

Explore Real-time Analytics
Airbnb Seasonality Analysis & Trends in Barolo (2025)
Peak Season (July, June, September)
- Revenue averages $2,843 per month
- Occupancy rates average 39.5%
- Daily rates average $204
Shoulder Season
- Revenue averages $2,240 per month
- Occupancy maintains around 30.8%
- Daily rates hold near $206
Low Season (January, February, December)
- Revenue drops to average $1,002 per month
- Occupancy decreases to average 17.5%
- Daily rates adjust to average $209
Seasonality Insights for Barolo
- The Airbnb seasonality in Barolo shows highly seasonal trends requiring careful strategy. While the sections above show seasonal averages, it's also insightful to look at the extremes:
- During the high season, the absolute peak month showcases Barolo's highest earning potential, with monthly revenues capable of climbing to $2,938, occupancy reaching a high of 42.7%, and ADRs peaking at $212.
- Conversely, the slowest single month of the year, typically falling within the low season, marks the market's lowest point. In this month, revenue might dip to $784, occupancy could drop to 12.3%, and ADRs may adjust down to $201.
- Understanding both the seasonal averages and these monthly peaks and troughs in revenue, occupancy, and ADR is crucial for maximizing your Airbnb profit potential in Barolo.
Seasonal Strategies for Maximizing Profit
- Peak Season: Maximize revenue through premium pricing and potentially longer minimum stays. Ensure high availability.
- Low Season: Offer competitive pricing, special promotions (e.g., extended stay discounts), and flexible cancellation policies. Target off-season travelers like remote workers or budget-conscious guests.
- Shoulder Seasons: Implement dynamic pricing that balances peak and low rates. Target weekend travelers or specific events. Offer slightly more flexible terms than peak season.
- Regularly analyze your own performance against these Barolo seasonality benchmarks and adjust your pricing and availability strategy accordingly.
Best Areas for Airbnb Investment in Barolo (2025)
Exploring the top neighborhoods for short-term rentals in Barolo? This section highlights key areas, outlining why they are attractive for hosts and guests, along with notable local attractions. Consider these locations based on your target guest profile and investment strategy.
| Neighborhood / Area | Why Host Here? (Target Guests & Appeal) | Key Attractions & Landmarks |
|---|---|---|
| Barolo Vineyards | Famous for its picturesque landscapes and rich winemaking traditions. Ideal for wine enthusiasts and tourists wanting to experience the heart of Barolo wine country. | Barolo Castle, Wine cellars, Enoteca Regionale del Barolo, Barolo Wine Museum, Tasting tours |
| Torre Campanaria | Historic bell tower offering stunning views of the vineyards. A must-visit for those looking to enjoy panoramic scenery and local culture. | Torre Campanaria di Barolo, Municipal Museum of Barolo, Historical village of Barolo |
| Local Trattorias | Known for delicious Italian cuisine and warm hospitality. Attracts food lovers seeking authentic regional dishes and wine pairings. | Trattoria della Storia, Locanda del Castello, Wine pairing events, Local cooking classes |
| Pola di Barolo | Charming neighborhood with beautiful countryside surroundings. Perfect for nature lovers and those looking to escape the city in a tranquil setting. | Cycling trails, Parks and olive groves, Local artisan shops |
| Castle of Fontanafredda | Historic castle that is also a winery, popular for tours and tastings. Attracts tourists looking to experience luxury and history. | Wine tours, Historical exhibitions, Estate gardens |
| La Morra | Nearby town known for its stunning wine views and culinary experiences. A great base for exploring Barolo and surrounding attractions. | Belvedere di La Morra, Local restaurants, Vineyard excursions |
| Serralunga d'Alba | Another wine-centric area close to Barolo, filled with medieval charm and beautiful landscapes. Perfect for those who love history and wine. | Serralunga Castle, Vigna Rionda, Local festivals |
| Grinzane Cavour | Historic castle and wine village known for cultural events and wine tastings. Offers a rich historical experience along with gastronomic delights. | Grinzane Cavour Castle, Wine tastings, Cultural festivals |
Understanding Airbnb License Requirements & STR Laws in Barolo (2025)
Yes, Barolo, Piedmont, Italy enforces high STR regulations. Obtaining a license and ensuring compliance is almost certainly required according to current 2025 STR laws. Always verify the latest short term rental regulations and Airbnb license requirements directly with local government authorities for Barolo to ensure full compliance before hosting.
(Source: AirROI data, 2025, based on 80% licensed listings)
Top Performing Airbnb Properties in Barolo (2025)
Benchmark your potential! Explore examples of top-performing Airbnb properties in Barolobased on Trailing Twelve Month (TTM) revenue. Analyze their characteristics, revenue, occupancy rate, and ADR to understand what drives success in this market.
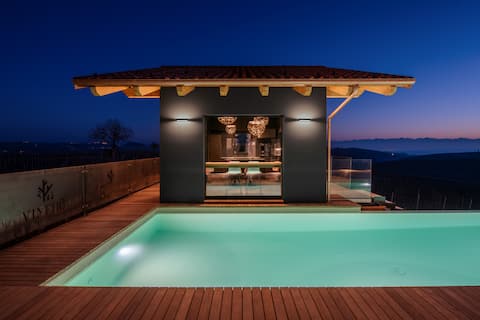
Vineho - La Volta
Entire Place • 1 bedroom
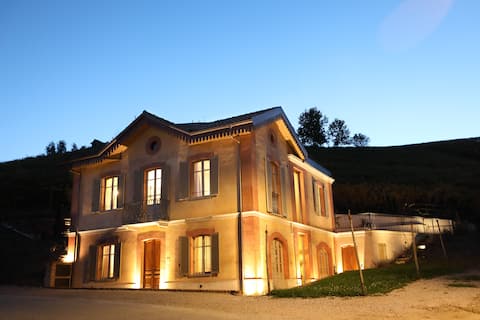
Villa Giobatta in Barolo - Cannubi
Entire Place • 4 bedrooms
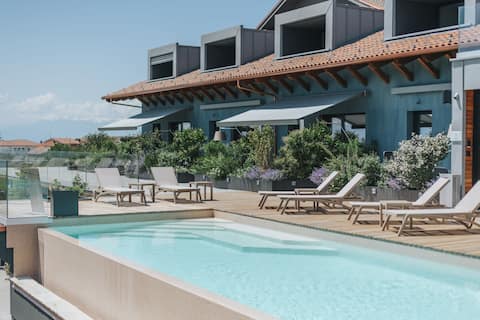
Vineho - Bricco delle Viole
Entire Place • 1 bedroom
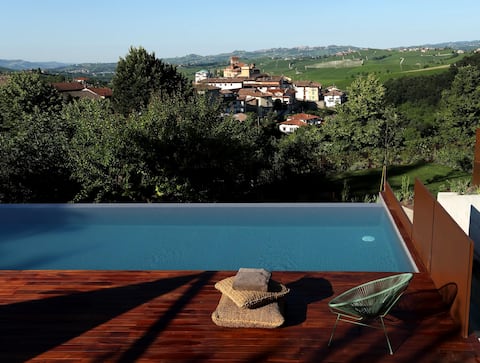
Villa Carla_Barolo: VIGNARIONDAsuite
Entire Place • 1 bedroom
Villa Carla_ Barolo: VILLEROsuite
Entire Place • 1 bedroom

Villa Carla_Barolo: ROCCHEdiCASTIGLIONEsuite
Entire Place • 1 bedroom
Note: Performance varies based on location, size, amenities, seasonality, and management quality. Data reflects the past 12 months.
Top Performing Airbnb Hosts in Barolo (2025)
Learn from the best! This table showcases top-performing Airbnb hosts in Barolo based on the number of properties managed and estimated total revenue over the past year. Analyze their scale and performance metrics.
| Host Name | Properties | Grossing Revenue | Stay Reviews | Avg Rating |
|---|---|---|---|---|
| Cristina | 6 | $184,587 | 18 | 1.67/5.0 |
| Langhe Holiday | 12 | $166,244 | 187 | 4.09/5.0 |
| Oddero | 4 | $156,792 | 190 | 4.98/5.0 |
| Cristina | 1 | $69,207 | 5 | 5.00/5.0 |
| Marion - Interhome Group | 2 | $51,699 | 25 | 4.88/5.0 |
| Marina | 2 | $40,659 | 17 | 4.83/5.0 |
| Eugenio Vacchetto | 2 | $37,516 | 108 | 4.81/5.0 |
| Daniela | 1 | $34,531 | 4 | 5.00/5.0 |
| Maria Pia E Tiziana | 3 | $31,102 | 193 | 4.98/5.0 |
| Giovanni | 1 | $29,496 | 214 | 4.99/5.0 |
Analyzing the strategies of top hosts, such as their property selection, pricing, and guest communication, can offer valuable lessons for optimizing your own Airbnb operations in Barolo.
Dive Deeper: Advanced Barolo STR Market Data (2025)
Ready to unlock more insights? AirROI provides access to advanced metrics and comprehensive Airbnb data for Barolo. Explore detailed analytics beyond this report to refine your investment strategy, optimize pricing, and maximize your vacation rental profits.
Explore Advanced MetricsBarolo Short-Term Rental Market Composition (2025): Property & Room Types
Room Type Distribution
Property Type Distribution
Market Composition Insights for Barolo
- The Barolo Airbnb market composition is heavily skewed towards Entire Home/Apt listings, which make up 78.4% of the 51 active rentals. This indicates strong guest preference for privacy and space.
- Looking at the property type distribution in Barolo, Apartment/Condo properties are the most common (60.8%), reflecting the local real estate landscape.
- Houses represent a significant 25.5% portion, catering likely to families or larger groups.
- The presence of 7.8% Hotel/Boutique listings indicates integration with traditional hospitality.
Barolo Airbnb Room Capacity Analysis (2025): Bedroom Distribution
Distribution of Listings by Number of Bedrooms
Room Capacity Insights for Barolo
- The dominant room capacity in Barolo is 1 bedroom listings, making up 58.8% of the market. This suggests a strong demand for properties suitable for couples or solo travelers.
- Together, 1 bedroom and 2 bedrooms properties represent 76.4% of the active Airbnb listings in Barolo, indicating a high concentration in these sizes.
- With over half the market (58.8%) consisting of studios or 1-bedroom units, Barolo is particularly well-suited for individuals or couples.
- Listings with 3+ bedrooms (9.9%) represent a smaller niche, potentially indicating an underserved market for larger group accommodations in Barolo.
Barolo Vacation Rental Guest Capacity Trends (2025)
Distribution of Listings by Guest Capacity
Guest Capacity Insights for Barolo
- The most common guest capacity trend in Barolo vacation rentals is listings accommodating 4 guests (41.2%). This suggests the primary traveler segment is likely small families or groups.
- Properties designed for 4 guests and 2 guests dominate the Barolo STR market, accounting for 64.7% of listings.
- 17.7% of properties accommodate 6+ guests, serving the market segment for larger families or group travel in Barolo.
- On average, properties in Barolo are equipped to host 3.5 guests.
Barolo Airbnb Booking Patterns (2025): Available vs. Booked Days
Available Days Distribution
Booked Days Distribution
Booking Pattern Insights for Barolo
- The most common availability pattern in Barolo falls within the 271-366 days range, representing 66.7% of listings. This suggests many properties have significant open periods on their calendars.
- Approximately 90.2% of listings show high availability (181+ days open annually), indicating potential for increased bookings or specific owner usage patterns.
- For booked days, the 31-90 days range is most frequent in Barolo (49%), reflecting common guest stay durations or potential owner blocking patterns.
- A notable 11.8% of properties secure long booking periods (181+ days booked per year), highlighting successful long-term rental strategies or significant owner usage.
Barolo Airbnb Minimum Stay Requirements Analysis
Distribution of Listings by Minimum Night Requirement
1 Night
16 listings
33.3% of total
2 Nights
19 listings
39.6% of total
4-6 Nights
3 listings
6.3% of total
30+ Nights
10 listings
20.8% of total
Key Insights
- The most prevalent minimum stay requirement in Barolo is 2 Nights, adopted by 39.6% of listings. This highlights the market's preference for shorter, flexible bookings.
- A strong majority (72.9%) of the Barolo Airbnb data shows acceptance of very short stays (1-2 nights), indicating a dynamic, high-turnover market.
- A significant segment (20.8%) caters to monthly stays (30+ nights) in Barolo, pointing to opportunities in the extended-stay market.
Recommendations
- Align with the market by considering a 2 Nights minimum stay, as 39.6% of Barolo hosts use this setting.
- Explore offering discounts for stays of 30+ nights to attract the 20.8% of the market seeking extended stays.
- Adjust minimum nights based on seasonality – potentially shorter during low season and longer during peak demand periods in Barolo.
Barolo Airbnb Cancellation Policy Trends Analysis (2025)
Super Strict 30 Days
2 listings
4.4% of total
Flexible
13 listings
28.9% of total
Moderate
16 listings
35.6% of total
Strict
14 listings
31.1% of total
Cancellation Policy Insights for Barolo
- The prevailing Airbnb cancellation policy trend in Barolo is Moderate, used by 35.6% of listings.
- There's a relatively balanced mix between guest-friendly (64.5%) and stricter (31.1%) policies, offering choices for different guest needs.
Recommendations for Hosts
- Consider adopting a Moderate policy to align with the 35.6% market standard in Barolo.
- With 31.1% using Strict terms, this is a viable option in Barolo, particularly for high-value properties or during peak demand periods.
- Regularly review your cancellation policy against competitors and market demand shifts in Barolo.
Barolo STR Booking Lead Time Analysis (2025)
Average Booking Lead Time by Month
Booking Lead Time Insights for Barolo
- The overall average booking lead time for vacation rentals in Barolo is 57 days.
- Guests book furthest in advance for stays during April (average 80 days), likely coinciding with peak travel demand or local events.
- The shortest booking windows occur for stays in February (average 30 days), indicating more last-minute travel plans during this time.
- Seasonally, Spring (68 days avg.) sees the longest lead times, while Winter (52 days avg.) has the shortest, reflecting typical travel planning cycles.
Recommendations for Hosts
- Use the overall average lead time (57 days) as a baseline for your pricing and availability strategy in Barolo.
- For April stays, consider implementing length-of-stay discounts or slightly higher rates for bookings made less than 80 days out to capitalize on advance planning.
- Target marketing efforts for the Spring season well in advance (at least 68 days) to capture early planners.
- Monitor your own booking lead times against these Barolo averages to identify opportunities for dynamic pricing adjustments.
Popular & Essential Airbnb Amenities in Barolo (2025)
Amenity Prevalence
Amenity Insights for Barolo
- Essential amenities in Barolo that guests expect include: Heating, Hangers, Hot water, Wifi, Essentials. Lacking these (any) could significantly impact bookings.
- Popular amenities like TV, Hair dryer, Shampoo are common but not universal. Offering these can provide a competitive edge.
Recommendations for Hosts
- Ensure your listing includes all essential amenities for Barolo: Heating, Hangers, Hot water, Wifi, Essentials.
- Prioritize adding missing essentials: Hot water, Wifi, Essentials.
- Consider adding popular differentiators like TV or Hair dryer to increase appeal.
- Highlight unique or less common amenities you offer (e.g., hot tub, dedicated workspace, EV charger) in your listing description and photos.
- Regularly check competitor amenities in Barolo to stay competitive.
Barolo Airbnb Guest Demographics & Profile Analysis (2025)
Guest Profile Summary for Barolo
- The typical guest profile for Airbnb in Barolo consists of predominantly international visitors (75%), with top international origins including United States, typically belonging to the Post-2000s (Gen Z/Alpha) group (50%), primarily speaking English or Italian.
- Domestic travelers account for 24.9% of guests.
- Key international markets include Italy (24.9%) and United States (16.4%).
- Top languages spoken are English (41.4%) followed by Italian (16.4%).
- A significant demographic segment is the Post-2000s (Gen Z/Alpha) group, representing 50% of guests.
Recommendations for Hosts
- Focus marketing internationally, particularly towards travelers from United States.
- Tailor amenities and listing descriptions to appeal to the dominant Post-2000s (Gen Z/Alpha) demographic (e.g., highlight fast WiFi, smart home features, local guides).
- Highlight unique local experiences or amenities relevant to the primary guest profile.
- Consider seasonal promotions aligned with peak travel times for key origin markets.
Nearby Short-Term Rental Market Comparison
How does the Barolo Airbnb market stack up against its neighbors? Compare key performance metrics like average monthly revenue, ADR, and occupancy rates in surrounding areas to understand the broader regional STR landscape.
| Market | Active Properties | Monthly Revenue | Daily Rate | Avg. Occupancy |
|---|---|---|---|---|
| Les Clefs | 30 | $5,741 | $323.11 | 44% |
| Monteu Roero | 16 | $4,432 | $540.14 | 36% |
| Manigod | 194 | $4,127 | $427.80 | 40% |
| Ramatuelle | 213 | $3,891 | $670.10 | 41% |
| Saint-Jean-Cap-Ferrat | 107 | $3,844 | $424.21 | 46% |
| Cossano Belbo | 13 | $3,632 | $284.21 | 42% |
| Saint-Tropez | 742 | $3,498 | $506.57 | 41% |
| Saint-Nicolas-la-Chapelle | 27 | $3,381 | $375.70 | 43% |
| Cassinasco | 18 | $3,219 | $545.40 | 41% |
| Charvonnex | 11 | $3,212 | $228.03 | 56% |