Bardonecchia Airbnb Market Analysis 2025: Short Term Rental Data & Vacation Rental Statistics in Piedmont, Italy
Is Airbnb profitable in Bardonecchia in 2025? Explore comprehensive Airbnb analytics for Bardonecchia, Piedmont, Italy to uncover income potential. This 2025 STR market report for Bardonecchia, based on AirROI data from April 2024 to March 2025, reveals key trends in the niche market of 190 active listings.
Whether you're considering an Airbnb investment in Bardonecchia, optimizing your existing vacation rental, or exploring rental arbitrage opportunities, understanding the Bardonecchia Airbnb data is crucial. Navigating the high regulation landscape is key to maximizing your short term rental income potential. Let's dive into the specifics.
Key Bardonecchia Airbnb Performance Metrics Overview
Monthly Airbnb Revenue Variations & Income Potential in Bardonecchia (2025)
Understanding the monthly revenue variations for Airbnb listings in Bardonecchia is key to maximizing your short term rental income potential. Seasonality significantly impacts earnings. Our analysis, based on data from the past 12 months, shows that the peak revenue month for STRs in Bardonecchia is typically February, while September often presents the lowest earnings, highlighting opportunities for strategic pricing adjustments during shoulder and low seasons. Explore the typical Airbnb income in Bardonecchia across different performance tiers:
- Best-in-class properties (Top 10%) achieve $2,930+ monthly, often utilizing dynamic pricing and superior guest experiences.
- Strong performing properties (Top 25%) earn $1,913 or more, indicating effective management and desirable locations/amenities.
- Typical properties (Median) generate around $1,077 per month, representing the average market performance.
- Entry-level properties (Bottom 25%) see earnings around $559, often with potential for optimization.
Average Monthly Airbnb Earnings Trend in Bardonecchia
Bardonecchia Airbnb Occupancy Rate Trends (2025)
Maximize your bookings by understanding the Bardonecchia STR occupancy trends. Seasonal demand shifts significantly influence how often properties are booked. Typically, Augustsees the highest demand (peak season occupancy), while September experiences the lowest (low season). Effective strategies, like adjusting minimum stays or offering promotions, can boost occupancy during slower periods. Here's how different property tiers perform in Bardonecchia:
- Best-in-class properties (Top 10%) achieve 63%+ occupancy, indicating high desirability and potentially optimized availability.
- Strong performing properties (Top 25%) maintain 45% or higher occupancy, suggesting good market fit and guest satisfaction.
- Typical properties (Median) have an occupancy rate around 28%.
- Entry-level properties (Bottom 25%) average 13% occupancy, potentially facing higher vacancy.
Average Monthly Occupancy Rate Trend in Bardonecchia
Average Daily Rate (ADR) Airbnb Trends in Bardonecchia (2025)
Effective short term rental pricing strategy in Bardonecchia involves understanding monthly ADR fluctuations. The Average Daily Rate (ADR) for Airbnb in Bardonecchia typically peaks in February and dips lowest during September. Leveraging Airbnb dynamic pricing tools or strategies based on this seasonality can significantly boost revenue. Here's a look at the typical nightly rates achieved:
- Best-in-class properties (Top 10%) command rates of $224+ per night, often due to premium features or locations.
- Strong performing properties (Top 25%) achieve nightly rates of $177 or more.
- Typical properties (Median) charge around $132 per night.
- Entry-level properties (Bottom 25%) earn around $97 per night.
Average Daily Rate (ADR) Trend by Month in Bardonecchia
Get Live Bardonecchia Market Intelligence 👇

Explore Real-time Analytics
Airbnb Seasonality Analysis & Trends in Bardonecchia (2025)
Peak Season (February, August, January)
- Revenue averages $2,088 per month
- Occupancy rates average 46.2%
- Daily rates average $160
Shoulder Season
- Revenue averages $1,400 per month
- Occupancy maintains around 29.1%
- Daily rates hold near $145
Low Season (September, October, November)
- Revenue drops to average $787 per month
- Occupancy decreases to average 21.9%
- Daily rates adjust to average $135
Seasonality Insights for Bardonecchia
- The Airbnb seasonality in Bardonecchia shows highly seasonal trends requiring careful strategy. While the sections above show seasonal averages, it's also insightful to look at the extremes:
- During the high season, the absolute peak month showcases Bardonecchia's highest earning potential, with monthly revenues capable of climbing to $2,244, occupancy reaching a high of 53.7%, and ADRs peaking at $172.
- Conversely, the slowest single month of the year, typically falling within the low season, marks the market's lowest point. In this month, revenue might dip to $679, occupancy could drop to 21.3%, and ADRs may adjust down to $132.
- Understanding both the seasonal averages and these monthly peaks and troughs in revenue, occupancy, and ADR is crucial for maximizing your Airbnb profit potential in Bardonecchia.
Seasonal Strategies for Maximizing Profit
- Peak Season: Maximize revenue through premium pricing and potentially longer minimum stays. Ensure high availability.
- Low Season: Offer competitive pricing, special promotions (e.g., extended stay discounts), and flexible cancellation policies. Target off-season travelers like remote workers or budget-conscious guests.
- Shoulder Seasons: Implement dynamic pricing that balances peak and low rates. Target weekend travelers or specific events. Offer slightly more flexible terms than peak season.
- Regularly analyze your own performance against these Bardonecchia seasonality benchmarks and adjust your pricing and availability strategy accordingly.
Best Areas for Airbnb Investment in Bardonecchia (2025)
Exploring the top neighborhoods for short-term rentals in Bardonecchia? This section highlights key areas, outlining why they are attractive for hosts and guests, along with notable local attractions. Consider these locations based on your target guest profile and investment strategy.
| Neighborhood / Area | Why Host Here? (Target Guests & Appeal) | Key Attractions & Landmarks |
|---|---|---|
| Jafferau | A popular area known for its skiing and mountain activities. It attracts winter sports enthusiasts and nature lovers looking to enjoy the beautiful Alps year-round. | Ski slopes and lifts, Jafferau Ski Resort, Alpine hiking trails, Mountain biking routes, Scenic viewpoints |
| Bardonecchia Village | The charming village center offers a mix of local shops and restaurants, making it ideal for those who want to experience the local culture and conveniences. | Cultural events, Local markets, Restaurants and cafes, Historic architecture, Walking paths |
| Mezzenile | A picturesque mountain area ideal for hiking and nature retreats. Attracts tourists looking for tranquility and outdoor activities. | National Park of Gran Paradiso, Hiking trails, Stunning mountain views, Wildlife watching, Peaceful environment |
| Fresch Alps | A serene area for skiing and outdoor activities, ideal for families and adventure seekers, with easily accessible slopes and beautiful landscapes. | Fresch Alps Ski Resort, Snowshoeing trails, Family-friendly activities, Nature walks, Winter sports |
| Val di Susa | Famous for its mountains and history, this valley attracts tourists interested in both nature and cultural heritage, with many activities available year-round. | Cultural sites, Hiking routes, Historic towns like Susa, Alpine sports, Local cuisine |
| Rocce di Banchette | A lesser-known area providing an escape into nature, perfect for those seeking peace and quiet away from the busier tourist spots. | Scenic hiking paths, Natural landscapes, Bird watching spots, Outdoor sports, Tranquil environment |
| Pian del Sole | An area well-connected with ski slopes and summer hiking trails, perfect for active tourists in both winter and summer seasons. | Summer hiking trails, Winter sports, Ski lifts, Family activities, Local dining options |
| Les Arnaudes | A quaint area featuring local accommodations and nature activities. It’s ideal for guests looking for a relaxed atmosphere and connection with nature. | Natural parks, Cultural experiences, Farmers market, Scenic drives, Outdoor adventures |
Understanding Airbnb License Requirements & STR Laws in Bardonecchia (2025)
Yes, Bardonecchia, Piedmont, Italy enforces high STR regulations. Obtaining a license and ensuring compliance is almost certainly required according to current 2025 STR laws. Always verify the latest short term rental regulations and Airbnb license requirements directly with local government authorities for Bardonecchia to ensure full compliance before hosting.
(Source: AirROI data, 2025, based on 66% licensed listings)
Top Performing Airbnb Properties in Bardonecchia (2025)
Benchmark your potential! Explore examples of top-performing Airbnb properties in Bardonecchiabased on Trailing Twelve Month (TTM) revenue. Analyze their characteristics, revenue, occupancy rate, and ADR to understand what drives success in this market.
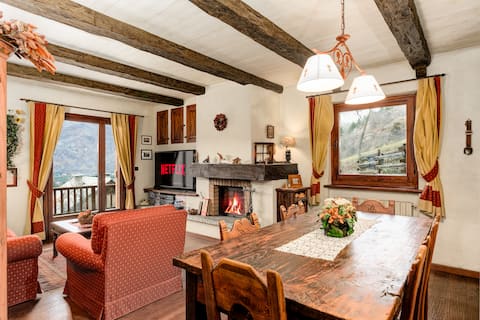
Chalet with Breathtaking Views + Private Garage
Entire Place • 2 bedrooms
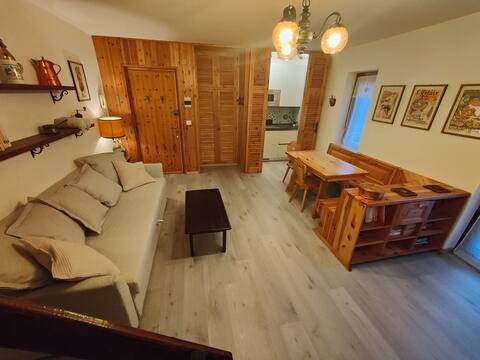
Carla's home, cozy and close to the slopes
Entire Place • 2 bedrooms
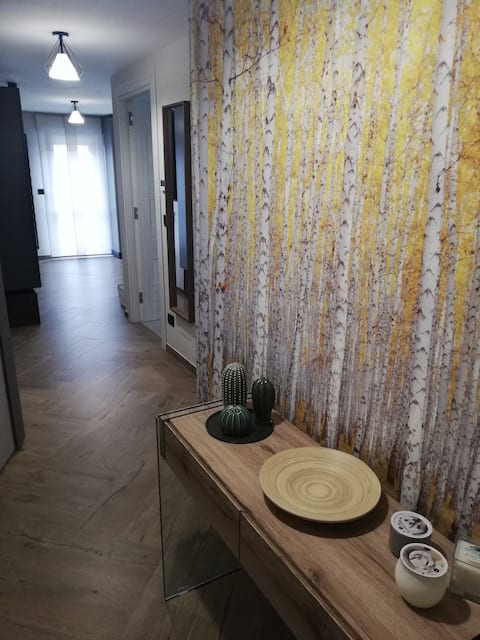
Bardonecchia Apartment
Entire Place • 3 bedrooms
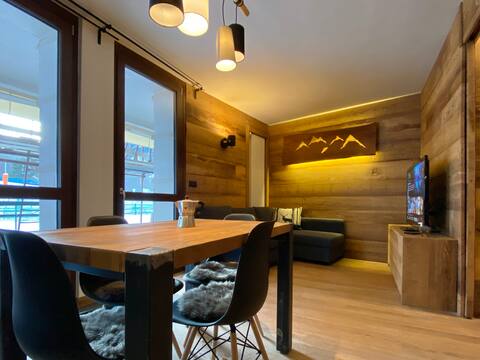
Wooden House “Campo Smith”
Entire Place • 2 bedrooms
Amazing Flat 10’ from the slopes
Entire Place • 2 bedrooms
Stella Alpina, Downtown Alpine View
Entire Place • 1 bedroom
Note: Performance varies based on location, size, amenities, seasonality, and management quality. Data reflects the past 12 months.
Top Performing Airbnb Hosts in Bardonecchia (2025)
Learn from the best! This table showcases top-performing Airbnb hosts in Bardonecchia based on the number of properties managed and estimated total revenue over the past year. Analyze their scale and performance metrics.
| Host Name | Properties | Grossing Revenue | Stay Reviews | Avg Rating |
|---|---|---|---|---|
| Affitti Brevi Italia | 33 | $297,215 | 159 | 3.54/5.0 |
| Roberta | 17 | $174,523 | 86 | 3.17/5.0 |
| Case | 6 | $93,516 | 43 | 4.92/5.0 |
| Frejus Case Vacanza | 8 | $61,649 | 102 | 3.89/5.0 |
| Giulio | 1 | $47,106 | 13 | 5.00/5.0 |
| Carla | 1 | $34,521 | 15 | 4.93/5.0 |
| Amalia | 1 | $34,202 | 8 | 5.00/5.0 |
| My Holidays | 1 | $32,282 | 27 | 4.93/5.0 |
| Laurene | 1 | $32,280 | 9 | 4.89/5.0 |
| Simone | 1 | $31,180 | 18 | 4.94/5.0 |
Analyzing the strategies of top hosts, such as their property selection, pricing, and guest communication, can offer valuable lessons for optimizing your own Airbnb operations in Bardonecchia.
Dive Deeper: Advanced Bardonecchia STR Market Data (2025)
Ready to unlock more insights? AirROI provides access to advanced metrics and comprehensive Airbnb data for Bardonecchia. Explore detailed analytics beyond this report to refine your investment strategy, optimize pricing, and maximize your vacation rental profits.
Explore Advanced MetricsBardonecchia Short-Term Rental Market Composition (2025): Property & Room Types
Room Type Distribution
Property Type Distribution
Market Composition Insights for Bardonecchia
- The Bardonecchia Airbnb market composition is heavily skewed towards Entire Home/Apt listings, which make up 100% of the 190 active rentals. This indicates strong guest preference for privacy and space.
- Looking at the property type distribution in Bardonecchia, Apartment/Condo properties are the most common (94.2%), reflecting the local real estate landscape.
- Smaller segments like outdoor/unique (combined 0.5%) offer potential for unique stay experiences.
Bardonecchia Airbnb Room Capacity Analysis (2025): Bedroom Distribution
Distribution of Listings by Number of Bedrooms
Room Capacity Insights for Bardonecchia
- The dominant room capacity in Bardonecchia is 1 bedroom listings, making up 48.4% of the market. This suggests a strong demand for properties suitable for couples or solo travelers.
- Together, 1 bedroom and 2 bedrooms properties represent 81.6% of the active Airbnb listings in Bardonecchia, indicating a high concentration in these sizes.
Bardonecchia Vacation Rental Guest Capacity Trends (2025)
Distribution of Listings by Guest Capacity
Guest Capacity Insights for Bardonecchia
- The most common guest capacity trend in Bardonecchia vacation rentals is listings accommodating 4 guests (42.1%). This suggests the primary traveler segment is likely small families or groups.
- Properties designed for 4 guests and 6 guests dominate the Bardonecchia STR market, accounting for 62.6% of listings.
- 31.6% of properties accommodate 6+ guests, serving the market segment for larger families or group travel in Bardonecchia.
- On average, properties in Bardonecchia are equipped to host 4.7 guests.
Bardonecchia Airbnb Booking Patterns (2025): Available vs. Booked Days
Available Days Distribution
Booked Days Distribution
Booking Pattern Insights for Bardonecchia
- The most common availability pattern in Bardonecchia falls within the 271-366 days range, representing 70% of listings. This suggests many properties have significant open periods on their calendars.
- Approximately 94.2% of listings show high availability (181+ days open annually), indicating potential for increased bookings or specific owner usage patterns.
- For booked days, the 31-90 days range is most frequent in Bardonecchia (44.2%), reflecting common guest stay durations or potential owner blocking patterns.
- A notable 5.8% of properties secure long booking periods (181+ days booked per year), highlighting successful long-term rental strategies or significant owner usage.
Bardonecchia Airbnb Minimum Stay Requirements Analysis
Distribution of Listings by Minimum Night Requirement
1 Night
14 listings
7.7% of total
2 Nights
48 listings
26.2% of total
3 Nights
12 listings
6.6% of total
4-6 Nights
25 listings
13.7% of total
7-29 Nights
23 listings
12.6% of total
30+ Nights
61 listings
33.3% of total
Key Insights
- The most prevalent minimum stay requirement in Bardonecchia is 30+ Nights, adopted by 33.3% of listings. This highlights the market's preference for longer commitments.
- A significant segment (33.3%) caters to monthly stays (30+ nights) in Bardonecchia, pointing to opportunities in the extended-stay market.
Recommendations
- Align with the market by considering a 30+ Nights minimum stay, as 33.3% of Bardonecchia hosts use this setting.
- If feasible, allowing 1-night stays, especially midweek or during low season, could capture last-minute bookings, as only 7.7% currently do.
- Explore offering discounts for stays of 30+ nights to attract the 33.3% of the market seeking extended stays.
- Adjust minimum nights based on seasonality – potentially shorter during low season and longer during peak demand periods in Bardonecchia.
Bardonecchia Airbnb Cancellation Policy Trends Analysis (2025)
Super Strict 30 Days
11 listings
7.1% of total
Super Strict 60 Days
1 listings
0.6% of total
Flexible
23 listings
14.9% of total
Moderate
77 listings
50% of total
Strict
42 listings
27.3% of total
Cancellation Policy Insights for Bardonecchia
- The prevailing Airbnb cancellation policy trend in Bardonecchia is Moderate, used by 50% of listings.
- There's a relatively balanced mix between guest-friendly (64.9%) and stricter (27.3%) policies, offering choices for different guest needs.
Recommendations for Hosts
- Consider adopting a Moderate policy to align with the 50% market standard in Bardonecchia.
- Regularly review your cancellation policy against competitors and market demand shifts in Bardonecchia.
Bardonecchia STR Booking Lead Time Analysis (2025)
Average Booking Lead Time by Month
Booking Lead Time Insights for Bardonecchia
- The overall average booking lead time for vacation rentals in Bardonecchia is 54 days.
- Guests book furthest in advance for stays during July (average 78 days), likely coinciding with peak travel demand or local events.
- The shortest booking windows occur for stays in September (average 32 days), indicating more last-minute travel plans during this time.
- Seasonally, Summer (69 days avg.) sees the longest lead times, while Fall (47 days avg.) has the shortest, reflecting typical travel planning cycles.
Recommendations for Hosts
- Use the overall average lead time (54 days) as a baseline for your pricing and availability strategy in Bardonecchia.
- For July stays, consider implementing length-of-stay discounts or slightly higher rates for bookings made less than 78 days out to capitalize on advance planning.
- Target marketing efforts for the Summer season well in advance (at least 69 days) to capture early planners.
- Monitor your own booking lead times against these Bardonecchia averages to identify opportunities for dynamic pricing adjustments.
Popular & Essential Airbnb Amenities in Bardonecchia (2025)
Amenity Prevalence
Amenity Insights for Bardonecchia
- Essential amenities in Bardonecchia that guests expect include: Kitchen, TV, Heating. Lacking these (any) could significantly impact bookings.
- Popular amenities like Refrigerator, Essentials, Dishes and silverware are common but not universal. Offering these can provide a competitive edge.
Recommendations for Hosts
- Ensure your listing includes all essential amenities for Bardonecchia: Kitchen, TV, Heating.
- Prioritize adding missing essentials: Kitchen, TV, Heating.
- Consider adding popular differentiators like Refrigerator or Essentials to increase appeal.
- Highlight unique or less common amenities you offer (e.g., hot tub, dedicated workspace, EV charger) in your listing description and photos.
- Regularly check competitor amenities in Bardonecchia to stay competitive.
Bardonecchia Airbnb Guest Demographics & Profile Analysis (2025)
Guest Profile Summary for Bardonecchia
- The typical guest profile for Airbnb in Bardonecchia consists of a mix of domestic (56%) and international guests, often arriving from nearby Turin, typically belonging to the Post-2000s (Gen Z/Alpha) group (50%), primarily speaking English or Italian.
- Domestic travelers account for 56.0% of guests.
- Key international markets include Italy (56%) and United Kingdom (11.6%).
- Top languages spoken are English (36%) followed by Italian (25%).
- A significant demographic segment is the Post-2000s (Gen Z/Alpha) group, representing 50% of guests.
Recommendations for Hosts
- Balance marketing efforts between domestic and international channels based on the guest mix.
- Tailor amenities and listing descriptions to appeal to the dominant Post-2000s (Gen Z/Alpha) demographic (e.g., highlight fast WiFi, smart home features, local guides).
- Highlight unique local experiences or amenities relevant to the primary guest profile.
- Consider seasonal promotions aligned with peak travel times for key origin markets.
Nearby Short-Term Rental Market Comparison
How does the Bardonecchia Airbnb market stack up against its neighbors? Compare key performance metrics like average monthly revenue, ADR, and occupancy rates in surrounding areas to understand the broader regional STR landscape.
| Market | Active Properties | Monthly Revenue | Daily Rate | Avg. Occupancy |
|---|---|---|---|---|
| Lauterbrunnen | 525 | $7,079 | $546.45 | 54% |
| La Rivière-Enverse | 17 | $5,972 | $624.02 | 41% |
| Les Clefs | 30 | $5,741 | $323.11 | 44% |
| Matten bei Interlaken | 52 | $5,674 | $316.63 | 63% |
| Iseltwald | 14 | $5,491 | $331.95 | 58% |
| Habkern | 13 | $5,382 | $344.74 | 50% |
| Interlaken | 288 | $4,987 | $310.52 | 56% |
| Zermatt | 734 | $4,604 | $463.00 | 46% |
| Oberhofen am Thunersee | 24 | $4,572 | $265.94 | 55% |
| Monteu Roero | 16 | $4,432 | $540.14 | 36% |