Avigliana Airbnb Market Analysis 2025: Short Term Rental Data & Vacation Rental Statistics in Piedmont, Italy
Is Airbnb profitable in Avigliana in 2025? Explore comprehensive Airbnb analytics for Avigliana, Piedmont, Italy to uncover income potential. This 2025 STR market report for Avigliana, based on AirROI data from April 2024 to March 2025, reveals key trends in the niche market of 23 active listings.
Whether you're considering an Airbnb investment in Avigliana, optimizing your existing vacation rental, or exploring rental arbitrage opportunities, understanding the Avigliana Airbnb data is crucial. Navigating the high regulation landscape is key to maximizing your short term rental income potential. Let's dive into the specifics.
Key Avigliana Airbnb Performance Metrics Overview
Monthly Airbnb Revenue Variations & Income Potential in Avigliana (2025)
Understanding the monthly revenue variations for Airbnb listings in Avigliana is key to maximizing your short term rental income potential. Seasonality significantly impacts earnings. Our analysis, based on data from the past 12 months, shows that the peak revenue month for STRs in Avigliana is typically July, while February often presents the lowest earnings, highlighting opportunities for strategic pricing adjustments during shoulder and low seasons. Explore the typical Airbnb income in Avigliana across different performance tiers:
- Best-in-class properties (Top 10%) achieve $2,329+ monthly, often utilizing dynamic pricing and superior guest experiences.
- Strong performing properties (Top 25%) earn $1,519 or more, indicating effective management and desirable locations/amenities.
- Typical properties (Median) generate around $926 per month, representing the average market performance.
- Entry-level properties (Bottom 25%) see earnings around $516, often with potential for optimization.
Average Monthly Airbnb Earnings Trend in Avigliana
Avigliana Airbnb Occupancy Rate Trends (2025)
Maximize your bookings by understanding the Avigliana STR occupancy trends. Seasonal demand shifts significantly influence how often properties are booked. Typically, Julysees the highest demand (peak season occupancy), while January experiences the lowest (low season). Effective strategies, like adjusting minimum stays or offering promotions, can boost occupancy during slower periods. Here's how different property tiers perform in Avigliana:
- Best-in-class properties (Top 10%) achieve 75%+ occupancy, indicating high desirability and potentially optimized availability.
- Strong performing properties (Top 25%) maintain 62% or higher occupancy, suggesting good market fit and guest satisfaction.
- Typical properties (Median) have an occupancy rate around 39%.
- Entry-level properties (Bottom 25%) average 21% occupancy, potentially facing higher vacancy.
Average Monthly Occupancy Rate Trend in Avigliana
Average Daily Rate (ADR) Airbnb Trends in Avigliana (2025)
Effective short term rental pricing strategy in Avigliana involves understanding monthly ADR fluctuations. The Average Daily Rate (ADR) for Airbnb in Avigliana typically peaks in March and dips lowest during September. Leveraging Airbnb dynamic pricing tools or strategies based on this seasonality can significantly boost revenue. Here's a look at the typical nightly rates achieved:
- Best-in-class properties (Top 10%) command rates of $139+ per night, often due to premium features or locations.
- Strong performing properties (Top 25%) achieve nightly rates of $104 or more.
- Typical properties (Median) charge around $64 per night.
- Entry-level properties (Bottom 25%) earn around $51 per night.
Average Daily Rate (ADR) Trend by Month in Avigliana
Get Live Avigliana Market Intelligence 👇

Explore Real-time Analytics
Airbnb Seasonality Analysis & Trends in Avigliana (2025)
Peak Season (July, August, May)
- Revenue averages $1,548 per month
- Occupancy rates average 56.0%
- Daily rates average $78
Shoulder Season
- Revenue averages $1,078 per month
- Occupancy maintains around 39.1%
- Daily rates hold near $80
Low Season (January, February, March)
- Revenue drops to average $796 per month
- Occupancy decreases to average 31.5%
- Daily rates adjust to average $83
Seasonality Insights for Avigliana
- The Airbnb seasonality in Avigliana shows highly seasonal trends requiring careful strategy. While the sections above show seasonal averages, it's also insightful to look at the extremes:
- During the high season, the absolute peak month showcases Avigliana's highest earning potential, with monthly revenues capable of climbing to $1,634, occupancy reaching a high of 61.3%, and ADRs peaking at $87.
- Conversely, the slowest single month of the year, typically falling within the low season, marks the market's lowest point. In this month, revenue might dip to $668, occupancy could drop to 29.3%, and ADRs may adjust down to $77.
- Understanding both the seasonal averages and these monthly peaks and troughs in revenue, occupancy, and ADR is crucial for maximizing your Airbnb profit potential in Avigliana.
Seasonal Strategies for Maximizing Profit
- Peak Season: Maximize revenue through premium pricing and potentially longer minimum stays. Ensure high availability.
- Low Season: Offer competitive pricing, special promotions (e.g., extended stay discounts), and flexible cancellation policies. Target off-season travelers like remote workers or budget-conscious guests.
- Shoulder Seasons: Implement dynamic pricing that balances peak and low rates. Target weekend travelers or specific events. Offer slightly more flexible terms than peak season.
- Regularly analyze your own performance against these Avigliana seasonality benchmarks and adjust your pricing and availability strategy accordingly.
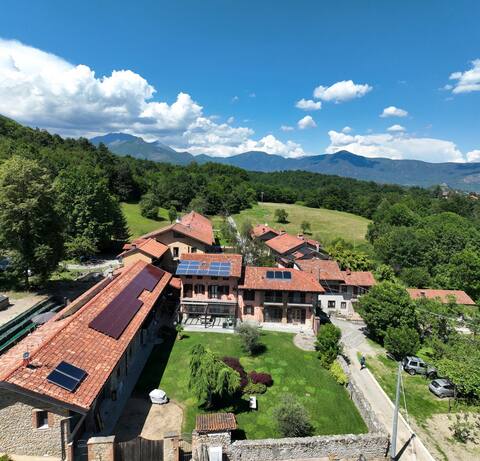
Best Areas for Airbnb Investment in Avigliana (2025)
Exploring the top neighborhoods for short-term rentals in Avigliana? This section highlights key areas, outlining why they are attractive for hosts and guests, along with notable local attractions. Consider these locations based on your target guest profile and investment strategy.
| Neighborhood / Area | Why Host Here? (Target Guests & Appeal) | Key Attractions & Landmarks |
|---|---|---|
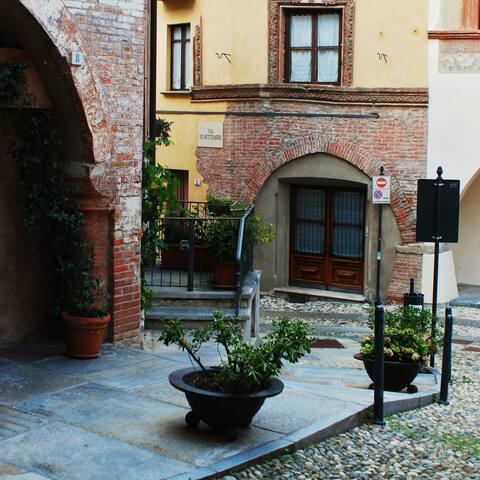
| Centro Storico | The historic center of Avigliana is full of charm with its medieval architecture, cobblestone streets, and local shops. It's an attractive spot for tourists interested in history and culture. | Avigliana Castle, San Giovanni Battista Church, Lake Avigliana, Piazza del Popolo, Museo di Avigliana |
| Parco Naturale dei Laghi di Avigliana | This area offers stunning natural scenery and outdoor activities such as hiking and lake access. It's ideal for nature lovers and those looking to escape the city. | Lakes of Avigliana, hiking trails, bird watching, picnic areas, wildlife |
| Val di Susa | A beautiful valley with a rich history and many outdoor activities. It attracts visitors looking for adventure sports and cultural tourism. | Claviere Ski Resort, Sacra di San Michele, Castello di Fenestrelle, Parco Naturale Complesso del Gran Bosco di Salbertrand, Cultural events in the valley |
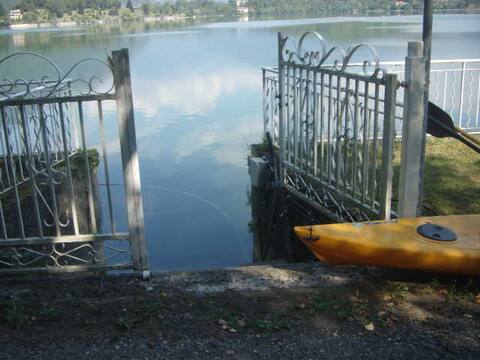
| Avigliana Lakes | Known for its picturesque lakes, this area is perfect for tourists seeking relaxation and water sports, including fishing and kayaking. | Boat rentals, Fishing spots, Picnic areas, Walking trails around the lakes, Photography opportunities |
| Via Torino | A central street with access to shops, restaurants, and bars. This area is a hub for both locals and tourists, making it an ideal investment spot. | Local cafes, Restaurant dining, Shopping opportunities, Accessibility to public transport, Vibrant nightlife |
| Reaglie | A quiet and residential area with local charm. It's suitable for guests seeking a more tranquil experience while still close to city attractions. | Local markets, Parks, Community events, Cultural spaces, Scenic views of the surrounding hills |
| Frazione di Rovere | A quaint district with traditional Italian homes and a local atmosphere. Appeals to those wanting an off-the-beaten-path experience in Avigliana. | Charming streets, Small local restaurants, Community festivals, Nature walks nearby, Views of the surrounding mountains |
| Villaggio dei Laghi | An area influenced by the lakes, providing a holiday-style experience with access to both water and hiking. Popular with families and vacationers. | Water activities, Hiking trails, Family-friendly amenities, Camping sites, Relaxing environments by the water |
Understanding Airbnb License Requirements & STR Laws in Avigliana (2025)
Yes, Avigliana, Piedmont, Italy enforces high STR regulations. Obtaining a license and ensuring compliance is almost certainly required according to current 2025 STR laws. Always verify the latest short term rental regulations and Airbnb license requirements directly with local government authorities for Avigliana to ensure full compliance before hosting.
(Source: AirROI data, 2025, based on 78% licensed listings)
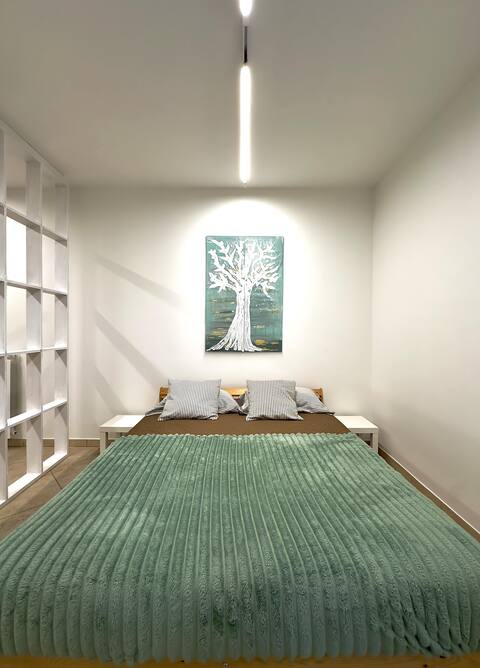
Top Performing Airbnb Properties in Avigliana (2025)
Benchmark your potential! Explore examples of top-performing Airbnb properties in Aviglianabased on Trailing Twelve Month (TTM) revenue. Analyze their characteristics, revenue, occupancy rate, and ADR to understand what drives success in this market.

Cascina Girba - Close to Turin
Entire Place • 4 bedrooms
Il Ciliegio - Cascina Girba
Entire Place • 3 bedrooms
Apartment Antica Quercia
Entire Place • 1 bedroom
The Old Bottega
Entire Place • 1 bedroom

La Terrazza sul Lago
Entire Place • 2 bedrooms
On the lake detached apartment with garden
Entire Place • 1 bedroom
Note: Performance varies based on location, size, amenities, seasonality, and management quality. Data reflects the past 12 months.
Top Performing Airbnb Hosts in Avigliana (2025)
Learn from the best! This table showcases top-performing Airbnb hosts in Avigliana based on the number of properties managed and estimated total revenue over the past year. Analyze their scale and performance metrics.
| Host Name | Properties | Grossing Revenue | Stay Reviews | Avg Rating |
|---|---|---|---|---|
| Mauro | 3 | $57,454 | 104 | 4.97/5.0 |
| Giulia | 2 | $28,082 | 112 | 4.84/5.0 |
| Loretta | 1 | $20,170 | 49 | 4.98/5.0 |
| Marco E Roberta | 1 | $16,018 | 231 | 4.92/5.0 |
| Carlo Maria | 1 | $15,862 | 156 | 4.97/5.0 |
| Emanuela | 1 | $15,100 | 150 | 4.87/5.0 |
| Giorgio | 1 | $13,519 | 405 | 4.97/5.0 |
| Domenico | 1 | $12,666 | 10 | 4.50/5.0 |
| Roberto | 3 | $12,175 | 527 | 4.50/5.0 |
| Alberto | 1 | $12,113 | 11 | 4.91/5.0 |
Analyzing the strategies of top hosts, such as their property selection, pricing, and guest communication, can offer valuable lessons for optimizing your own Airbnb operations in Avigliana.
Dive Deeper: Advanced Avigliana STR Market Data (2025)
Ready to unlock more insights? AirROI provides access to advanced metrics and comprehensive Airbnb data for Avigliana. Explore detailed analytics beyond this report to refine your investment strategy, optimize pricing, and maximize your vacation rental profits.
Explore Advanced MetricsAvigliana Short-Term Rental Market Composition (2025): Property & Room Types
Room Type Distribution
Property Type Distribution
Market Composition Insights for Avigliana
- The Avigliana Airbnb market composition is heavily skewed towards Entire Home/Apt listings, which make up 91.3% of the 23 active rentals. This indicates strong guest preference for privacy and space.
- Looking at the property type distribution in Avigliana, Apartment/Condo properties are the most common (47.8%), reflecting the local real estate landscape.
- Houses represent a significant 39.1% portion, catering likely to families or larger groups.
- Smaller segments like hotel/boutique, unique stays, others (combined 12.9%) offer potential for unique stay experiences.
Avigliana Airbnb Room Capacity Analysis (2025): Bedroom Distribution
Distribution of Listings by Number of Bedrooms
Room Capacity Insights for Avigliana
- The dominant room capacity in Avigliana is 1 bedroom listings, making up 47.8% of the market. This suggests a strong demand for properties suitable for couples or solo travelers.
- Together, 1 bedroom and 2 bedrooms properties represent 78.2% of the active Airbnb listings in Avigliana, indicating a high concentration in these sizes.
- Listings with 3+ bedrooms (8.6%) represent a smaller niche, potentially indicating an underserved market for larger group accommodations in Avigliana.
Avigliana Vacation Rental Guest Capacity Trends (2025)
Distribution of Listings by Guest Capacity
Guest Capacity Insights for Avigliana
- The most common guest capacity trend in Avigliana vacation rentals is listings accommodating 2 guests (26.1%). This suggests the primary traveler segment is likely couples or solo travelers.
- Properties designed for 2 guests and 4 guests dominate the Avigliana STR market, accounting for 47.8% of listings.
- 17.4% of properties accommodate 6+ guests, serving the market segment for larger families or group travel in Avigliana.
- On average, properties in Avigliana are equipped to host 3.7 guests.
Avigliana Airbnb Booking Patterns (2025): Available vs. Booked Days
Available Days Distribution
Booked Days Distribution
Booking Pattern Insights for Avigliana
- The most common availability pattern in Avigliana falls within the 271-366 days range, representing 39.1% of listings. This suggests many properties have significant open periods on their calendars.
- Approximately 69.5% of listings show high availability (181+ days open annually), indicating potential for increased bookings or specific owner usage patterns.
- For booked days, the 91-180 days range is most frequent in Avigliana (34.8%), reflecting common guest stay durations or potential owner blocking patterns.
- A notable 30.4% of properties secure long booking periods (181+ days booked per year), highlighting successful long-term rental strategies or significant owner usage.
Avigliana Airbnb Minimum Stay Requirements Analysis
Distribution of Listings by Minimum Night Requirement
1 Night
14 listings
63.6% of total
2 Nights
5 listings
22.7% of total
3 Nights
2 listings
9.1% of total
30+ Nights
1 listings
4.5% of total
Key Insights
- The most prevalent minimum stay requirement in Avigliana is 1 Night, adopted by 63.6% of listings. This highlights the market's preference for shorter, flexible bookings.
- A strong majority (86.3%) of the Avigliana Airbnb data shows acceptance of very short stays (1-2 nights), indicating a dynamic, high-turnover market.
Recommendations
- Align with the market by considering a 1 Night minimum stay, as 63.6% of Avigliana hosts use this setting.
- Adjust minimum nights based on seasonality – potentially shorter during low season and longer during peak demand periods in Avigliana.
Avigliana Airbnb Cancellation Policy Trends Analysis (2025)
Flexible
15 listings
65.2% of total
Moderate
8 listings
34.8% of total
Cancellation Policy Insights for Avigliana
- The prevailing Airbnb cancellation policy trend in Avigliana is Flexible, used by 65.2% of listings.
- The market strongly favors guest-friendly terms, with 100.0% of listings offering Flexible or Moderate policies. This suggests guests in Avigliana may expect booking flexibility.
Recommendations for Hosts
- Consider adopting a Flexible policy to align with the 65.2% market standard in Avigliana.
- Given the high prevalence of Flexible policies (65.2%), offering this can enhance booking appeal, especially during shoulder seasons.
- Regularly review your cancellation policy against competitors and market demand shifts in Avigliana.
Avigliana STR Booking Lead Time Analysis (2025)
Average Booking Lead Time by Month
Booking Lead Time Insights for Avigliana
- The overall average booking lead time for vacation rentals in Avigliana is 45 days.
- Guests book furthest in advance for stays during July (average 77 days), likely coinciding with peak travel demand or local events.
- The shortest booking windows occur for stays in February (average 19 days), indicating more last-minute travel plans during this time.
- Seasonally, Summer (64 days avg.) sees the longest lead times, while Winter (27 days avg.) has the shortest, reflecting typical travel planning cycles.
Recommendations for Hosts
- Use the overall average lead time (45 days) as a baseline for your pricing and availability strategy in Avigliana.
- For July stays, consider implementing length-of-stay discounts or slightly higher rates for bookings made less than 77 days out to capitalize on advance planning.
- Target marketing efforts for the Summer season well in advance (at least 64 days) to capture early planners.
- Monitor your own booking lead times against these Avigliana averages to identify opportunities for dynamic pricing adjustments.
Popular & Essential Airbnb Amenities in Avigliana (2025)
Amenity Prevalence
Amenity Insights for Avigliana
- Essential amenities in Avigliana that guests expect include: Heating, Essentials. Lacking these (any) could significantly impact bookings.
- Popular amenities like Hair dryer, Kitchen, Wifi are common but not universal. Offering these can provide a competitive edge.
- Warning: Wifi is not universally provided but is considered essential globally. Ensure reliable Wifi is offered.
Recommendations for Hosts
- Ensure your listing includes all essential amenities for Avigliana: Heating, Essentials.
- Prioritize adding missing essentials: Essentials.
- Consider adding popular differentiators like Hair dryer or Kitchen to increase appeal.
- Highlight unique or less common amenities you offer (e.g., hot tub, dedicated workspace, EV charger) in your listing description and photos.
- Regularly check competitor amenities in Avigliana to stay competitive.
Avigliana Airbnb Guest Demographics & Profile Analysis (2025)
Guest Profile Summary for Avigliana
- The typical guest profile for Airbnb in Avigliana consists of predominantly international visitors (79%), with top international origins including Italy, typically belonging to the Post-2000s (Gen Z/Alpha) group (50%), primarily speaking English or French.
- Domestic travelers account for 21.1% of guests.
- Key international markets include France (43.3%) and Italy (21.1%).
- Top languages spoken are English (34.8%) followed by French (25.1%).
- A significant demographic segment is the Post-2000s (Gen Z/Alpha) group, representing 50% of guests.
Recommendations for Hosts
- Focus marketing internationally, particularly towards travelers from Italy.
- Tailor amenities and listing descriptions to appeal to the dominant Post-2000s (Gen Z/Alpha) demographic (e.g., highlight fast WiFi, smart home features, local guides).
- Highlight unique local experiences or amenities relevant to the primary guest profile.
- Consider seasonal promotions aligned with peak travel times for key origin markets.
Nearby Short-Term Rental Market Comparison
How does the Avigliana Airbnb market stack up against its neighbors? Compare key performance metrics like average monthly revenue, ADR, and occupancy rates in surrounding areas to understand the broader regional STR landscape.
| Market | Active Properties | Monthly Revenue | Daily Rate | Avg. Occupancy |
|---|---|---|---|---|
| Lauterbrunnen | 525 | $7,079 | $546.45 | 54% |
| La Rivière-Enverse | 17 | $5,972 | $624.02 | 41% |
| Les Clefs | 30 | $5,741 | $323.11 | 44% |
| Matten bei Interlaken | 52 | $5,674 | $316.63 | 63% |
| Iseltwald | 14 | $5,491 | $331.95 | 58% |
| Habkern | 13 | $5,382 | $344.74 | 50% |
| Interlaken | 288 | $4,987 | $310.52 | 56% |
| Grindelwald | 489 | $4,921 | $345.40 | 57% |
| Zermatt | 734 | $4,604 | $463.00 | 46% |
| Oberhofen am Thunersee | 24 | $4,572 | $265.94 | 55% |