Termoli Airbnb Market Analysis 2025: Short Term Rental Data & Vacation Rental Statistics in Molise, Italy
Is Airbnb profitable in Termoli in 2025? Explore comprehensive Airbnb analytics for Termoli, Molise, Italy to uncover income potential. This 2025 STR market report for Termoli, based on AirROI data from April 2024 to March 2025, reveals key trends in the market of 225 active listings.
Whether you're considering an Airbnb investment in Termoli, optimizing your existing vacation rental, or exploring rental arbitrage opportunities, understanding the Termoli Airbnb data is crucial. Understanding the local regulations is key to maximizing your short term rental income potential. Let's dive into the specifics.
Key Termoli Airbnb Performance Metrics Overview
Monthly Airbnb Revenue Variations & Income Potential in Termoli (2025)
Understanding the monthly revenue variations for Airbnb listings in Termoli is key to maximizing your short term rental income potential. Seasonality significantly impacts earnings. Our analysis, based on data from the past 12 months, shows that the peak revenue month for STRs in Termoli is typically August, while February often presents the lowest earnings, highlighting opportunities for strategic pricing adjustments during shoulder and low seasons. Explore the typical Airbnb income in Termoli across different performance tiers:
- Best-in-class properties (Top 10%) achieve $2,738+ monthly, often utilizing dynamic pricing and superior guest experiences.
- Strong performing properties (Top 25%) earn $1,751 or more, indicating effective management and desirable locations/amenities.
- Typical properties (Median) generate around $920 per month, representing the average market performance.
- Entry-level properties (Bottom 25%) see earnings around $401, often with potential for optimization.
Average Monthly Airbnb Earnings Trend in Termoli
Termoli Airbnb Occupancy Rate Trends (2025)
Maximize your bookings by understanding the Termoli STR occupancy trends. Seasonal demand shifts significantly influence how often properties are booked. Typically, Augustsees the highest demand (peak season occupancy), while December experiences the lowest (low season). Effective strategies, like adjusting minimum stays or offering promotions, can boost occupancy during slower periods. Here's how different property tiers perform in Termoli:
- Best-in-class properties (Top 10%) achieve 66%+ occupancy, indicating high desirability and potentially optimized availability.
- Strong performing properties (Top 25%) maintain 47% or higher occupancy, suggesting good market fit and guest satisfaction.
- Typical properties (Median) have an occupancy rate around 26%.
- Entry-level properties (Bottom 25%) average 11% occupancy, potentially facing higher vacancy.
Average Monthly Occupancy Rate Trend in Termoli
Average Daily Rate (ADR) Airbnb Trends in Termoli (2025)
Effective short term rental pricing strategy in Termoli involves understanding monthly ADR fluctuations. The Average Daily Rate (ADR) for Airbnb in Termoli typically peaks in August and dips lowest during November. Leveraging Airbnb dynamic pricing tools or strategies based on this seasonality can significantly boost revenue. Here's a look at the typical nightly rates achieved:
- Best-in-class properties (Top 10%) command rates of $196+ per night, often due to premium features or locations.
- Strong performing properties (Top 25%) achieve nightly rates of $143 or more.
- Typical properties (Median) charge around $105 per night.
- Entry-level properties (Bottom 25%) earn around $77 per night.
Average Daily Rate (ADR) Trend by Month in Termoli
Get Live Termoli Market Intelligence 👇

Explore Real-time Analytics
Airbnb Seasonality Analysis & Trends in Termoli (2025)
Peak Season (August, July, June)
- Revenue averages $2,141 per month
- Occupancy rates average 43.2%
- Daily rates average $137
Shoulder Season
- Revenue averages $1,092 per month
- Occupancy maintains around 27.7%
- Daily rates hold near $121
Low Season (January, February, March)
- Revenue drops to average $624 per month
- Occupancy decreases to average 26.2%
- Daily rates adjust to average $131
Seasonality Insights for Termoli
- The Airbnb seasonality in Termoli shows highly seasonal trends requiring careful strategy. While the sections above show seasonal averages, it's also insightful to look at the extremes:
- During the high season, the absolute peak month showcases Termoli's highest earning potential, with monthly revenues capable of climbing to $2,498, occupancy reaching a high of 53.7%, and ADRs peaking at $141.
- Conversely, the slowest single month of the year, typically falling within the low season, marks the market's lowest point. In this month, revenue might dip to $524, occupancy could drop to 23.6%, and ADRs may adjust down to $113.
- Understanding both the seasonal averages and these monthly peaks and troughs in revenue, occupancy, and ADR is crucial for maximizing your Airbnb profit potential in Termoli.
Seasonal Strategies for Maximizing Profit
- Peak Season: Maximize revenue through premium pricing and potentially longer minimum stays. Ensure high availability.
- Low Season: Offer competitive pricing, special promotions (e.g., extended stay discounts), and flexible cancellation policies. Target off-season travelers like remote workers or budget-conscious guests.
- Shoulder Seasons: Implement dynamic pricing that balances peak and low rates. Target weekend travelers or specific events. Offer slightly more flexible terms than peak season.
- Regularly analyze your own performance against these Termoli seasonality benchmarks and adjust your pricing and availability strategy accordingly.
Best Areas for Airbnb Investment in Termoli (2025)
Exploring the top neighborhoods for short-term rentals in Termoli? This section highlights key areas, outlining why they are attractive for hosts and guests, along with notable local attractions. Consider these locations based on your target guest profile and investment strategy.
| Neighborhood / Area | Why Host Here? (Target Guests & Appeal) | Key Attractions & Landmarks |
|---|---|---|
| Centro Storico | The historic center of Termoli, known for its charming streets, ancient castle, and beautiful seafront. A prime location for tourists who want to explore the local culture and history. | Castello Svevo, Termoli Cathedral, Piazza Sant'Antonio, Lungomare Cristoforo Colombo, Beaches of Termoli |
| Lido Volturno | A popular beach area with lively summer activities. Attracts families and young people looking for beach fun and summer vacations. | Lido Volturno Beach, Beach clubs, Restaurants and bars on the beach, Water sports activities |
| Moliterno | A scenic area just outside Termoli, known for its natural beauty and rural charm. Ideal for travelers seeking tranquility and nature. | Hiking trails, Local vineyards, Agriturismo experiences, Scenic views of the countryside |
| Via G. Marconi | A bustling street in Termoli filled with shops, cafes, and local life. Great for guests who enjoy being in the heart of the action. | Local shops, Cafes and gelaterias, Street markets, Artisan boutiques |
| Termoli Marina | The marina area offers beautiful waterfront views and is the starting point for boat trips. Attractive for those interested in marine activities and seafood. | Fishing trips, Boat excursions, Restaurants with fresh seafood, Scenic marina views |
| Colonia Marina | A family-friendly beach area with activities for children and relaxing spots for parents. Perfect for family vacations. | Family-friendly beaches, Playgrounds, Pizzerias and local eateries, Water activities for kids |
| San Giacomo | An emerging area with new development and good access to both town and beach, appealing to long-term renters and investment. | Modern residential developments, Proximity to amenities, Access to public transport |
| Contrada Sant'Onofrio | A quieter residential neighborhood, ideal for long-term rentals and those wanting to live like a local. Offers good value for money. | Local farm stands, Community life, Peaceful surroundings, Nature walks |
Understanding Airbnb License Requirements & STR Laws in Termoli (2025)
With 24% of listings showing registration in 2025, understanding potential Airbnb license requirements is crucial in Termoli. Always verify the latest short term rental regulations and Airbnb license requirements directly with local government authorities for Termoli to ensure full compliance before hosting.
(Source: AirROI data, 2025, based on 24% licensed listings)
Top Performing Airbnb Properties in Termoli (2025)
Benchmark your potential! Explore examples of top-performing Airbnb properties in Termolibased on Trailing Twelve Month (TTM) revenue. Analyze their characteristics, revenue, occupancy rate, and ADR to understand what drives success in this market.
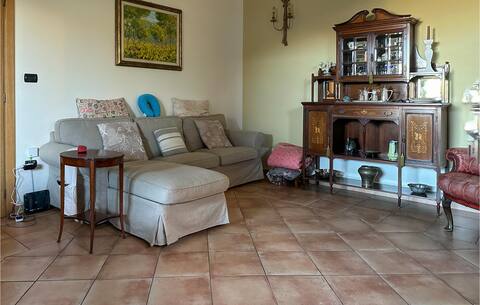
5 bedroom nice home in Termoli
Entire Place • 5 bedrooms
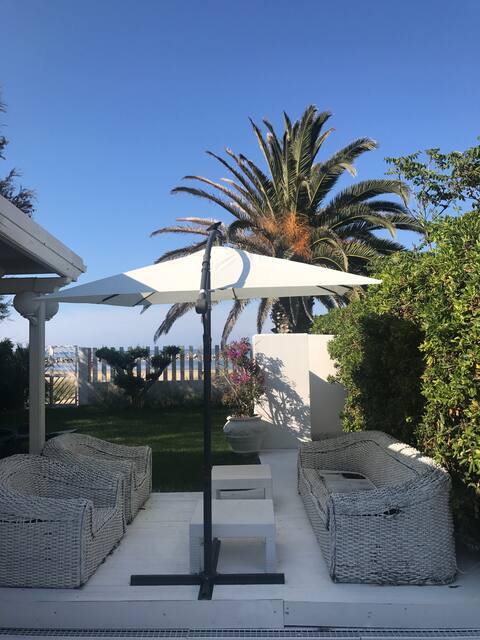
Villa with pool and direct access to the sea
Entire Place • 3 bedrooms
Rivazzurra Homes - 19
Entire Place • 2 bedrooms

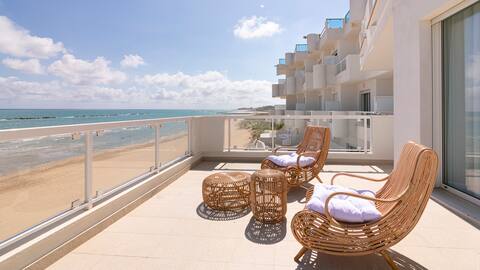
Beautiful beach villa in Termoli
Entire Place • 1 bedroom

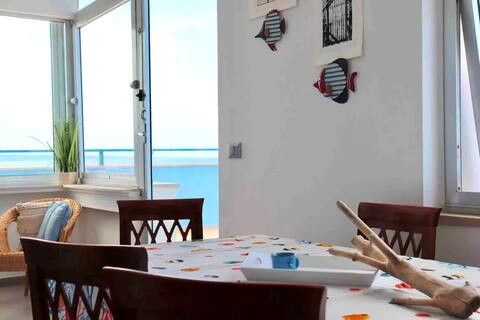
house on the wall with sea view
Entire Place • 2 bedrooms
On sunset
Entire Place • 2 bedrooms
Note: Performance varies based on location, size, amenities, seasonality, and management quality. Data reflects the past 12 months.
Top Performing Airbnb Hosts in Termoli (2025)
Learn from the best! This table showcases top-performing Airbnb hosts in Termoli based on the number of properties managed and estimated total revenue over the past year. Analyze their scale and performance metrics.
| Host Name | Properties | Grossing Revenue | Stay Reviews | Avg Rating |
|---|---|---|---|---|
| Rivazzurra | 20 | $202,446 | 99 | 3.82/5.0 |
| Tommaso | 5 | $67,011 | 28 | 2.87/5.0 |
| ITALYHOUSE Maria | 7 | $48,710 | 25 | 1.34/5.0 |
| Host #137510682 | 1 | $43,872 | 0 | 0.00/5.0 |
| Federico | 1 | $42,774 | 13 | 4.77/5.0 |
| Giulia | 2 | $40,174 | 20 | 5.00/5.0 |
| Marisa | 4 | $32,941 | 239 | 4.80/5.0 |
| Domenico | 2 | $32,444 | 39 | 4.97/5.0 |
| Antonio | 1 | $29,673 | 22 | 4.95/5.0 |
| Adriana | 1 | $28,888 | 12 | 4.92/5.0 |
Analyzing the strategies of top hosts, such as their property selection, pricing, and guest communication, can offer valuable lessons for optimizing your own Airbnb operations in Termoli.
Dive Deeper: Advanced Termoli STR Market Data (2025)
Ready to unlock more insights? AirROI provides access to advanced metrics and comprehensive Airbnb data for Termoli. Explore detailed analytics beyond this report to refine your investment strategy, optimize pricing, and maximize your vacation rental profits.
Explore Advanced MetricsTermoli Short-Term Rental Market Composition (2025): Property & Room Types
Room Type Distribution
Property Type Distribution
Market Composition Insights for Termoli
- The Termoli Airbnb market composition is heavily skewed towards Entire Home/Apt listings, which make up 86.7% of the 225 active rentals. This indicates strong guest preference for privacy and space.
- Looking at the property type distribution in Termoli, Apartment/Condo properties are the most common (64.4%), reflecting the local real estate landscape.
- Houses represent a significant 26.7% portion, catering likely to families or larger groups.
- The presence of 8% Hotel/Boutique listings indicates integration with traditional hospitality.
- Smaller segments like unique stays (combined 0.9%) offer potential for unique stay experiences.
Termoli Airbnb Room Capacity Analysis (2025): Bedroom Distribution
Distribution of Listings by Number of Bedrooms
Room Capacity Insights for Termoli
- The dominant room capacity in Termoli is 1 bedroom listings, making up 47.6% of the market. This suggests a strong demand for properties suitable for couples or solo travelers.
- Together, 1 bedroom and 2 bedrooms properties represent 82.3% of the active Airbnb listings in Termoli, indicating a high concentration in these sizes.
Termoli Vacation Rental Guest Capacity Trends (2025)
Distribution of Listings by Guest Capacity
Guest Capacity Insights for Termoli
- The most common guest capacity trend in Termoli vacation rentals is listings accommodating 4 guests (42.2%). This suggests the primary traveler segment is likely small families or groups.
- Properties designed for 4 guests and 6 guests dominate the Termoli STR market, accounting for 56.9% of listings.
- 20.5% of properties accommodate 6+ guests, serving the market segment for larger families or group travel in Termoli.
- On average, properties in Termoli are equipped to host 4.0 guests.
Termoli Airbnb Booking Patterns (2025): Available vs. Booked Days
Available Days Distribution
Booked Days Distribution
Booking Pattern Insights for Termoli
- The most common availability pattern in Termoli falls within the 271-366 days range, representing 76% of listings. This suggests many properties have significant open periods on their calendars.
- Approximately 94.7% of listings show high availability (181+ days open annually), indicating potential for increased bookings or specific owner usage patterns.
- For booked days, the 31-90 days range is most frequent in Termoli (37.3%), reflecting common guest stay durations or potential owner blocking patterns.
- A notable 6.2% of properties secure long booking periods (181+ days booked per year), highlighting successful long-term rental strategies or significant owner usage.
Termoli Airbnb Minimum Stay Requirements Analysis
Distribution of Listings by Minimum Night Requirement
1 Night
43 listings
21% of total
2 Nights
48 listings
23.4% of total
3 Nights
13 listings
6.3% of total
4-6 Nights
24 listings
11.7% of total
7-29 Nights
63 listings
30.7% of total
30+ Nights
14 listings
6.8% of total
Key Insights
- The most prevalent minimum stay requirement in Termoli is 7-29 Nights, adopted by 30.7% of listings. This highlights the market's preference for shorter, flexible bookings.
Recommendations
- Align with the market by considering a 7-29 Nights minimum stay, as 30.7% of Termoli hosts use this setting.
- If feasible, allowing 1-night stays, especially midweek or during low season, could capture last-minute bookings, as only 21% currently do.
- Explore offering discounts for stays of 30+ nights to attract the 6.8% of the market seeking extended stays.
- Adjust minimum nights based on seasonality – potentially shorter during low season and longer during peak demand periods in Termoli.
Termoli Airbnb Cancellation Policy Trends Analysis (2025)
Flexible
40 listings
26.7% of total
Moderate
61 listings
40.7% of total
Strict
49 listings
32.7% of total
Cancellation Policy Insights for Termoli
- The prevailing Airbnb cancellation policy trend in Termoli is Moderate, used by 40.7% of listings.
- There's a relatively balanced mix between guest-friendly (67.4%) and stricter (32.7%) policies, offering choices for different guest needs.
Recommendations for Hosts
- Consider adopting a Moderate policy to align with the 40.7% market standard in Termoli.
- With 32.7% using Strict terms, this is a viable option in Termoli, particularly for high-value properties or during peak demand periods.
- Regularly review your cancellation policy against competitors and market demand shifts in Termoli.
Termoli STR Booking Lead Time Analysis (2025)
Average Booking Lead Time by Month
Booking Lead Time Insights for Termoli
- The overall average booking lead time for vacation rentals in Termoli is 48 days.
- Guests book furthest in advance for stays during May (average 72 days), likely coinciding with peak travel demand or local events.
- The shortest booking windows occur for stays in December (average 31 days), indicating more last-minute travel plans during this time.
- Seasonally, Summer (68 days avg.) sees the longest lead times, while Winter (48 days avg.) has the shortest, reflecting typical travel planning cycles.
Recommendations for Hosts
- Use the overall average lead time (48 days) as a baseline for your pricing and availability strategy in Termoli.
- For May stays, consider implementing length-of-stay discounts or slightly higher rates for bookings made less than 72 days out to capitalize on advance planning.
- Target marketing efforts for the Summer season well in advance (at least 68 days) to capture early planners.
- Monitor your own booking lead times against these Termoli averages to identify opportunities for dynamic pricing adjustments.
Popular & Essential Airbnb Amenities in Termoli (2025)
Amenity Prevalence
Amenity Insights for Termoli
- Essential amenities in Termoli that guests expect include: TV. Lacking these (this) could significantly impact bookings.
- Popular amenities like Kitchen, Heating, Hot water are common but not universal. Offering these can provide a competitive edge.
- Warning: Wifi is not universally provided but is considered essential globally. Ensure reliable Wifi is offered.
Recommendations for Hosts
- Ensure your listing includes all essential amenities for Termoli: TV.
- Prioritize adding missing essentials: TV.
- Consider adding popular differentiators like Kitchen or Heating to increase appeal.
- Highlight unique or less common amenities you offer (e.g., hot tub, dedicated workspace, EV charger) in your listing description and photos.
- Regularly check competitor amenities in Termoli to stay competitive.
Termoli Airbnb Guest Demographics & Profile Analysis (2025)
Guest Profile Summary for Termoli
- The typical guest profile for Airbnb in Termoli consists of a mix of domestic (53%) and international guests, often arriving from nearby Rome, typically belonging to the Post-2000s (Gen Z/Alpha) group (50%), primarily speaking English or Italian.
- Domestic travelers account for 52.6% of guests.
- Key international markets include Italy (52.6%) and United States (8.1%).
- Top languages spoken are English (34.3%) followed by Italian (26.7%).
- A significant demographic segment is the Post-2000s (Gen Z/Alpha) group, representing 50% of guests.
Recommendations for Hosts
- Balance marketing efforts between domestic and international channels based on the guest mix.
- Tailor amenities and listing descriptions to appeal to the dominant Post-2000s (Gen Z/Alpha) demographic (e.g., highlight fast WiFi, smart home features, local guides).
- Highlight unique local experiences or amenities relevant to the primary guest profile.
- Consider seasonal promotions aligned with peak travel times for key origin markets.
Nearby Short-Term Rental Market Comparison
How does the Termoli Airbnb market stack up against its neighbors? Compare key performance metrics like average monthly revenue, ADR, and occupancy rates in surrounding areas to understand the broader regional STR landscape.
| Market | Active Properties | Monthly Revenue | Daily Rate | Avg. Occupancy |
|---|---|---|---|---|
| Kakma | 21 | $1,757 | $293.72 | 41% |
| Corridonia | 11 | $1,619 | $191.19 | 33% |
| Općina Tisno | 12 | $1,592 | $667.27 | 32% |
| San Costanzo | 22 | $1,539 | $187.71 | 36% |
| Primošten Burnji | 39 | $1,489 | $306.99 | 42% |
| Cingoli | 20 | $1,469 | $273.08 | 33% |
| Ostra | 15 | $1,414 | $175.09 | 34% |
| Caiazzo | 34 | $1,302 | $176.78 | 27% |
| Montegranaro | 10 | $1,301 | $216.69 | 31% |
| Mogliano | 23 | $1,283 | $183.76 | 37% |