Isernia Airbnb Market Analysis 2025: Short Term Rental Data & Vacation Rental Statistics in Molise, Italy
Is Airbnb profitable in Isernia in 2025? Explore comprehensive Airbnb analytics for Isernia, Molise, Italy to uncover income potential. This 2025 STR market report for Isernia, based on AirROI data from April 2024 to March 2025, reveals key trends in the niche market of 20 active listings.
Whether you're considering an Airbnb investment in Isernia, optimizing your existing vacation rental, or exploring rental arbitrage opportunities, understanding the Isernia Airbnb data is crucial. Navigating the high regulation landscape is key to maximizing your short term rental income potential. Let's dive into the specifics.
Key Isernia Airbnb Performance Metrics Overview
Monthly Airbnb Revenue Variations & Income Potential in Isernia (2025)
Understanding the monthly revenue variations for Airbnb listings in Isernia is key to maximizing your short term rental income potential. Seasonality significantly impacts earnings. Our analysis, based on data from the past 12 months, shows that the peak revenue month for STRs in Isernia is typically April, while November often presents the lowest earnings, highlighting opportunities for strategic pricing adjustments during shoulder and low seasons. Explore the typical Airbnb income in Isernia across different performance tiers:
- Best-in-class properties (Top 10%) achieve $1,985+ monthly, often utilizing dynamic pricing and superior guest experiences.
- Strong performing properties (Top 25%) earn $1,248 or more, indicating effective management and desirable locations/amenities.
- Typical properties (Median) generate around $633 per month, representing the average market performance.
- Entry-level properties (Bottom 25%) see earnings around $337, often with potential for optimization.
Average Monthly Airbnb Earnings Trend in Isernia
Isernia Airbnb Occupancy Rate Trends (2025)
Maximize your bookings by understanding the Isernia STR occupancy trends. Seasonal demand shifts significantly influence how often properties are booked. Typically, Augustsees the highest demand (peak season occupancy), while January experiences the lowest (low season). Effective strategies, like adjusting minimum stays or offering promotions, can boost occupancy during slower periods. Here's how different property tiers perform in Isernia:
- Best-in-class properties (Top 10%) achieve 60%+ occupancy, indicating high desirability and potentially optimized availability.
- Strong performing properties (Top 25%) maintain 39% or higher occupancy, suggesting good market fit and guest satisfaction.
- Typical properties (Median) have an occupancy rate around 22%.
- Entry-level properties (Bottom 25%) average 12% occupancy, potentially facing higher vacancy.
Average Monthly Occupancy Rate Trend in Isernia
Average Daily Rate (ADR) Airbnb Trends in Isernia (2025)
Effective short term rental pricing strategy in Isernia involves understanding monthly ADR fluctuations. The Average Daily Rate (ADR) for Airbnb in Isernia typically peaks in November and dips lowest during February. Leveraging Airbnb dynamic pricing tools or strategies based on this seasonality can significantly boost revenue. Here's a look at the typical nightly rates achieved:
- Best-in-class properties (Top 10%) command rates of $181+ per night, often due to premium features or locations.
- Strong performing properties (Top 25%) achieve nightly rates of $114 or more.
- Typical properties (Median) charge around $78 per night.
- Entry-level properties (Bottom 25%) earn around $64 per night.
Average Daily Rate (ADR) Trend by Month in Isernia
Get Live Isernia Market Intelligence 👇

Explore Real-time Analytics
Airbnb Seasonality Analysis & Trends in Isernia (2025)
Peak Season (April, May, August)
- Revenue averages $1,356 per month
- Occupancy rates average 33.2%
- Daily rates average $96
Shoulder Season
- Revenue averages $838 per month
- Occupancy maintains around 28.3%
- Daily rates hold near $98
Low Season (January, March, November)
- Revenue drops to average $566 per month
- Occupancy decreases to average 22.2%
- Daily rates adjust to average $99
Seasonality Insights for Isernia
- The Airbnb seasonality in Isernia shows highly seasonal trends requiring careful strategy. While the sections above show seasonal averages, it's also insightful to look at the extremes:
- During the high season, the absolute peak month showcases Isernia's highest earning potential, with monthly revenues capable of climbing to $1,526, occupancy reaching a high of 40.5%, and ADRs peaking at $104.
- Conversely, the slowest single month of the year, typically falling within the low season, marks the market's lowest point. In this month, revenue might dip to $542, occupancy could drop to 20.1%, and ADRs may adjust down to $94.
- Understanding both the seasonal averages and these monthly peaks and troughs in revenue, occupancy, and ADR is crucial for maximizing your Airbnb profit potential in Isernia.
Seasonal Strategies for Maximizing Profit
- Peak Season: Maximize revenue through premium pricing and potentially longer minimum stays. Ensure high availability.
- Low Season: Offer competitive pricing, special promotions (e.g., extended stay discounts), and flexible cancellation policies. Target off-season travelers like remote workers or budget-conscious guests.
- Shoulder Seasons: Implement dynamic pricing that balances peak and low rates. Target weekend travelers or specific events. Offer slightly more flexible terms than peak season.
- Regularly analyze your own performance against these Isernia seasonality benchmarks and adjust your pricing and availability strategy accordingly.
Best Areas for Airbnb Investment in Isernia (2025)
Exploring the top neighborhoods for short-term rentals in Isernia? This section highlights key areas, outlining why they are attractive for hosts and guests, along with notable local attractions. Consider these locations based on your target guest profile and investment strategy.
| Neighborhood / Area | Why Host Here? (Target Guests & Appeal) | Key Attractions & Landmarks |
|---|---|---|
| Centro Storico | The historic center of Isernia offers charming cobblestone streets and ancient architecture, making it a picturesque location for tourists who want to explore the city's rich history and culture. | Piazza Santa Maria Assunta, Museo Nazionale del Paleolitico, Palazzo San Francesco, Chiesa di San Pietro, Cattedrale di Isernia |
| Parco della Rimembranza | This scenic park in Isernia provides a lovely natural setting for visitors who enjoy outdoor activities and tranquil environments. It's an ideal spot for families and nature lovers. | Walking trails, Picnic areas, Views of Isernia, Children's playground, Flower gardens |
| Via XX Settembre | A bustling street full of shops, cafes, and local restaurants, perfect for tourists who want to experience the local Italian lifestyle and cuisine. | Shops and boutiques, Local eateries, Cafes, Street performers, Cultural events |
| Castello Monforte | A historical castle offering breathtaking views of the city and surrounding landscapes. It's a must-visit for history buffs and photographers. | Castello Monforte, Scenic viewpoints, Historical exhibitions, Nature walks around the castle |
| Piazza Galasso | A lively square that serves as a social hub for locals and tourists alike. Great for experiencing local events and the vibrant community atmosphere. | Local events, Cafes and bars, Street markets, Art performances |
| Rione San Francesco | A quaint neighborhood known for its local charm and traditional Italian houses. It offers a unique look at local life and culture. | Historic architecture, Local artisan shops, Traditional restaurants, Local festivals |
| Area Archeologica di Isernia | The archaeological area showcasing ancient ruins attracts history enthusiasts and tourists interested in Roman history and archaeology. | Ruins of ancient Isernia, Guided tours, Historical significance, Educational exhibitions |
| Parco Archeologico | A park dedicated to archaeological findings in the area, suitable for families and visitors looking to learn more about the ancient history of Isernia. | Archaeological sites, Nature trails, Educational programs, Picnic spots |
Understanding Airbnb License Requirements & STR Laws in Isernia (2025)
Yes, Isernia, Molise, Italy enforces high STR regulations. Obtaining a license and ensuring compliance is almost certainly required according to current 2025 STR laws. Always verify the latest short term rental regulations and Airbnb license requirements directly with local government authorities for Isernia to ensure full compliance before hosting.
(Source: AirROI data, 2025, based on 50% licensed listings)
Top Performing Airbnb Properties in Isernia (2025)
Benchmark your potential! Explore examples of top-performing Airbnb properties in Iserniabased on Trailing Twelve Month (TTM) revenue. Analyze their characteristics, revenue, occupancy rate, and ADR to understand what drives success in this market.
(Art of Living) Exclusive 130 SQM
Entire Place • 3 bedrooms

Ilpostonascosto - Mini Spa
Entire Place • 1 bedroom

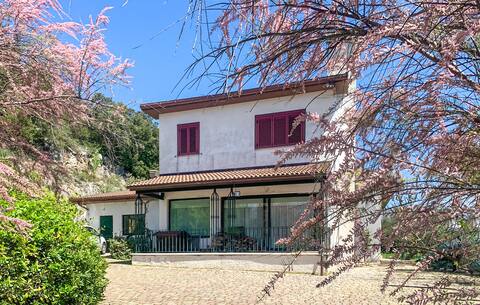
The Hill of Olives
Entire Place • 2 bedrooms
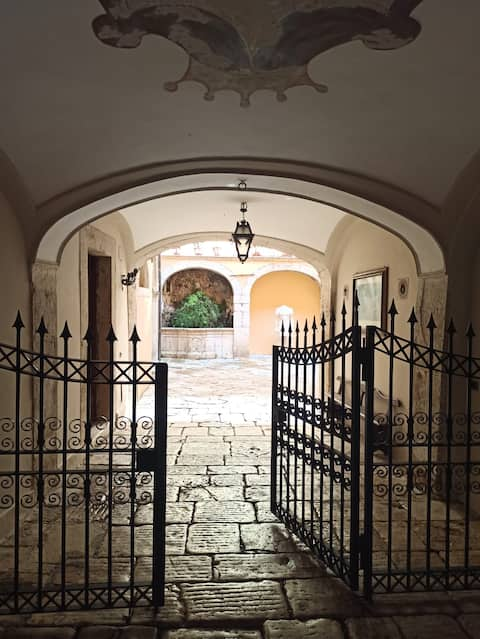
Rooms in the old courtyard
Private Room • 2 bedrooms
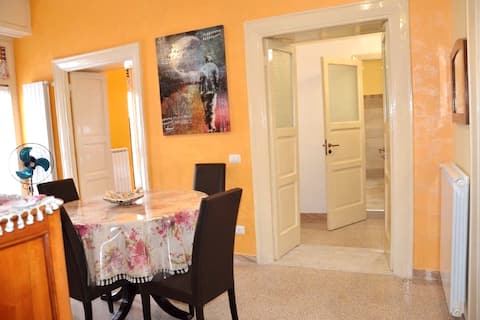
Beautiful home in Isernia with Wi-Fi
Entire Place • 3 bedrooms
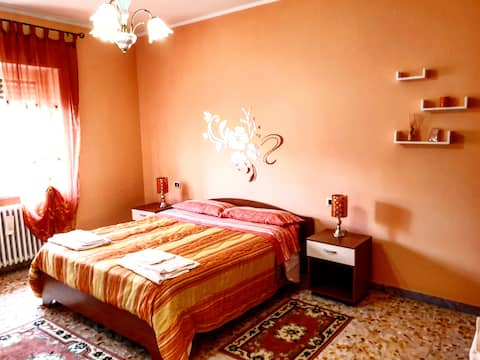
Camera Estate - Central Isernia
Private Room • 1 bedroom
Note: Performance varies based on location, size, amenities, seasonality, and management quality. Data reflects the past 12 months.
Top Performing Airbnb Hosts in Isernia (2025)
Learn from the best! This table showcases top-performing Airbnb hosts in Isernia based on the number of properties managed and estimated total revenue over the past year. Analyze their scale and performance metrics.
| Host Name | Properties | Grossing Revenue | Stay Reviews | Avg Rating |
|---|---|---|---|---|
| Host #447744904 | 1 | $19,874 | 33 | 5.00/5.0 |
| Giovanni | 1 | $17,358 | 10 | 4.90/5.0 |
| Pietro | 1 | $17,258 | 9 | 4.67/5.0 |
| Ludovico | 2 | $15,719 | 16 | 4.67/5.0 |
| Paola | 1 | $12,019 | 44 | 4.89/5.0 |
| Host #153918632 | 1 | $11,547 | 0 | 0.00/5.0 |
| Jose | 2 | $10,540 | 125 | 4.52/5.0 |
| Paola | 2 | $9,215 | 5 | 2.50/5.0 |
| Host #250656551 | 2 | $7,127 | 2 | 0.00/5.0 |
| Diana | 1 | $7,055 | 44 | 4.91/5.0 |
Analyzing the strategies of top hosts, such as their property selection, pricing, and guest communication, can offer valuable lessons for optimizing your own Airbnb operations in Isernia.
Dive Deeper: Advanced Isernia STR Market Data (2025)
Ready to unlock more insights? AirROI provides access to advanced metrics and comprehensive Airbnb data for Isernia. Explore detailed analytics beyond this report to refine your investment strategy, optimize pricing, and maximize your vacation rental profits.
Explore Advanced MetricsIsernia Short-Term Rental Market Composition (2025): Property & Room Types
Room Type Distribution
Property Type Distribution
Market Composition Insights for Isernia
- The Isernia Airbnb market composition is heavily skewed towards Entire Home/Apt listings, which make up 70% of the 20 active rentals. This indicates strong guest preference for privacy and space.
- Looking at the property type distribution in Isernia, Apartment/Condo properties are the most common (45%), reflecting the local real estate landscape.
- Houses represent a significant 30% portion, catering likely to families or larger groups.
- The presence of 20% Hotel/Boutique listings indicates integration with traditional hospitality.
Isernia Airbnb Room Capacity Analysis (2025): Bedroom Distribution
Distribution of Listings by Number of Bedrooms
Room Capacity Insights for Isernia
- The dominant room capacity in Isernia is 1 bedroom listings, making up 35% of the market. This suggests a strong demand for properties suitable for couples or solo travelers.
- Together, 1 bedroom and 2 bedrooms properties represent 70.0% of the active Airbnb listings in Isernia, indicating a high concentration in these sizes.
- A significant 25.0% of listings offer 3+ bedrooms, catering to larger groups and families seeking more space in Isernia.
Isernia Vacation Rental Guest Capacity Trends (2025)
Distribution of Listings by Guest Capacity
Guest Capacity Insights for Isernia
- The most common guest capacity trend in Isernia vacation rentals is listings accommodating 4 guests (30%). This suggests the primary traveler segment is likely small families or groups.
- Properties designed for 4 guests and 2 guests dominate the Isernia STR market, accounting for 50.0% of listings.
- 25.0% of properties accommodate 6+ guests, serving the market segment for larger families or group travel in Isernia.
- On average, properties in Isernia are equipped to host 4.2 guests.
Isernia Airbnb Booking Patterns (2025): Available vs. Booked Days
Available Days Distribution
Booked Days Distribution
Booking Pattern Insights for Isernia
- The most common availability pattern in Isernia falls within the 271-366 days range, representing 65% of listings. This suggests many properties have significant open periods on their calendars.
- Approximately 90.0% of listings show high availability (181+ days open annually), indicating potential for increased bookings or specific owner usage patterns.
- For booked days, the 31-90 days range is most frequent in Isernia (35%), reflecting common guest stay durations or potential owner blocking patterns.
- A notable 10.0% of properties secure long booking periods (181+ days booked per year), highlighting successful long-term rental strategies or significant owner usage.
Isernia Airbnb Minimum Stay Requirements Analysis
Distribution of Listings by Minimum Night Requirement
1 Night
11 listings
64.7% of total
2 Nights
4 listings
23.5% of total
7-29 Nights
2 listings
11.8% of total
Key Insights
- The most prevalent minimum stay requirement in Isernia is 1 Night, adopted by 64.7% of listings. This highlights the market's preference for shorter, flexible bookings.
- A strong majority (88.2%) of the Isernia Airbnb data shows acceptance of very short stays (1-2 nights), indicating a dynamic, high-turnover market.
Recommendations
- Align with the market by considering a 1 Night minimum stay, as 64.7% of Isernia hosts use this setting.
- Adjust minimum nights based on seasonality – potentially shorter during low season and longer during peak demand periods in Isernia.
Isernia Airbnb Cancellation Policy Trends Analysis (2025)
Flexible
4 listings
28.6% of total
Moderate
8 listings
57.1% of total
Strict
2 listings
14.3% of total
Cancellation Policy Insights for Isernia
- The prevailing Airbnb cancellation policy trend in Isernia is Moderate, used by 57.1% of listings.
- The market strongly favors guest-friendly terms, with 85.7% of listings offering Flexible or Moderate policies. This suggests guests in Isernia may expect booking flexibility.
Recommendations for Hosts
- Consider adopting a Moderate policy to align with the 57.1% market standard in Isernia.
- Using a Strict policy might deter some guests, as only 14.3% of listings use it. Evaluate if potential revenue protection outweighs possible lower booking rates.
- Regularly review your cancellation policy against competitors and market demand shifts in Isernia.
Isernia STR Booking Lead Time Analysis (2025)
Average Booking Lead Time by Month
Booking Lead Time Insights for Isernia
- The overall average booking lead time for vacation rentals in Isernia is 34 days.
- Guests book furthest in advance for stays during October (average 46 days), likely coinciding with peak travel demand or local events.
- The shortest booking windows occur for stays in May (average 12 days), indicating more last-minute travel plans during this time.
- Seasonally, Fall (40 days avg.) sees the longest lead times, while Summer (21 days avg.) has the shortest, reflecting typical travel planning cycles.
Recommendations for Hosts
- Use the overall average lead time (34 days) as a baseline for your pricing and availability strategy in Isernia.
- For October stays, consider implementing length-of-stay discounts or slightly higher rates for bookings made less than 46 days out to capitalize on advance planning.
- During May, focus on last-minute booking availability and promotions, as guests book with very short notice (12 days avg.).
- Target marketing efforts for the Fall season well in advance (at least 40 days) to capture early planners.
- Monitor your own booking lead times against these Isernia averages to identify opportunities for dynamic pricing adjustments.
Popular & Essential Airbnb Amenities in Isernia (2025)
Amenity Prevalence
Amenity Insights for Isernia
- Essential amenities in Isernia that guests expect include: TV, Essentials, Heating, Wifi. Lacking these (any) could significantly impact bookings.
- Popular amenities like Hangers, Hair dryer, Hot water are common but not universal. Offering these can provide a competitive edge.
Recommendations for Hosts
- Ensure your listing includes all essential amenities for Isernia: TV, Essentials, Heating, Wifi.
- Prioritize adding missing essentials: Heating, Wifi.
- Consider adding popular differentiators like Hangers or Hair dryer to increase appeal.
- Highlight unique or less common amenities you offer (e.g., hot tub, dedicated workspace, EV charger) in your listing description and photos.
- Regularly check competitor amenities in Isernia to stay competitive.
Isernia Airbnb Guest Demographics & Profile Analysis (2025)
Guest Profile Summary for Isernia
- The typical guest profile for Airbnb in Isernia consists of primarily domestic travelers (72%), often arriving from nearby Rome, typically belonging to the Post-2000s (Gen Z/Alpha) group (50%), primarily speaking English or Italian.
- Domestic travelers account for 71.8% of guests.
- Key international markets include Italy (71.8%) and United States (14.1%).
- Top languages spoken are English (36.7%) followed by Italian (30.6%).
- A significant demographic segment is the Post-2000s (Gen Z/Alpha) group, representing 50% of guests.
Recommendations for Hosts
- Target domestic marketing efforts towards travelers from Rome and Milan.
- Tailor amenities and listing descriptions to appeal to the dominant Post-2000s (Gen Z/Alpha) demographic (e.g., highlight fast WiFi, smart home features, local guides).
- Highlight unique local experiences or amenities relevant to the primary guest profile.
- Consider seasonal promotions aligned with peak travel times for key origin markets.
Nearby Short-Term Rental Market Comparison
How does the Isernia Airbnb market stack up against its neighbors? Compare key performance metrics like average monthly revenue, ADR, and occupancy rates in surrounding areas to understand the broader regional STR landscape.
| Market | Active Properties | Monthly Revenue | Daily Rate | Avg. Occupancy |
|---|---|---|---|---|
| Positano | 683 | $6,671 | $624.23 | 53% |
| Praiano | 331 | $4,415 | $403.56 | 55% |
| Conca dei Marini | 112 | $4,308 | $395.84 | 53% |
| Capri | 423 | $3,942 | $586.54 | 41% |
| Sorrento | 1,475 | $3,702 | $325.69 | 50% |
| Amalfi | 463 | $3,284 | $317.75 | 48% |
| Massa Lubrense | 832 | $3,255 | $413.33 | 45% |
| Ravello | 261 | $3,201 | $317.16 | 47% |
| Furore | 141 | $3,098 | $340.51 | 51% |
| Atrani | 129 | $2,687 | $212.49 | 54% |