San Ginesio Airbnb Market Analysis 2025: Short Term Rental Data & Vacation Rental Statistics in Marche, Italy
Is Airbnb profitable in San Ginesio in 2025? Explore comprehensive Airbnb analytics for San Ginesio, Marche, Italy to uncover income potential. This 2025 STR market report for San Ginesio, based on AirROI data from April 2024 to March 2025, reveals key trends in the niche market of 22 active listings.
Whether you're considering an Airbnb investment in San Ginesio, optimizing your existing vacation rental, or exploring rental arbitrage opportunities, understanding the San Ginesio Airbnb data is crucial. Navigating the high regulation landscape is key to maximizing your short term rental income potential. Let's dive into the specifics.
Key San Ginesio Airbnb Performance Metrics Overview
Monthly Airbnb Revenue Variations & Income Potential in San Ginesio (2025)
Understanding the monthly revenue variations for Airbnb listings in San Ginesio is key to maximizing your short term rental income potential. Seasonality significantly impacts earnings. Our analysis, based on data from the past 12 months, shows that the peak revenue month for STRs in San Ginesio is typically August, while February often presents the lowest earnings, highlighting opportunities for strategic pricing adjustments during shoulder and low seasons. Explore the typical Airbnb income in San Ginesio across different performance tiers:
- Best-in-class properties (Top 10%) achieve $2,455+ monthly, often utilizing dynamic pricing and superior guest experiences.
- Strong performing properties (Top 25%) earn $1,202 or more, indicating effective management and desirable locations/amenities.
- Typical properties (Median) generate around $760 per month, representing the average market performance.
- Entry-level properties (Bottom 25%) see earnings around $437, often with potential for optimization.
Average Monthly Airbnb Earnings Trend in San Ginesio
San Ginesio Airbnb Occupancy Rate Trends (2025)
Maximize your bookings by understanding the San Ginesio STR occupancy trends. Seasonal demand shifts significantly influence how often properties are booked. Typically, Augustsees the highest demand (peak season occupancy), while November experiences the lowest (low season). Effective strategies, like adjusting minimum stays or offering promotions, can boost occupancy during slower periods. Here's how different property tiers perform in San Ginesio:
- Best-in-class properties (Top 10%) achieve 42%+ occupancy, indicating high desirability and potentially optimized availability.
- Strong performing properties (Top 25%) maintain 28% or higher occupancy, suggesting good market fit and guest satisfaction.
- Typical properties (Median) have an occupancy rate around 20%.
- Entry-level properties (Bottom 25%) average 8% occupancy, potentially facing higher vacancy.
Average Monthly Occupancy Rate Trend in San Ginesio
Average Daily Rate (ADR) Airbnb Trends in San Ginesio (2025)
Effective short term rental pricing strategy in San Ginesio involves understanding monthly ADR fluctuations. The Average Daily Rate (ADR) for Airbnb in San Ginesio typically peaks in August and dips lowest during October. Leveraging Airbnb dynamic pricing tools or strategies based on this seasonality can significantly boost revenue. Here's a look at the typical nightly rates achieved:
- Best-in-class properties (Top 10%) command rates of $340+ per night, often due to premium features or locations.
- Strong performing properties (Top 25%) achieve nightly rates of $208 or more.
- Typical properties (Median) charge around $110 per night.
- Entry-level properties (Bottom 25%) earn around $87 per night.
Average Daily Rate (ADR) Trend by Month in San Ginesio
Get Live San Ginesio Market Intelligence 👇

Explore Real-time Analytics
Airbnb Seasonality Analysis & Trends in San Ginesio (2025)
Peak Season (August, July, September)
- Revenue averages $2,422 per month
- Occupancy rates average 46.3%
- Daily rates average $169
Shoulder Season
- Revenue averages $765 per month
- Occupancy maintains around 16.7%
- Daily rates hold near $161
Low Season (February, April, November)
- Revenue drops to average $284 per month
- Occupancy decreases to average 7.5%
- Daily rates adjust to average $158
Seasonality Insights for San Ginesio
- The Airbnb seasonality in San Ginesio shows highly seasonal trends requiring careful strategy. While the sections above show seasonal averages, it's also insightful to look at the extremes:
- During the high season, the absolute peak month showcases San Ginesio's highest earning potential, with monthly revenues capable of climbing to $3,066, occupancy reaching a high of 52.0%, and ADRs peaking at $173.
- Conversely, the slowest single month of the year, typically falling within the low season, marks the market's lowest point. In this month, revenue might dip to $245, occupancy could drop to 5.6%, and ADRs may adjust down to $155.
- Understanding both the seasonal averages and these monthly peaks and troughs in revenue, occupancy, and ADR is crucial for maximizing your Airbnb profit potential in San Ginesio.
Seasonal Strategies for Maximizing Profit
- Peak Season: Maximize revenue through premium pricing and potentially longer minimum stays. Ensure high availability.
- Low Season: Offer competitive pricing, special promotions (e.g., extended stay discounts), and flexible cancellation policies. Target off-season travelers like remote workers or budget-conscious guests.
- Shoulder Seasons: Implement dynamic pricing that balances peak and low rates. Target weekend travelers or specific events. Offer slightly more flexible terms than peak season.
- Regularly analyze your own performance against these San Ginesio seasonality benchmarks and adjust your pricing and availability strategy accordingly.
Best Areas for Airbnb Investment in San Ginesio (2025)
Exploring the top neighborhoods for short-term rentals in San Ginesio? This section highlights key areas, outlining why they are attractive for hosts and guests, along with notable local attractions. Consider these locations based on your target guest profile and investment strategy.
| Neighborhood / Area | Why Host Here? (Target Guests & Appeal) | Key Attractions & Landmarks |
|---|---|---|
| Historic Center | The heart of San Ginesio, rich in medieval architecture and history. Ideal for guests looking to explore the cultural heritage and enjoy panoramic views of the countryside. | Piazza della Repubblica, San Ginesio Cathedral, Museo del Palazzo, Porta del Borgo, Romanesque churches |
| Surrounding Hills | Scenic areas surrounding the town, perfect for nature lovers and outdoor activities. Attracts visitors seeking tranquility and beautiful landscapes. | Hiking trails, Biking routes, Wine tasting tours, Olive groves, Nature reserves |
| Local Vineyards | The area is known for its wine production and picturesque vineyards. Engaging for guests interested in wine tourism and local cuisine. | Vineyard tours, Wine tasting events, Agriturismo experiences |
| Cultural Events Venues | Location near venues for local festivals and cultural events, attracting visitors during peak seasons for traditional celebrations. | Local festivals, Art exhibitions, Concerts, Food markets |
| Outdoor Activities | Close proximity to outdoor recreation areas, appealing to active travelers and groups seeking adventure sports. | Canoeing, Kayaking, Horseback riding, Rock climbing |
| Local Markets | Area filled with local markets and artisan products, enticing foodies and those interested in local craftsmanship. | Food markets, Craft fairs, Culinary tours |
| Religious Sites | San Ginesio is home to significant religious buildings, attracting pilgrims and tourists interested in spiritual experiences. | Church of Santa Maria, San Felice in Villa, Historic chapels |
| Nearby Towns | Access to charming nearby towns and villages that offer additional sightseeing and local flavor, enhancing the stay experience. | Visso, Sarnano, Amandola |
Understanding Airbnb License Requirements & STR Laws in San Ginesio (2025)
Yes, San Ginesio, Marche, Italy enforces high STR regulations. Obtaining a license and ensuring compliance is almost certainly required according to current 2025 STR laws. Always verify the latest short term rental regulations and Airbnb license requirements directly with local government authorities for San Ginesio to ensure full compliance before hosting.
(Source: AirROI data, 2025, based on 36% licensed listings)
Top Performing Airbnb Properties in San Ginesio (2025)
Benchmark your potential! Explore examples of top-performing Airbnb properties in San Ginesiobased on Trailing Twelve Month (TTM) revenue. Analyze their characteristics, revenue, occupancy rate, and ADR to understand what drives success in this market.
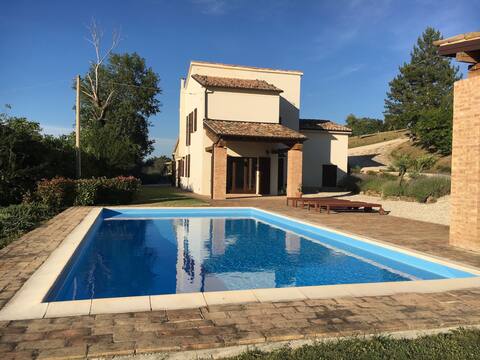
Villa with outdoor kitchen and amazing views
Entire Place • 3 bedrooms

Luxury Villa with Pool, Stunning Location
Entire Place • 5 bedrooms
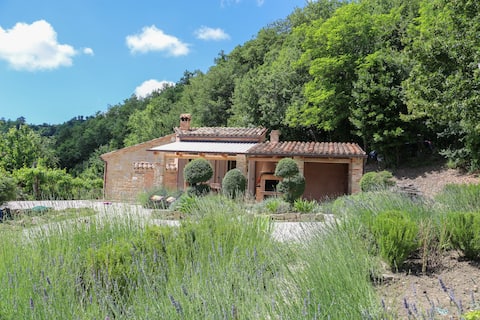
Stunning Le Marche private villa & pool sleeps 4.
Entire Place • 2 bedrooms
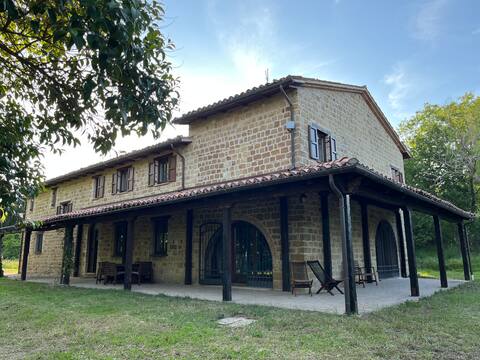
luxury private villa, large pool & secure garden
Entire Place • 4 bedrooms

Est Locanda, relax within the medieval walls
Entire Place • 2 bedrooms
![Luxury home [ SPA privata ]](https://a0.muscache.com/im/pictures/hosting/Hosting-1118608688074700521/original/eac5a147-3ffa-4eea-8f63-08df8dec0c67.jpeg?im_w=480&im_format=avif)
Luxury home [ SPA privata ]
Entire Place • 2 bedrooms
Note: Performance varies based on location, size, amenities, seasonality, and management quality. Data reflects the past 12 months.
Top Performing Airbnb Hosts in San Ginesio (2025)
Learn from the best! This table showcases top-performing Airbnb hosts in San Ginesio based on the number of properties managed and estimated total revenue over the past year. Analyze their scale and performance metrics.
| Host Name | Properties | Grossing Revenue | Stay Reviews | Avg Rating |
|---|---|---|---|---|
| Daniela | 1 | $33,631 | 6 | 5.00/5.0 |
| Micaela E Roberto | 3 | $23,518 | 18 | 4.86/5.0 |
| Nigel | 1 | $21,891 | 6 | 4.83/5.0 |
| Vanessa | 3 | $16,143 | 5 | 1.50/5.0 |
| John | 2 | $13,234 | 14 | 4.79/5.0 |
| Louise | 1 | $11,987 | 12 | 4.83/5.0 |
| John | 1 | $11,836 | 6 | 4.33/5.0 |
| Valentina | 1 | $11,026 | 24 | 5.00/5.0 |
| Host #477957315 | 1 | $10,404 | 1 | 0.00/5.0 |
| Host #97493858 | 1 | $9,534 | 0 | 0.00/5.0 |
Analyzing the strategies of top hosts, such as their property selection, pricing, and guest communication, can offer valuable lessons for optimizing your own Airbnb operations in San Ginesio.
Dive Deeper: Advanced San Ginesio STR Market Data (2025)
Ready to unlock more insights? AirROI provides access to advanced metrics and comprehensive Airbnb data for San Ginesio. Explore detailed analytics beyond this report to refine your investment strategy, optimize pricing, and maximize your vacation rental profits.
Explore Advanced MetricsSan Ginesio Short-Term Rental Market Composition (2025): Property & Room Types
Room Type Distribution
Property Type Distribution
Market Composition Insights for San Ginesio
- The San Ginesio Airbnb market composition is heavily skewed towards Entire Home/Apt listings, which make up 86.4% of the 22 active rentals. This indicates strong guest preference for privacy and space.
- Looking at the property type distribution in San Ginesio, House properties are the most common (45.5%), reflecting the local real estate landscape.
- Houses represent a significant 45.5% portion, catering likely to families or larger groups.
- The presence of 9.1% Hotel/Boutique listings indicates integration with traditional hospitality.
San Ginesio Airbnb Room Capacity Analysis (2025): Bedroom Distribution
Distribution of Listings by Number of Bedrooms
Room Capacity Insights for San Ginesio
- The dominant room capacity in San Ginesio is 2 bedrooms listings, making up 50% of the market. This suggests a strong demand for properties suitable for couples or solo travelers.
- Together, 2 bedrooms and 1 bedroom properties represent 68.2% of the active Airbnb listings in San Ginesio, indicating a high concentration in these sizes.
- A significant 27.2% of listings offer 3+ bedrooms, catering to larger groups and families seeking more space in San Ginesio.
San Ginesio Vacation Rental Guest Capacity Trends (2025)
Distribution of Listings by Guest Capacity
Guest Capacity Insights for San Ginesio
- The most common guest capacity trend in San Ginesio vacation rentals is listings accommodating 4 guests (31.8%). This suggests the primary traveler segment is likely small families or groups.
- Properties designed for 4 guests and 6 guests dominate the San Ginesio STR market, accounting for 59.1% of listings.
- 45.4% of properties accommodate 6+ guests, serving the market segment for larger families or group travel in San Ginesio.
- On average, properties in San Ginesio are equipped to host 4.6 guests.
San Ginesio Airbnb Booking Patterns (2025): Available vs. Booked Days
Available Days Distribution
Booked Days Distribution
Booking Pattern Insights for San Ginesio
- The most common availability pattern in San Ginesio falls within the 271-366 days range, representing 90.9% of listings. This suggests many properties have significant open periods on their calendars.
- Approximately 100.0% of listings show high availability (181+ days open annually), indicating potential for increased bookings or specific owner usage patterns.
- For booked days, the 31-90 days range is most frequent in San Ginesio (50%), reflecting common guest stay durations or potential owner blocking patterns.
San Ginesio Airbnb Minimum Stay Requirements Analysis
Distribution of Listings by Minimum Night Requirement
1 Night
2 listings
9.5% of total
2 Nights
4 listings
19% of total
3 Nights
5 listings
23.8% of total
4-6 Nights
2 listings
9.5% of total
7-29 Nights
8 listings
38.1% of total
Key Insights
- The most prevalent minimum stay requirement in San Ginesio is 7-29 Nights, adopted by 38.1% of listings. This highlights the market's preference for shorter, flexible bookings.
Recommendations
- Align with the market by considering a 7-29 Nights minimum stay, as 38.1% of San Ginesio hosts use this setting.
- If feasible, allowing 1-night stays, especially midweek or during low season, could capture last-minute bookings, as only 9.5% currently do.
- Adjust minimum nights based on seasonality – potentially shorter during low season and longer during peak demand periods in San Ginesio.
San Ginesio Airbnb Cancellation Policy Trends Analysis (2025)
Flexible
4 listings
23.5% of total
Moderate
2 listings
11.8% of total
Strict
11 listings
64.7% of total
Cancellation Policy Insights for San Ginesio
- The prevailing Airbnb cancellation policy trend in San Ginesio is Strict, used by 64.7% of listings.
- A majority (64.7%) of hosts in San Ginesio utilize Firm or Strict policies, indicating a market where hosts prioritize booking security.
Recommendations for Hosts
- Consider adopting a Strict policy to align with the 64.7% market standard in San Ginesio.
- With 64.7% using Strict terms, this is a viable option in San Ginesio, particularly for high-value properties or during peak demand periods.
- Regularly review your cancellation policy against competitors and market demand shifts in San Ginesio.
San Ginesio STR Booking Lead Time Analysis (2025)
Average Booking Lead Time by Month
Booking Lead Time Insights for San Ginesio
- The overall average booking lead time for vacation rentals in San Ginesio is 55 days.
- Guests book furthest in advance for stays during June (average 114 days), likely coinciding with peak travel demand or local events.
- The shortest booking windows occur for stays in February (average 6 days), indicating more last-minute travel plans during this time.
- Seasonally, Summer (87 days avg.) sees the longest lead times, while Winter (16 days avg.) has the shortest, reflecting typical travel planning cycles.
Recommendations for Hosts
- Use the overall average lead time (55 days) as a baseline for your pricing and availability strategy in San Ginesio.
- For June stays, consider implementing length-of-stay discounts or slightly higher rates for bookings made less than 114 days out to capitalize on advance planning.
- During February, focus on last-minute booking availability and promotions, as guests book with very short notice (6 days avg.).
- Target marketing efforts for the Summer season well in advance (at least 87 days) to capture early planners.
- Monitor your own booking lead times against these San Ginesio averages to identify opportunities for dynamic pricing adjustments.
Popular & Essential Airbnb Amenities in San Ginesio (2025)
Amenity Prevalence
Amenity Insights for San Ginesio
- Essential amenities in San Ginesio that guests expect include: TV, Essentials, Free parking on premises, Heating, Wifi. Lacking these (any) could significantly impact bookings.
- Popular amenities like Kitchen, Hot water, Hair dryer are common but not universal. Offering these can provide a competitive edge.
Recommendations for Hosts
- Ensure your listing includes all essential amenities for San Ginesio: TV, Essentials, Free parking on premises, Heating, Wifi.
- Prioritize adding missing essentials: Free parking on premises, Heating, Wifi.
- Consider adding popular differentiators like Kitchen or Hot water to increase appeal.
- Highlight unique or less common amenities you offer (e.g., hot tub, dedicated workspace, EV charger) in your listing description and photos.
- Regularly check competitor amenities in San Ginesio to stay competitive.
San Ginesio Airbnb Guest Demographics & Profile Analysis (2025)
Guest Profile Summary for San Ginesio
- The typical guest profile for Airbnb in San Ginesio consists of a mix of domestic (49%) and international guests, with top international origins including United Kingdom, typically belonging to the Post-2000s (Gen Z/Alpha) group (50%), primarily speaking English or Italian.
- Domestic travelers account for 48.6% of guests.
- Key international markets include Italy (48.6%) and United Kingdom (17.1%).
- Top languages spoken are English (37.2%) followed by Italian (23.3%).
- A significant demographic segment is the Post-2000s (Gen Z/Alpha) group, representing 50% of guests.
Recommendations for Hosts
- Balance marketing efforts between domestic and international channels based on the guest mix.
- Tailor amenities and listing descriptions to appeal to the dominant Post-2000s (Gen Z/Alpha) demographic (e.g., highlight fast WiFi, smart home features, local guides).
- Highlight unique local experiences or amenities relevant to the primary guest profile.
- Consider seasonal promotions aligned with peak travel times for key origin markets.
Nearby Short-Term Rental Market Comparison
How does the San Ginesio Airbnb market stack up against its neighbors? Compare key performance metrics like average monthly revenue, ADR, and occupancy rates in surrounding areas to understand the broader regional STR landscape.
| Market | Active Properties | Monthly Revenue | Daily Rate | Avg. Occupancy |
|---|---|---|---|---|
| Collazzone | 28 | $2,839 | $341.11 | 36% |
| Parrano | 18 | $2,762 | $329.95 | 34% |
| Monte Castello di Vibio | 18 | $2,659 | $567.21 | 41% |
| Guardea | 15 | $2,542 | $320.56 | 35% |
| Monteleone d'Orvieto | 31 | $2,537 | $306.96 | 36% |
| Lugnano in Teverina | 19 | $2,238 | $267.38 | 35% |
| Collevecchio | 12 | $2,213 | $302.16 | 38% |
| Lisciano Niccone | 30 | $2,175 | $384.66 | 35% |
| Palombara Sabina | 16 | $2,160 | $336.01 | 35% |
| Deruta | 15 | $2,127 | $232.83 | 37% |