San Benedetto del Tronto Airbnb Market Analysis 2025: Short Term Rental Data & Vacation Rental Statistics in Marche, Italy
Is Airbnb profitable in San Benedetto del Tronto in 2025? Explore comprehensive Airbnb analytics for San Benedetto del Tronto, Marche, Italy to uncover income potential. This 2025 STR market report for San Benedetto del Tronto, based on AirROI data from April 2024 to March 2025, reveals key trends in the market of 291 active listings.
Whether you're considering an Airbnb investment in San Benedetto del Tronto, optimizing your existing vacation rental, or exploring rental arbitrage opportunities, understanding the San Benedetto del Tronto Airbnb data is crucial. Navigating the high regulation landscape is key to maximizing your short term rental income potential. Let's dive into the specifics.
Key San Benedetto del Tronto Airbnb Performance Metrics Overview
Monthly Airbnb Revenue Variations & Income Potential in San Benedetto del Tronto (2025)
Understanding the monthly revenue variations for Airbnb listings in San Benedetto del Tronto is key to maximizing your short term rental income potential. Seasonality significantly impacts earnings. Our analysis, based on data from the past 12 months, shows that the peak revenue month for STRs in San Benedetto del Tronto is typically August, while December often presents the lowest earnings, highlighting opportunities for strategic pricing adjustments during shoulder and low seasons. Explore the typical Airbnb income in San Benedetto del Tronto across different performance tiers:
- Best-in-class properties (Top 10%) achieve $2,361+ monthly, often utilizing dynamic pricing and superior guest experiences.
- Strong performing properties (Top 25%) earn $1,520 or more, indicating effective management and desirable locations/amenities.
- Typical properties (Median) generate around $877 per month, representing the average market performance.
- Entry-level properties (Bottom 25%) see earnings around $401, often with potential for optimization.
Average Monthly Airbnb Earnings Trend in San Benedetto del Tronto
San Benedetto del Tronto Airbnb Occupancy Rate Trends (2025)
Maximize your bookings by understanding the San Benedetto del Tronto STR occupancy trends. Seasonal demand shifts significantly influence how often properties are booked. Typically, Augustsees the highest demand (peak season occupancy), while January experiences the lowest (low season). Effective strategies, like adjusting minimum stays or offering promotions, can boost occupancy during slower periods. Here's how different property tiers perform in San Benedetto del Tronto:
- Best-in-class properties (Top 10%) achieve 63%+ occupancy, indicating high desirability and potentially optimized availability.
- Strong performing properties (Top 25%) maintain 46% or higher occupancy, suggesting good market fit and guest satisfaction.
- Typical properties (Median) have an occupancy rate around 27%.
- Entry-level properties (Bottom 25%) average 13% occupancy, potentially facing higher vacancy.
Average Monthly Occupancy Rate Trend in San Benedetto del Tronto
Average Daily Rate (ADR) Airbnb Trends in San Benedetto del Tronto (2025)
Effective short term rental pricing strategy in San Benedetto del Tronto involves understanding monthly ADR fluctuations. The Average Daily Rate (ADR) for Airbnb in San Benedetto del Tronto typically peaks in August and dips lowest during March. Leveraging Airbnb dynamic pricing tools or strategies based on this seasonality can significantly boost revenue. Here's a look at the typical nightly rates achieved:
- Best-in-class properties (Top 10%) command rates of $179+ per night, often due to premium features or locations.
- Strong performing properties (Top 25%) achieve nightly rates of $128 or more.
- Typical properties (Median) charge around $97 per night.
- Entry-level properties (Bottom 25%) earn around $75 per night.
Average Daily Rate (ADR) Trend by Month in San Benedetto del Tronto
Get Live San Benedetto del Tronto Market Intelligence 👇

Explore Real-time Analytics
Airbnb Seasonality Analysis & Trends in San Benedetto del Tronto (2025)
Peak Season (August, July, June)
- Revenue averages $2,004 per month
- Occupancy rates average 45.4%
- Daily rates average $130
Shoulder Season
- Revenue averages $972 per month
- Occupancy maintains around 28.7%
- Daily rates hold near $112
Low Season (January, February, December)
- Revenue drops to average $566 per month
- Occupancy decreases to average 21.1%
- Daily rates adjust to average $102
Seasonality Insights for San Benedetto del Tronto
- The Airbnb seasonality in San Benedetto del Tronto shows highly seasonal trends requiring careful strategy. While the sections above show seasonal averages, it's also insightful to look at the extremes:
- During the high season, the absolute peak month showcases San Benedetto del Tronto's highest earning potential, with monthly revenues capable of climbing to $2,448, occupancy reaching a high of 56.9%, and ADRs peaking at $136.
- Conversely, the slowest single month of the year, typically falling within the low season, marks the market's lowest point. In this month, revenue might dip to $562, occupancy could drop to 19.1%, and ADRs may adjust down to $101.
- Understanding both the seasonal averages and these monthly peaks and troughs in revenue, occupancy, and ADR is crucial for maximizing your Airbnb profit potential in San Benedetto del Tronto.
Seasonal Strategies for Maximizing Profit
- Peak Season: Maximize revenue through premium pricing and potentially longer minimum stays. Ensure high availability.
- Low Season: Offer competitive pricing, special promotions (e.g., extended stay discounts), and flexible cancellation policies. Target off-season travelers like remote workers or budget-conscious guests.
- Shoulder Seasons: Implement dynamic pricing that balances peak and low rates. Target weekend travelers or specific events. Offer slightly more flexible terms than peak season.
- Regularly analyze your own performance against these San Benedetto del Tronto seasonality benchmarks and adjust your pricing and availability strategy accordingly.
Best Areas for Airbnb Investment in San Benedetto del Tronto (2025)
Exploring the top neighborhoods for short-term rentals in San Benedetto del Tronto? This section highlights key areas, outlining why they are attractive for hosts and guests, along with notable local attractions. Consider these locations based on your target guest profile and investment strategy.
| Neighborhood / Area | Why Host Here? (Target Guests & Appeal) | Key Attractions & Landmarks |
|---|---|---|
| Centro Storico | The historic center of San Benedetto del Tronto is known for its charming streets, local markets, and rich history. A great location for tourists interested in culture and local cuisine. | Piazza Sacconi, Torre dei Gualtieri, Chiesa di Sant'Antonio, local fish market, Museo del Mare |
| Lungomare | The waterfront promenade is popular among tourists for its beautiful beaches and seaside restaurants. Perfect for visitors looking to enjoy the sun and sea. | Lungomare Italia, beach clubs, pizzerias, seafood restaurants, sporting activities on the beach |
| Porto d'Ascoli | This area offers access to quieter beaches and a family-friendly atmosphere. Ideal for families seeking a relaxing vacation away from the bustling tourist spots. | Spiaggia di Porto d'Ascoli, local parks, children's playgrounds, beach bars, bike rental shops |
| San Benedetto's Outdoor Market | Known for its vibrant outdoor market, this area attracts locals and tourists alike, perfect for hosting guests looking to experience the local lifestyle. | Mercato Ittico, food stalls, local crafts, fresh produce stands, cafes |
| Viale Secondo Moretti | A bustling avenue lined with shops, restaurants, and entertainment options. Popular with tourists for its lively atmosphere and shopping opportunities. | shop boutiques, gelato shops, restaurants, nightlife options, local events |
| Riviera delle Palme | A scenic area with palm trees and excellent beaches, attracting visitors for beach activities and relaxation. Great for tourists who love the outdoors. | beachfront cafes, water sports, bike paths, picnic areas, coastal parks |
| Stadio Riviera delle Palme | The stadium area attracts sports fans and event-goers. A dynamic location hosted events throughout the year, suitable for those who enjoy sports. | football matches, concerts, local events, gym facilities, sports bars |
| Local Wine Regions | The surrounding wine regions are perfect for guests interested in wine tourism and local vineyards. A unique experience for food and wine lovers. | vineyards, wine tasting, local wineries, restaurant tours, scenic countryside |
Understanding Airbnb License Requirements & STR Laws in San Benedetto del Tronto (2025)
Yes, San Benedetto del Tronto, Marche, Italy enforces high STR regulations. Obtaining a license and ensuring compliance is almost certainly required according to current 2025 STR laws. Always verify the latest short term rental regulations and Airbnb license requirements directly with local government authorities for San Benedetto del Tronto to ensure full compliance before hosting.
(Source: AirROI data, 2025, based on 44% licensed listings)
Top Performing Airbnb Properties in San Benedetto del Tronto (2025)
Benchmark your potential! Explore examples of top-performing Airbnb properties in San Benedetto del Trontobased on Trailing Twelve Month (TTM) revenue. Analyze their characteristics, revenue, occupancy rate, and ADR to understand what drives success in this market.

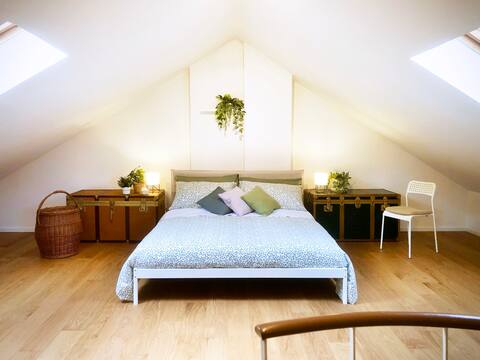
Pondoniera within walking distance of the sea-FH
Entire Place • 1 bedroom
Casa Micca - Cielo Terra
Entire Place • 4 bedrooms
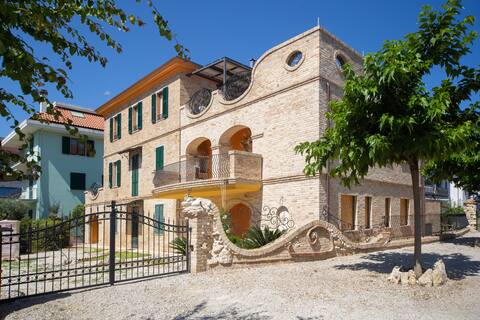
RESIDENZA ANTOLINA A STUNNING HOLIDAY
Entire Place • 3 bedrooms

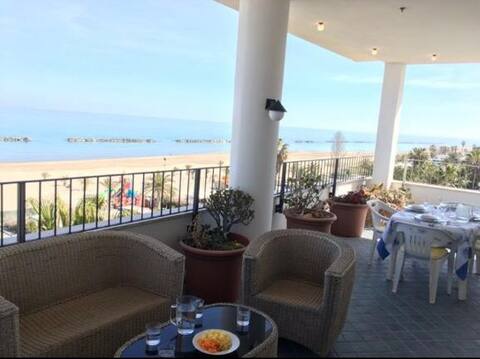
the terrace in the Adriatic
Entire Place • 1 bedroom
Penthouse on the SEA San Benedetto del Tronto
Entire Place • 3 bedrooms
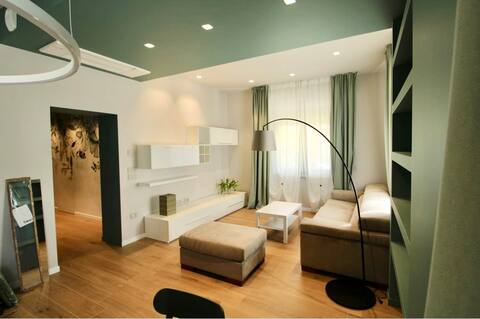
Théa apartment
Entire Place • 2 bedrooms
Note: Performance varies based on location, size, amenities, seasonality, and management quality. Data reflects the past 12 months.
Top Performing Airbnb Hosts in San Benedetto del Tronto (2025)
Learn from the best! This table showcases top-performing Airbnb hosts in San Benedetto del Tronto based on the number of properties managed and estimated total revenue over the past year. Analyze their scale and performance metrics.
| Host Name | Properties | Grossing Revenue | Stay Reviews | Avg Rating |
|---|---|---|---|---|
| Maria Chiara | 22 | $243,141 | 118 | 2.37/5.0 |
| Marta | 1 | $47,718 | 20 | 4.85/5.0 |
| Gabriele | 3 | $42,689 | 84 | 4.92/5.0 |
| Marco | 1 | $42,422 | 5 | 5.00/5.0 |
| Ida | 4 | $41,520 | 41 | 4.92/5.0 |
| Patrizia | 5 | $41,429 | 24 | 4.00/5.0 |
| Casa Nike | 3 | $38,876 | 609 | 4.62/5.0 |
| Vinicio | 12 | $37,893 | 5 | 0.33/5.0 |
| Alessio | 5 | $33,043 | 45 | 4.62/5.0 |
| Rossella | 2 | $32,760 | 49 | 5.00/5.0 |
Analyzing the strategies of top hosts, such as their property selection, pricing, and guest communication, can offer valuable lessons for optimizing your own Airbnb operations in San Benedetto del Tronto.
Dive Deeper: Advanced San Benedetto del Tronto STR Market Data (2025)
Ready to unlock more insights? AirROI provides access to advanced metrics and comprehensive Airbnb data for San Benedetto del Tronto. Explore detailed analytics beyond this report to refine your investment strategy, optimize pricing, and maximize your vacation rental profits.
Explore Advanced MetricsSan Benedetto del Tronto Short-Term Rental Market Composition (2025): Property & Room Types
Room Type Distribution
Property Type Distribution
Market Composition Insights for San Benedetto del Tronto
- The San Benedetto del Tronto Airbnb market composition is heavily skewed towards Entire Home/Apt listings, which make up 86.9% of the 291 active rentals. This indicates strong guest preference for privacy and space.
- Looking at the property type distribution in San Benedetto del Tronto, Apartment/Condo properties are the most common (80.8%), reflecting the local real estate landscape.
- The presence of 5.2% Hotel/Boutique listings indicates integration with traditional hospitality.
- Smaller segments like others (combined 0.3%) offer potential for unique stay experiences.
San Benedetto del Tronto Airbnb Room Capacity Analysis (2025): Bedroom Distribution
Distribution of Listings by Number of Bedrooms
Room Capacity Insights for San Benedetto del Tronto
- The dominant room capacity in San Benedetto del Tronto is 2 bedrooms listings, making up 41.2% of the market. This suggests a strong demand for properties suitable for couples or solo travelers.
- Together, 2 bedrooms and 1 bedroom properties represent 80.7% of the active Airbnb listings in San Benedetto del Tronto, indicating a high concentration in these sizes.
San Benedetto del Tronto Vacation Rental Guest Capacity Trends (2025)
Distribution of Listings by Guest Capacity
Guest Capacity Insights for San Benedetto del Tronto
- The most common guest capacity trend in San Benedetto del Tronto vacation rentals is listings accommodating 4 guests (34.4%). This suggests the primary traveler segment is likely small families or groups.
- Properties designed for 4 guests and 3 guests dominate the San Benedetto del Tronto STR market, accounting for 47.8% of listings.
- 18.5% of properties accommodate 6+ guests, serving the market segment for larger families or group travel in San Benedetto del Tronto.
- On average, properties in San Benedetto del Tronto are equipped to host 3.9 guests.
San Benedetto del Tronto Airbnb Booking Patterns (2025): Available vs. Booked Days
Available Days Distribution
Booked Days Distribution
Booking Pattern Insights for San Benedetto del Tronto
- The most common availability pattern in San Benedetto del Tronto falls within the 271-366 days range, representing 73.9% of listings. This suggests many properties have significant open periods on their calendars.
- Approximately 94.9% of listings show high availability (181+ days open annually), indicating potential for increased bookings or specific owner usage patterns.
- For booked days, the 31-90 days range is most frequent in San Benedetto del Tronto (40.5%), reflecting common guest stay durations or potential owner blocking patterns.
- A notable 5.2% of properties secure long booking periods (181+ days booked per year), highlighting successful long-term rental strategies or significant owner usage.
San Benedetto del Tronto Airbnb Minimum Stay Requirements Analysis
Distribution of Listings by Minimum Night Requirement
1 Night
51 listings
19.4% of total
2 Nights
46 listings
17.5% of total
3 Nights
28 listings
10.6% of total
4-6 Nights
53 listings
20.2% of total
7-29 Nights
63 listings
24% of total
30+ Nights
22 listings
8.4% of total
Key Insights
- The most prevalent minimum stay requirement in San Benedetto del Tronto is 7-29 Nights, adopted by 24% of listings. This highlights the market's preference for shorter, flexible bookings.
Recommendations
- Align with the market by considering a 7-29 Nights minimum stay, as 24% of San Benedetto del Tronto hosts use this setting.
- If feasible, allowing 1-night stays, especially midweek or during low season, could capture last-minute bookings, as only 19.4% currently do.
- Explore offering discounts for stays of 30+ nights to attract the 8.4% of the market seeking extended stays.
- Adjust minimum nights based on seasonality – potentially shorter during low season and longer during peak demand periods in San Benedetto del Tronto.
San Benedetto del Tronto Airbnb Cancellation Policy Trends Analysis (2025)
Flexible
47 listings
23.3% of total
Moderate
86 listings
42.6% of total
Strict
69 listings
34.2% of total
Cancellation Policy Insights for San Benedetto del Tronto
- The prevailing Airbnb cancellation policy trend in San Benedetto del Tronto is Moderate, used by 42.6% of listings.
- There's a relatively balanced mix between guest-friendly (65.9%) and stricter (34.2%) policies, offering choices for different guest needs.
Recommendations for Hosts
- Consider adopting a Moderate policy to align with the 42.6% market standard in San Benedetto del Tronto.
- With 34.2% using Strict terms, this is a viable option in San Benedetto del Tronto, particularly for high-value properties or during peak demand periods.
- Regularly review your cancellation policy against competitors and market demand shifts in San Benedetto del Tronto.
San Benedetto del Tronto STR Booking Lead Time Analysis (2025)
Average Booking Lead Time by Month
Booking Lead Time Insights for San Benedetto del Tronto
- The overall average booking lead time for vacation rentals in San Benedetto del Tronto is 53 days.
- Guests book furthest in advance for stays during May (average 82 days), likely coinciding with peak travel demand or local events.
- The shortest booking windows occur for stays in February (average 16 days), indicating more last-minute travel plans during this time.
- Seasonally, Summer (78 days avg.) sees the longest lead times, while Winter (31 days avg.) has the shortest, reflecting typical travel planning cycles.
Recommendations for Hosts
- Use the overall average lead time (53 days) as a baseline for your pricing and availability strategy in San Benedetto del Tronto.
- For May stays, consider implementing length-of-stay discounts or slightly higher rates for bookings made less than 82 days out to capitalize on advance planning.
- Target marketing efforts for the Summer season well in advance (at least 78 days) to capture early planners.
- Monitor your own booking lead times against these San Benedetto del Tronto averages to identify opportunities for dynamic pricing adjustments.
Popular & Essential Airbnb Amenities in San Benedetto del Tronto (2025)
Amenity Prevalence
Amenity Insights for San Benedetto del Tronto
- Essential amenities in San Benedetto del Tronto that guests expect include: TV, Heating. Lacking these (any) could significantly impact bookings.
- Popular amenities like Hot water, Kitchen, Air conditioning are common but not universal. Offering these can provide a competitive edge.
- Warning: Wifi is not universally provided but is considered essential globally. Ensure reliable Wifi is offered.
Recommendations for Hosts
- Ensure your listing includes all essential amenities for San Benedetto del Tronto: TV, Heating.
- Prioritize adding missing essentials: TV, Heating.
- Consider adding popular differentiators like Hot water or Kitchen to increase appeal.
- Highlight unique or less common amenities you offer (e.g., hot tub, dedicated workspace, EV charger) in your listing description and photos.
- Regularly check competitor amenities in San Benedetto del Tronto to stay competitive.
San Benedetto del Tronto Airbnb Guest Demographics & Profile Analysis (2025)
Guest Profile Summary for San Benedetto del Tronto
- The typical guest profile for Airbnb in San Benedetto del Tronto consists of primarily domestic travelers (66%), often arriving from nearby Milan, typically belonging to the Post-2000s (Gen Z/Alpha) group (50%), primarily speaking English or Italian.
- Domestic travelers account for 66.1% of guests.
- Key international markets include Italy (66.1%) and Germany (6.4%).
- Top languages spoken are English (34%) followed by Italian (29.5%).
- A significant demographic segment is the Post-2000s (Gen Z/Alpha) group, representing 50% of guests.
Recommendations for Hosts
- Target domestic marketing efforts towards travelers from Milan and Rome.
- Tailor amenities and listing descriptions to appeal to the dominant Post-2000s (Gen Z/Alpha) demographic (e.g., highlight fast WiFi, smart home features, local guides).
- Highlight unique local experiences or amenities relevant to the primary guest profile.
- Consider seasonal promotions aligned with peak travel times for key origin markets.
Nearby Short-Term Rental Market Comparison
How does the San Benedetto del Tronto Airbnb market stack up against its neighbors? Compare key performance metrics like average monthly revenue, ADR, and occupancy rates in surrounding areas to understand the broader regional STR landscape.
| Market | Active Properties | Monthly Revenue | Daily Rate | Avg. Occupancy |
|---|---|---|---|---|
| Rome | 23,290 | $2,898 | $208.87 | 51% |
| Collazzone | 28 | $2,839 | $341.11 | 36% |
| Parrano | 18 | $2,762 | $329.95 | 34% |
| Monte Castello di Vibio | 18 | $2,659 | $567.21 | 41% |
| Guardea | 15 | $2,542 | $320.56 | 35% |
| Monteleone d'Orvieto | 31 | $2,537 | $306.96 | 36% |
| Lugnano in Teverina | 19 | $2,238 | $267.38 | 35% |
| Collevecchio | 12 | $2,213 | $302.16 | 38% |
| Lisciano Niccone | 30 | $2,175 | $384.66 | 35% |
| Palombara Sabina | 16 | $2,160 | $336.01 | 35% |