Ripe Airbnb Market Analysis 2025: Short Term Rental Data & Vacation Rental Statistics in Marche, Italy
Is Airbnb profitable in Ripe in 2025? Explore comprehensive Airbnb analytics for Ripe, Marche, Italy to uncover income potential. This 2025 STR market report for Ripe, based on AirROI data from April 2024 to March 2025, reveals key trends in the niche market of 18 active listings.
Whether you're considering an Airbnb investment in Ripe, optimizing your existing vacation rental, or exploring rental arbitrage opportunities, understanding the Ripe Airbnb data is crucial. Navigating the high regulation landscape is key to maximizing your short term rental income potential. Let's dive into the specifics.
Key Ripe Airbnb Performance Metrics Overview
Monthly Airbnb Revenue Variations & Income Potential in Ripe (2025)
Understanding the monthly revenue variations for Airbnb listings in Ripe is key to maximizing your short term rental income potential. Seasonality significantly impacts earnings. Our analysis, based on data from the past 12 months, shows that the peak revenue month for STRs in Ripe is typically August, while January often presents the lowest earnings, highlighting opportunities for strategic pricing adjustments during shoulder and low seasons. Explore the typical Airbnb income in Ripe across different performance tiers:
- Best-in-class properties (Top 10%) achieve $2,627+ monthly, often utilizing dynamic pricing and superior guest experiences.
- Strong performing properties (Top 25%) earn $1,437 or more, indicating effective management and desirable locations/amenities.
- Typical properties (Median) generate around $514 per month, representing the average market performance.
- Entry-level properties (Bottom 25%) see earnings around $310, often with potential for optimization.
Average Monthly Airbnb Earnings Trend in Ripe
Ripe Airbnb Occupancy Rate Trends (2025)
Maximize your bookings by understanding the Ripe STR occupancy trends. Seasonal demand shifts significantly influence how often properties are booked. Typically, Augustsees the highest demand (peak season occupancy), while January experiences the lowest (low season). Effective strategies, like adjusting minimum stays or offering promotions, can boost occupancy during slower periods. Here's how different property tiers perform in Ripe:
- Best-in-class properties (Top 10%) achieve 57%+ occupancy, indicating high desirability and potentially optimized availability.
- Strong performing properties (Top 25%) maintain 33% or higher occupancy, suggesting good market fit and guest satisfaction.
- Typical properties (Median) have an occupancy rate around 15%.
- Entry-level properties (Bottom 25%) average 12% occupancy, potentially facing higher vacancy.
Average Monthly Occupancy Rate Trend in Ripe
Average Daily Rate (ADR) Airbnb Trends in Ripe (2025)
Effective short term rental pricing strategy in Ripe involves understanding monthly ADR fluctuations. The Average Daily Rate (ADR) for Airbnb in Ripe typically peaks in July and dips lowest during February. Leveraging Airbnb dynamic pricing tools or strategies based on this seasonality can significantly boost revenue. Here's a look at the typical nightly rates achieved:
- Best-in-class properties (Top 10%) command rates of $321+ per night, often due to premium features or locations.
- Strong performing properties (Top 25%) achieve nightly rates of $142 or more.
- Typical properties (Median) charge around $93 per night.
- Entry-level properties (Bottom 25%) earn around $69 per night.
Average Daily Rate (ADR) Trend by Month in Ripe
Get Live Ripe Market Intelligence 👇

Explore Real-time Analytics
Airbnb Seasonality Analysis & Trends in Ripe (2025)
Peak Season (August, September, October)
- Revenue averages $1,918 per month
- Occupancy rates average 40.7%
- Daily rates average $164
Shoulder Season
- Revenue averages $972 per month
- Occupancy maintains around 21.9%
- Daily rates hold near $150
Low Season (January, February, December)
- Revenue drops to average $125 per month
- Occupancy decreases to average 5.1%
- Daily rates adjust to average $121
Seasonality Insights for Ripe
- The Airbnb seasonality in Ripe shows highly seasonal trends requiring careful strategy. While the sections above show seasonal averages, it's also insightful to look at the extremes:
- During the high season, the absolute peak month showcases Ripe's highest earning potential, with monthly revenues capable of climbing to $2,200, occupancy reaching a high of 46.7%, and ADRs peaking at $185.
- Conversely, the slowest single month of the year, typically falling within the low season, marks the market's lowest point. In this month, revenue might dip to $0, occupancy could drop to 0.0%, and ADRs may adjust down to $118.
- Understanding both the seasonal averages and these monthly peaks and troughs in revenue, occupancy, and ADR is crucial for maximizing your Airbnb profit potential in Ripe.
Seasonal Strategies for Maximizing Profit
- Peak Season: Maximize revenue through premium pricing and potentially longer minimum stays. Ensure high availability.
- Low Season: Offer competitive pricing, special promotions (e.g., extended stay discounts), and flexible cancellation policies. Target off-season travelers like remote workers or budget-conscious guests.
- Shoulder Seasons: Implement dynamic pricing that balances peak and low rates. Target weekend travelers or specific events. Offer slightly more flexible terms than peak season.
- Regularly analyze your own performance against these Ripe seasonality benchmarks and adjust your pricing and availability strategy accordingly.
Best Areas for Airbnb Investment in Ripe (2025)
Exploring the top neighborhoods for short-term rentals in Ripe? This section highlights key areas, outlining why they are attractive for hosts and guests, along with notable local attractions. Consider these locations based on your target guest profile and investment strategy.
| Neighborhood / Area | Why Host Here? (Target Guests & Appeal) | Key Attractions & Landmarks |
|---|---|---|
| Ripe | Ripe is a charming town in the Marche region, offering a tranquil environment with beautiful countryside views. It's appealing to tourists looking for a peaceful retreat close to nature and local culture. | Historic center of Ripe, Parco Naturale Regionale del Conero, Local wineries, Traditional Marche cuisine, Nearby beaches of Senigallia |
| Senigallia | Famous for its sandy beaches and vibrant summer scene, Senigallia attracts families and beachgoers. Ideal for investors looking to host tourists during the summer months in a lively seaside town. | Velvet Beach, Historic Rocca Roveresca, Piazza Garibaldi, Piazza del Duca, Misa River |
| Jesi | A historic town known for its rich culture and beautiful architecture. Jesi is great for those who appreciate history and offers various cultural events year-round, appealing to tourists. | Jesi's cathedral, Palazzo della Signoria, Teatro Pergolesi, Historical museums, Local food markets |
| Fabriano | Known for its paper production and beautiful medieval architecture, Fabriano attracts tourists interested in artisan crafts and history. A unique spot for those seeking a cultural experience. | Paper Museum, Duomo di Fabriano, Palazzo del Podestà, Local festivals, Nearby hiking trails |
| Ancona | The capital of Marche, Ancona is a port city offering a mix of history, culture, and beautiful coastal views. It draws a variety of visitors, including cruise ship passengers and history buffs. | Ancona Cathedral, Trajan's Arch, Piazza del Plebiscito, Port of Ancona, Beaches like Mezzavalle |
| Corinaldo | A beautiful medieval hill town, known for its well-preserved walls and stunning views. Corinaldo attracts visitors interested in history and scenic landscapes, making it a unique stay. | Corinaldo walls, Piazza il Terreno, San Francesco Church, Local festivals, Surrounding vineyards |
| Montecarotto | A smaller town that is representative of the picturesque Marche countryside. It’s perfect for those looking to experience rural life, local food, and wine tours. | Vineyards, Local olive oil tastings, Historical sites, Hiking routes, Artisan shops |
| Sirolo | Located in the Conero Riviera, Sirolo is a stunning coastal town offering beautiful beaches and natural parks. It's very attractive for tourists looking for sun, sea, and outdoor activities. | Sirolo beaches, Conero National Park, Local restaurants, Natural hiking trails, Beautiful viewpoints |
Understanding Airbnb License Requirements & STR Laws in Ripe (2025)
Yes, Ripe, Marche, Italy enforces high STR regulations. Obtaining a license and ensuring compliance is almost certainly required according to current 2025 STR laws. Always verify the latest short term rental regulations and Airbnb license requirements directly with local government authorities for Ripe to ensure full compliance before hosting.
(Source: AirROI data, 2025, based on 56% licensed listings)
Top Performing Airbnb Properties in Ripe (2025)
Benchmark your potential! Explore examples of top-performing Airbnb properties in Ripebased on Trailing Twelve Month (TTM) revenue. Analyze their characteristics, revenue, occupancy rate, and ADR to understand what drives success in this market.
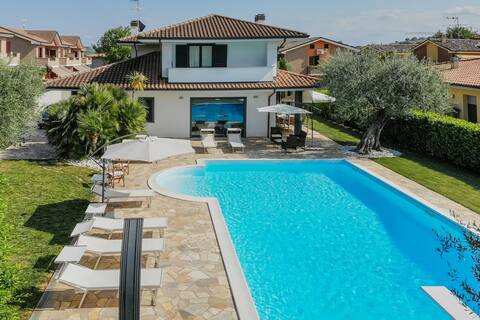
Villa Pepe
Entire Place • 4 bedrooms

Casa Lavanda
Entire Place • 2 bedrooms
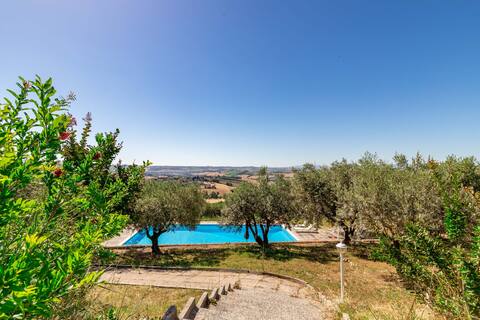
Casale Agrimarino - Casale Agrimarino
Entire Place • 5 bedrooms
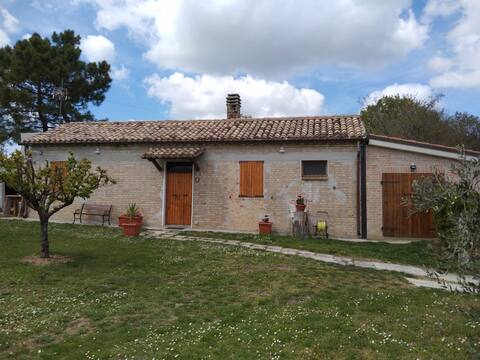
A peaceful corner 10 minutes from the sea...
Entire Place • 1 bedroom
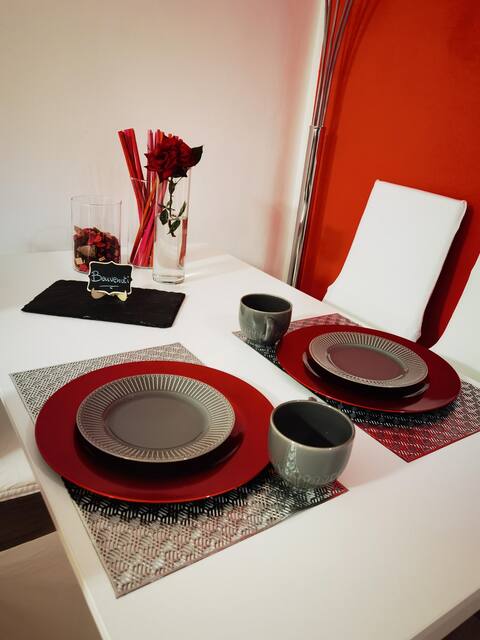
La Taverna Moderna
Entire Place • 1 bedroom
OWL App. to independent - pool -park-panorama
Entire Place • 2 bedrooms
Note: Performance varies based on location, size, amenities, seasonality, and management quality. Data reflects the past 12 months.
Top Performing Airbnb Hosts in Ripe (2025)
Learn from the best! This table showcases top-performing Airbnb hosts in Ripe based on the number of properties managed and estimated total revenue over the past year. Analyze their scale and performance metrics.
| Host Name | Properties | Grossing Revenue | Stay Reviews | Avg Rating |
|---|---|---|---|---|
| Daniele | 7 | $23,738 | 82 | 4.19/5.0 |
| Host #50878223 | 1 | $18,839 | 1 | 0.00/5.0 |
| Irena | 1 | $17,704 | 10 | 5.00/5.0 |
| Michela | 1 | $17,021 | 4 | 3.75/5.0 |
| Viola | 1 | $12,713 | 77 | 4.87/5.0 |
| Margherita | 1 | $10,472 | 20 | 5.00/5.0 |
| Cinzia | 1 | $6,965 | 11 | 5.00/5.0 |
| Sergio | 2 | $6,597 | 118 | 4.93/5.0 |
| Luca | 1 | $2,724 | 5 | 5.00/5.0 |
| Host #368897471 | 1 | $1,742 | 3 | 4.67/5.0 |
Analyzing the strategies of top hosts, such as their property selection, pricing, and guest communication, can offer valuable lessons for optimizing your own Airbnb operations in Ripe.
Dive Deeper: Advanced Ripe STR Market Data (2025)
Ready to unlock more insights? AirROI provides access to advanced metrics and comprehensive Airbnb data for Ripe. Explore detailed analytics beyond this report to refine your investment strategy, optimize pricing, and maximize your vacation rental profits.
Explore Advanced MetricsRipe Short-Term Rental Market Composition (2025): Property & Room Types
Room Type Distribution
Property Type Distribution
Market Composition Insights for Ripe
- The Ripe Airbnb market composition is heavily skewed towards Entire Home/Apt listings, which make up 72.2% of the 18 active rentals. This indicates strong guest preference for privacy and space.
- Looking at the property type distribution in Ripe, Apartment/Condo properties are the most common (38.9%), reflecting the local real estate landscape.
- Houses represent a significant 38.9% portion, catering likely to families or larger groups.
- The presence of 11.1% Hotel/Boutique listings indicates integration with traditional hospitality.
Ripe Airbnb Room Capacity Analysis (2025): Bedroom Distribution
Distribution of Listings by Number of Bedrooms
Room Capacity Insights for Ripe
- The dominant room capacity in Ripe is 1 bedroom listings, making up 50% of the market. This suggests a strong demand for properties suitable for couples or solo travelers.
- Together, 1 bedroom and 2 bedrooms properties represent 72.2% of the active Airbnb listings in Ripe, indicating a high concentration in these sizes.
Ripe Vacation Rental Guest Capacity Trends (2025)
Distribution of Listings by Guest Capacity
Guest Capacity Insights for Ripe
- The most common guest capacity trend in Ripe vacation rentals is listings accommodating 5 guests (22.2%). This suggests the primary traveler segment is likely larger groups.
- Properties designed for 5 guests and 2 guests dominate the Ripe STR market, accounting for 38.9% of listings.
- 16.7% of properties accommodate 6+ guests, serving the market segment for larger families or group travel in Ripe.
- On average, properties in Ripe are equipped to host 3.7 guests.
Ripe Airbnb Booking Patterns (2025): Available vs. Booked Days
Available Days Distribution
Booked Days Distribution
Booking Pattern Insights for Ripe
- The most common availability pattern in Ripe falls within the 271-366 days range, representing 83.3% of listings. This suggests many properties have significant open periods on their calendars.
- Approximately 94.4% of listings show high availability (181+ days open annually), indicating potential for increased bookings or specific owner usage patterns.
- For booked days, the 31-90 days range is most frequent in Ripe (55.6%), reflecting common guest stay durations or potential owner blocking patterns.
- A notable 5.6% of properties secure long booking periods (181+ days booked per year), highlighting successful long-term rental strategies or significant owner usage.
Ripe Airbnb Minimum Stay Requirements Analysis
Distribution of Listings by Minimum Night Requirement
1 Night
6 listings
37.5% of total
2 Nights
5 listings
31.3% of total
3 Nights
2 listings
12.5% of total
4-6 Nights
1 listings
6.3% of total
7-29 Nights
2 listings
12.5% of total
Key Insights
- The most prevalent minimum stay requirement in Ripe is 1 Night, adopted by 37.5% of listings. This highlights the market's preference for shorter, flexible bookings.
- A strong majority (68.8%) of the Ripe Airbnb data shows acceptance of very short stays (1-2 nights), indicating a dynamic, high-turnover market.
Recommendations
- Align with the market by considering a 1 Night minimum stay, as 37.5% of Ripe hosts use this setting.
- Adjust minimum nights based on seasonality – potentially shorter during low season and longer during peak demand periods in Ripe.
Ripe Airbnb Cancellation Policy Trends Analysis (2025)
Super Strict 30 Days
1 listings
6.3% of total
Flexible
13 listings
81.3% of total
Moderate
1 listings
6.3% of total
Strict
1 listings
6.3% of total
Cancellation Policy Insights for Ripe
- The prevailing Airbnb cancellation policy trend in Ripe is Flexible, used by 81.3% of listings.
- The market strongly favors guest-friendly terms, with 87.6% of listings offering Flexible or Moderate policies. This suggests guests in Ripe may expect booking flexibility.
- Strict cancellation policies are quite rare (6.3%), potentially making listings with this policy less competitive unless justified by high demand or property type.
Recommendations for Hosts
- Consider adopting a Flexible policy to align with the 81.3% market standard in Ripe.
- Given the high prevalence of Flexible policies (81.3%), offering this can enhance booking appeal, especially during shoulder seasons.
- Using a Strict policy might deter some guests, as only 6.3% of listings use it. Evaluate if potential revenue protection outweighs possible lower booking rates.
- Regularly review your cancellation policy against competitors and market demand shifts in Ripe.
Ripe STR Booking Lead Time Analysis (2025)
Average Booking Lead Time by Month
Booking Lead Time Insights for Ripe
- The overall average booking lead time for vacation rentals in Ripe is 54 days.
- Guests book furthest in advance for stays during June (average 115 days), likely coinciding with peak travel demand or local events.
- The shortest booking windows occur for stays in February (average 0 days), indicating more last-minute travel plans during this time.
- Seasonally, Spring (77 days avg.) sees the longest lead times, while Winter (29 days avg.) has the shortest, reflecting typical travel planning cycles.
Recommendations for Hosts
- Use the overall average lead time (54 days) as a baseline for your pricing and availability strategy in Ripe.
- For June stays, consider implementing length-of-stay discounts or slightly higher rates for bookings made less than 115 days out to capitalize on advance planning.
- During February, focus on last-minute booking availability and promotions, as guests book with very short notice (0 days avg.).
- Target marketing efforts for the Spring season well in advance (at least 77 days) to capture early planners.
- Monitor your own booking lead times against these Ripe averages to identify opportunities for dynamic pricing adjustments.
Popular & Essential Airbnb Amenities in Ripe (2025)
Amenity Prevalence
Amenity Insights for Ripe
- Essential amenities in Ripe that guests expect include: Wifi, Hair dryer. Lacking these (any) could significantly impact bookings.
- Popular amenities like Essentials, TV, Free parking on premises are common but not universal. Offering these can provide a competitive edge.
Recommendations for Hosts
- Ensure your listing includes all essential amenities for Ripe: Wifi, Hair dryer.
- Consider adding popular differentiators like Essentials or TV to increase appeal.
- Highlight unique or less common amenities you offer (e.g., hot tub, dedicated workspace, EV charger) in your listing description and photos.
- Regularly check competitor amenities in Ripe to stay competitive.
Ripe Airbnb Guest Demographics & Profile Analysis (2025)
Guest Profile Summary for Ripe
- The typical guest profile for Airbnb in Ripe consists of a mix of domestic (61%) and international guests, often arriving from nearby Rome, typically belonging to the Post-2000s (Gen Z/Alpha) group (50%), primarily speaking English or Italian.
- Domestic travelers account for 60.7% of guests.
- Key international markets include Italy (60.7%) and Germany (10.7%).
- Top languages spoken are English (30.8%) followed by Italian (25.6%).
- A significant demographic segment is the Post-2000s (Gen Z/Alpha) group, representing 50% of guests.
Recommendations for Hosts
- Target domestic marketing efforts towards travelers from Rome and New York.
- Tailor amenities and listing descriptions to appeal to the dominant Post-2000s (Gen Z/Alpha) demographic (e.g., highlight fast WiFi, smart home features, local guides).
- Highlight unique local experiences or amenities relevant to the primary guest profile.
- Consider seasonal promotions aligned with peak travel times for key origin markets.
Nearby Short-Term Rental Market Comparison
How does the Ripe Airbnb market stack up against its neighbors? Compare key performance metrics like average monthly revenue, ADR, and occupancy rates in surrounding areas to understand the broader regional STR landscape.
| Market | Active Properties | Monthly Revenue | Daily Rate | Avg. Occupancy |
|---|---|---|---|---|
| Collazzone | 28 | $2,839 | $341.11 | 36% |
| Parrano | 18 | $2,762 | $329.95 | 34% |
| Monte Castello di Vibio | 18 | $2,659 | $567.21 | 41% |
| Guardea | 15 | $2,542 | $320.56 | 35% |
| Monteleone d'Orvieto | 31 | $2,537 | $306.96 | 36% |
| Lugnano in Teverina | 19 | $2,238 | $267.38 | 35% |
| Collevecchio | 12 | $2,213 | $302.16 | 38% |
| Lisciano Niccone | 30 | $2,175 | $384.66 | 35% |
| Palombara Sabina | 16 | $2,160 | $336.01 | 35% |
| Deruta | 15 | $2,127 | $232.83 | 37% |