Campofilone Airbnb Market Analysis 2025: Short Term Rental Data & Vacation Rental Statistics in Marche, Italy
Is Airbnb profitable in Campofilone in 2025? Explore comprehensive Airbnb analytics for Campofilone, Marche, Italy to uncover income potential. This 2025 STR market report for Campofilone, based on AirROI data from April 2024 to March 2025, reveals key trends in the niche market of 22 active listings.
Whether you're considering an Airbnb investment in Campofilone, optimizing your existing vacation rental, or exploring rental arbitrage opportunities, understanding the Campofilone Airbnb data is crucial. Navigating the high regulation landscape is key to maximizing your short term rental income potential. Let's dive into the specifics.
Key Campofilone Airbnb Performance Metrics Overview
Monthly Airbnb Revenue Variations & Income Potential in Campofilone (2025)
Understanding the monthly revenue variations for Airbnb listings in Campofilone is key to maximizing your short term rental income potential. Seasonality significantly impacts earnings. Our analysis, based on data from the past 12 months, shows that the peak revenue month for STRs in Campofilone is typically August, while February often presents the lowest earnings, highlighting opportunities for strategic pricing adjustments during shoulder and low seasons. Explore the typical Airbnb income in Campofilone across different performance tiers:
- Best-in-class properties (Top 10%) achieve $2,161+ monthly, often utilizing dynamic pricing and superior guest experiences.
- Strong performing properties (Top 25%) earn $1,596 or more, indicating effective management and desirable locations/amenities.
- Typical properties (Median) generate around $1,016 per month, representing the average market performance.
- Entry-level properties (Bottom 25%) see earnings around $487, often with potential for optimization.
Average Monthly Airbnb Earnings Trend in Campofilone
Campofilone Airbnb Occupancy Rate Trends (2025)
Maximize your bookings by understanding the Campofilone STR occupancy trends. Seasonal demand shifts significantly influence how often properties are booked. Typically, Augustsees the highest demand (peak season occupancy), while December experiences the lowest (low season). Effective strategies, like adjusting minimum stays or offering promotions, can boost occupancy during slower periods. Here's how different property tiers perform in Campofilone:
- Best-in-class properties (Top 10%) achieve 64%+ occupancy, indicating high desirability and potentially optimized availability.
- Strong performing properties (Top 25%) maintain 42% or higher occupancy, suggesting good market fit and guest satisfaction.
- Typical properties (Median) have an occupancy rate around 29%.
- Entry-level properties (Bottom 25%) average 14% occupancy, potentially facing higher vacancy.
Average Monthly Occupancy Rate Trend in Campofilone
Average Daily Rate (ADR) Airbnb Trends in Campofilone (2025)
Effective short term rental pricing strategy in Campofilone involves understanding monthly ADR fluctuations. The Average Daily Rate (ADR) for Airbnb in Campofilone typically peaks in August and dips lowest during December. Leveraging Airbnb dynamic pricing tools or strategies based on this seasonality can significantly boost revenue. Here's a look at the typical nightly rates achieved:
- Best-in-class properties (Top 10%) command rates of $210+ per night, often due to premium features or locations.
- Strong performing properties (Top 25%) achieve nightly rates of $137 or more.
- Typical properties (Median) charge around $103 per night.
- Entry-level properties (Bottom 25%) earn around $81 per night.
Average Daily Rate (ADR) Trend by Month in Campofilone
Get Live Campofilone Market Intelligence 👇

Explore Real-time Analytics
Airbnb Seasonality Analysis & Trends in Campofilone (2025)
Peak Season (August, July, September)
- Revenue averages $2,235 per month
- Occupancy rates average 55.9%
- Daily rates average $152
Shoulder Season
- Revenue averages $976 per month
- Occupancy maintains around 27.3%
- Daily rates hold near $130
Low Season (January, February, December)
- Revenue drops to average $458 per month
- Occupancy decreases to average 17.2%
- Daily rates adjust to average $100
Seasonality Insights for Campofilone
- The Airbnb seasonality in Campofilone shows highly seasonal trends requiring careful strategy. While the sections above show seasonal averages, it's also insightful to look at the extremes:
- During the high season, the absolute peak month showcases Campofilone's highest earning potential, with monthly revenues capable of climbing to $2,653, occupancy reaching a high of 66.4%, and ADRs peaking at $158.
- Conversely, the slowest single month of the year, typically falling within the low season, marks the market's lowest point. In this month, revenue might dip to $411, occupancy could drop to 16.2%, and ADRs may adjust down to $98.
- Understanding both the seasonal averages and these monthly peaks and troughs in revenue, occupancy, and ADR is crucial for maximizing your Airbnb profit potential in Campofilone.
Seasonal Strategies for Maximizing Profit
- Peak Season: Maximize revenue through premium pricing and potentially longer minimum stays. Ensure high availability.
- Low Season: Offer competitive pricing, special promotions (e.g., extended stay discounts), and flexible cancellation policies. Target off-season travelers like remote workers or budget-conscious guests.
- Shoulder Seasons: Implement dynamic pricing that balances peak and low rates. Target weekend travelers or specific events. Offer slightly more flexible terms than peak season.
- Regularly analyze your own performance against these Campofilone seasonality benchmarks and adjust your pricing and availability strategy accordingly.
Best Areas for Airbnb Investment in Campofilone (2025)
Exploring the top neighborhoods for short-term rentals in Campofilone? This section highlights key areas, outlining why they are attractive for hosts and guests, along with notable local attractions. Consider these locations based on your target guest profile and investment strategy.
| Neighborhood / Area | Why Host Here? (Target Guests & Appeal) | Key Attractions & Landmarks |
|---|---|---|
| Centro Storico | Charming historical center of Campofilone with well-preserved medieval architecture. Attracts tourists interested in history and culture, providing a unique Italian village experience. | Santuario di San Basso, Chiesa di Santa Maria Assunta, Piazza della Libertà, Historical walking routes, Local artisan shops |
| Lungomare di Campofilone | Scenic seaside area with beautiful beaches and vibrant beach clubs. Perfect for tourists looking for relaxation, sunbathing, and water activities. | Beaches, Beach clubs, Water sports, Seafood restaurants, Promenade |
| Colline Marchigiane | Picturesque hillside area offering stunning views of the surrounding landscape. Ideal for guests who enjoy nature, hiking, and rural tourism. | Hiking trails, Vineyards, Olive groves, Local farms, Panoramic viewpoints |
| Fermo | Nearby historical town offering a rich culture and historical sites. A popular day-trip destination for Campofilone guests. | Fermo Cathedral, Historical museums, Piazza del Popolo, Roman cisterns, Teatro dell'Aquila |
| Ascoli Piceno | Famous for its medieval architecture and vibrant cultural scene. Attracts visitors interested in history and regional cuisine. | Piazza del Popolo, Guido III Bridge, Forte Malatesta, Local food markets, The Cathedral of Sant'Emidio |
| San Benedetto del Tronto | Popular coastal city with a lively promenade and excellent seafood. Great for tourists who want beach activities and nightlife. | Santa Maria della Marina, The waterfront promenade, Local seafood restaurants, Beach clubs, Vibrant nightlife |
| Montefiore dell'Aso | A beautiful hilltop village known for its historical sites and stunning views. Suitable for those who enjoy cultural tourism and serene environments. | Archaeological Museum, Historic fortress, Charming plazas, Local vineyards, Artisan shops |
| Grottammare | Another charming seaside town known for its beaches and historical center. A favorite destination for families and beachgoers. | Grottammare beach, Historical center, Parks, Restaurants by the sea, Cultural events |
Understanding Airbnb License Requirements & STR Laws in Campofilone (2025)
Yes, Campofilone, Marche, Italy enforces high STR regulations. Obtaining a license and ensuring compliance is almost certainly required according to current 2025 STR laws. Always verify the latest short term rental regulations and Airbnb license requirements directly with local government authorities for Campofilone to ensure full compliance before hosting.
(Source: AirROI data, 2025, based on 59% licensed listings)
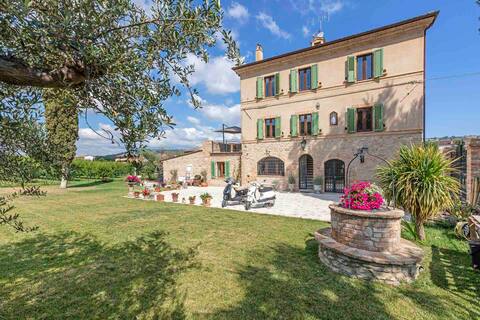
Top Performing Airbnb Properties in Campofilone (2025)
Benchmark your potential! Explore examples of top-performing Airbnb properties in Campofilonebased on Trailing Twelve Month (TTM) revenue. Analyze their characteristics, revenue, occupancy rate, and ADR to understand what drives success in this market.

Seaside terrace with pool
Entire Place • 2 bedrooms

Mondomini - Charming cottage with view on the sea
Entire Place • 1 bedroom

Mondomini-Large apartment with panoramic terrace
Entire Place • 1 bedroom
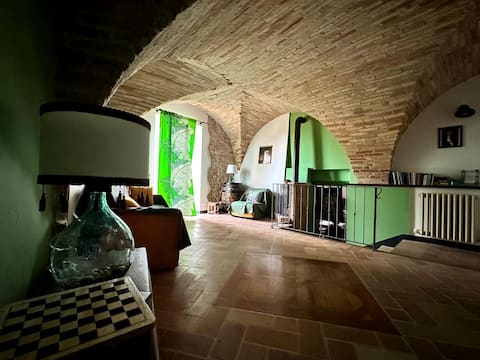
Campofilone apartment in medieval village
Entire Place • 2 bedrooms
Villa Caravaggio - Apartment "Olivo"
Entire Place • 1 bedroom

Big rooftop town villa
Entire Place • 4 bedrooms
Note: Performance varies based on location, size, amenities, seasonality, and management quality. Data reflects the past 12 months.
Top Performing Airbnb Hosts in Campofilone (2025)
Learn from the best! This table showcases top-performing Airbnb hosts in Campofilone based on the number of properties managed and estimated total revenue over the past year. Analyze their scale and performance metrics.
| Host Name | Properties | Grossing Revenue | Stay Reviews | Avg Rating |
|---|---|---|---|---|
| Livia | 4 | $49,166 | 98 | 2.41/5.0 |
| Deborah | 3 | $39,277 | 69 | 4.99/5.0 |
| Michela | 1 | $22,172 | 8 | 5.00/5.0 |
| Tania | 1 | $15,764 | 18 | 5.00/5.0 |
| Janis Rebecca | 1 | $13,316 | 6 | 5.00/5.0 |
| Valentina | 1 | $10,720 | 17 | 4.94/5.0 |
| Host #200660331 | 1 | $10,482 | 6 | 5.00/5.0 |
| Simona | 1 | $9,429 | 89 | 4.91/5.0 |
| Patrizia | 1 | $7,589 | 11 | 4.18/5.0 |
| Glory | 1 | $6,837 | 22 | 4.55/5.0 |
Analyzing the strategies of top hosts, such as their property selection, pricing, and guest communication, can offer valuable lessons for optimizing your own Airbnb operations in Campofilone.
Dive Deeper: Advanced Campofilone STR Market Data (2025)
Ready to unlock more insights? AirROI provides access to advanced metrics and comprehensive Airbnb data for Campofilone. Explore detailed analytics beyond this report to refine your investment strategy, optimize pricing, and maximize your vacation rental profits.
Explore Advanced MetricsCampofilone Short-Term Rental Market Composition (2025): Property & Room Types
Room Type Distribution
Property Type Distribution
Market Composition Insights for Campofilone
- The Campofilone Airbnb market composition is heavily skewed towards Entire Home/Apt listings, which make up 95.5% of the 22 active rentals. This indicates strong guest preference for privacy and space.
- Looking at the property type distribution in Campofilone, Apartment/Condo properties are the most common (54.5%), reflecting the local real estate landscape.
- Houses represent a significant 45.5% portion, catering likely to families or larger groups.
Campofilone Airbnb Room Capacity Analysis (2025): Bedroom Distribution
Distribution of Listings by Number of Bedrooms
Room Capacity Insights for Campofilone
- The dominant room capacity in Campofilone is 2 bedrooms listings, making up 40.9% of the market. This suggests a strong demand for properties suitable for couples or solo travelers.
- Together, 2 bedrooms and 1 bedroom properties represent 77.3% of the active Airbnb listings in Campofilone, indicating a high concentration in these sizes.
Campofilone Vacation Rental Guest Capacity Trends (2025)
Distribution of Listings by Guest Capacity
Guest Capacity Insights for Campofilone
- The most common guest capacity trend in Campofilone vacation rentals is listings accommodating 4 guests (50%). This suggests the primary traveler segment is likely small families or groups.
- Properties designed for 4 guests and 6 guests dominate the Campofilone STR market, accounting for 68.2% of listings.
- 22.7% of properties accommodate 6+ guests, serving the market segment for larger families or group travel in Campofilone.
- On average, properties in Campofilone are equipped to host 4.2 guests.
Campofilone Airbnb Booking Patterns (2025): Available vs. Booked Days
Available Days Distribution
Booked Days Distribution
Booking Pattern Insights for Campofilone
- The most common availability pattern in Campofilone falls within the 271-366 days range, representing 63.6% of listings. This suggests many properties have significant open periods on their calendars.
- Approximately 95.4% of listings show high availability (181+ days open annually), indicating potential for increased bookings or specific owner usage patterns.
- For booked days, the 91-180 days range is most frequent in Campofilone (36.4%), reflecting common guest stay durations or potential owner blocking patterns.
- A notable 4.5% of properties secure long booking periods (181+ days booked per year), highlighting successful long-term rental strategies or significant owner usage.
Campofilone Airbnb Minimum Stay Requirements Analysis
Distribution of Listings by Minimum Night Requirement
1 Night
4 listings
19% of total
2 Nights
1 listings
4.8% of total
3 Nights
3 listings
14.3% of total
4-6 Nights
6 listings
28.6% of total
7-29 Nights
3 listings
14.3% of total
30+ Nights
4 listings
19% of total
Key Insights
- The most prevalent minimum stay requirement in Campofilone is 4-6 Nights, adopted by 28.6% of listings. This highlights the market's preference for longer commitments.
- A significant segment (19%) caters to monthly stays (30+ nights) in Campofilone, pointing to opportunities in the extended-stay market.
Recommendations
- Align with the market by considering a 4-6 Nights minimum stay, as 28.6% of Campofilone hosts use this setting.
- If feasible, allowing 1-night stays, especially midweek or during low season, could capture last-minute bookings, as only 19% currently do.
- Explore offering discounts for stays of 30+ nights to attract the 19% of the market seeking extended stays.
- Adjust minimum nights based on seasonality – potentially shorter during low season and longer during peak demand periods in Campofilone.
Campofilone Airbnb Cancellation Policy Trends Analysis (2025)
Super Strict 30 Days
2 listings
11.8% of total
Flexible
4 listings
23.5% of total
Moderate
7 listings
41.2% of total
Strict
4 listings
23.5% of total
Cancellation Policy Insights for Campofilone
- The prevailing Airbnb cancellation policy trend in Campofilone is Moderate, used by 41.2% of listings.
- There's a relatively balanced mix between guest-friendly (64.7%) and stricter (23.5%) policies, offering choices for different guest needs.
Recommendations for Hosts
- Consider adopting a Moderate policy to align with the 41.2% market standard in Campofilone.
- Regularly review your cancellation policy against competitors and market demand shifts in Campofilone.
Campofilone STR Booking Lead Time Analysis (2025)
Average Booking Lead Time by Month
Booking Lead Time Insights for Campofilone
- The overall average booking lead time for vacation rentals in Campofilone is 65 days.
- Guests book furthest in advance for stays during April (average 118 days), likely coinciding with peak travel demand or local events.
- The shortest booking windows occur for stays in December (average 24 days), indicating more last-minute travel plans during this time.
- Seasonally, Spring (82 days avg.) sees the longest lead times, while Winter (26 days avg.) has the shortest, reflecting typical travel planning cycles.
Recommendations for Hosts
- Use the overall average lead time (65 days) as a baseline for your pricing and availability strategy in Campofilone.
- For April stays, consider implementing length-of-stay discounts or slightly higher rates for bookings made less than 118 days out to capitalize on advance planning.
- Target marketing efforts for the Spring season well in advance (at least 82 days) to capture early planners.
- Monitor your own booking lead times against these Campofilone averages to identify opportunities for dynamic pricing adjustments.
Popular & Essential Airbnb Amenities in Campofilone (2025)
Amenity Prevalence
Amenity Insights for Campofilone
- Essential amenities in Campofilone that guests expect include: Kitchen, Hot water, Essentials. Lacking these (any) could significantly impact bookings.
- Popular amenities like Free parking on premises, TV, Washer are common but not universal. Offering these can provide a competitive edge.
- Warning: Wifi is not universally provided but is considered essential globally. Ensure reliable Wifi is offered.
Recommendations for Hosts
- Ensure your listing includes all essential amenities for Campofilone: Kitchen, Hot water, Essentials.
- Prioritize adding missing essentials: Essentials.
- Consider adding popular differentiators like Free parking on premises or TV to increase appeal.
- Highlight unique or less common amenities you offer (e.g., hot tub, dedicated workspace, EV charger) in your listing description and photos.
- Regularly check competitor amenities in Campofilone to stay competitive.
Campofilone Airbnb Guest Demographics & Profile Analysis (2025)
Guest Profile Summary for Campofilone
- The typical guest profile for Airbnb in Campofilone consists of a mix of domestic (41%) and international guests, with top international origins including Germany, typically belonging to the Post-2000s (Gen Z/Alpha) group (50%), primarily speaking English or German.
- Domestic travelers account for 40.7% of guests.
- Key international markets include Italy (40.7%) and Germany (19.8%).
- Top languages spoken are English (33.1%) followed by German (19.2%).
- A significant demographic segment is the Post-2000s (Gen Z/Alpha) group, representing 50% of guests.
Recommendations for Hosts
- Balance marketing efforts between domestic and international channels based on the guest mix.
- Tailor amenities and listing descriptions to appeal to the dominant Post-2000s (Gen Z/Alpha) demographic (e.g., highlight fast WiFi, smart home features, local guides).
- Highlight unique local experiences or amenities relevant to the primary guest profile.
- Consider seasonal promotions aligned with peak travel times for key origin markets.
Nearby Short-Term Rental Market Comparison
How does the Campofilone Airbnb market stack up against its neighbors? Compare key performance metrics like average monthly revenue, ADR, and occupancy rates in surrounding areas to understand the broader regional STR landscape.
| Market | Active Properties | Monthly Revenue | Daily Rate | Avg. Occupancy |
|---|---|---|---|---|
| Collazzone | 28 | $2,839 | $341.11 | 36% |
| Parrano | 18 | $2,762 | $329.95 | 34% |
| Monte Castello di Vibio | 18 | $2,659 | $567.21 | 41% |
| Guardea | 15 | $2,542 | $320.56 | 35% |
| Monteleone d'Orvieto | 31 | $2,537 | $306.96 | 36% |
| Lugnano in Teverina | 19 | $2,238 | $267.38 | 35% |
| Collevecchio | 12 | $2,213 | $302.16 | 38% |
| Lisciano Niccone | 30 | $2,175 | $384.66 | 35% |
| Palombara Sabina | 16 | $2,160 | $336.01 | 35% |
| Deruta | 15 | $2,127 | $232.83 | 37% |