Villanuova sul Clisi Airbnb Market Analysis 2025: Short Term Rental Data & Vacation Rental Statistics in Lombardy, Italy
Is Airbnb profitable in Villanuova sul Clisi in 2025? Explore comprehensive Airbnb analytics for Villanuova sul Clisi, Lombardy, Italy to uncover income potential. This 2025 STR market report for Villanuova sul Clisi, based on AirROI data from April 2024 to March 2025, reveals key trends in the niche market of 29 active listings.
Whether you're considering an Airbnb investment in Villanuova sul Clisi, optimizing your existing vacation rental, or exploring rental arbitrage opportunities, understanding the Villanuova sul Clisi Airbnb data is crucial. Navigating the high regulation landscape is key to maximizing your short term rental income potential. Let's dive into the specifics.
Key Villanuova sul Clisi Airbnb Performance Metrics Overview
Monthly Airbnb Revenue Variations & Income Potential in Villanuova sul Clisi (2025)
Understanding the monthly revenue variations for Airbnb listings in Villanuova sul Clisi is key to maximizing your short term rental income potential. Seasonality significantly impacts earnings. Our analysis, based on data from the past 12 months, shows that the peak revenue month for STRs in Villanuova sul Clisi is typically July, while February often presents the lowest earnings, highlighting opportunities for strategic pricing adjustments during shoulder and low seasons. Explore the typical Airbnb income in Villanuova sul Clisi across different performance tiers:
- Best-in-class properties (Top 10%) achieve $5,178+ monthly, often utilizing dynamic pricing and superior guest experiences.
- Strong performing properties (Top 25%) earn $2,748 or more, indicating effective management and desirable locations/amenities.
- Typical properties (Median) generate around $1,541 per month, representing the average market performance.
- Entry-level properties (Bottom 25%) see earnings around $766, often with potential for optimization.
Average Monthly Airbnb Earnings Trend in Villanuova sul Clisi
Villanuova sul Clisi Airbnb Occupancy Rate Trends (2025)
Maximize your bookings by understanding the Villanuova sul Clisi STR occupancy trends. Seasonal demand shifts significantly influence how often properties are booked. Typically, Julysees the highest demand (peak season occupancy), while April experiences the lowest (low season). Effective strategies, like adjusting minimum stays or offering promotions, can boost occupancy during slower periods. Here's how different property tiers perform in Villanuova sul Clisi:
- Best-in-class properties (Top 10%) achieve 80%+ occupancy, indicating high desirability and potentially optimized availability.
- Strong performing properties (Top 25%) maintain 61% or higher occupancy, suggesting good market fit and guest satisfaction.
- Typical properties (Median) have an occupancy rate around 37%.
- Entry-level properties (Bottom 25%) average 20% occupancy, potentially facing higher vacancy.
Average Monthly Occupancy Rate Trend in Villanuova sul Clisi
Average Daily Rate (ADR) Airbnb Trends in Villanuova sul Clisi (2025)
Effective short term rental pricing strategy in Villanuova sul Clisi involves understanding monthly ADR fluctuations. The Average Daily Rate (ADR) for Airbnb in Villanuova sul Clisi typically peaks in July and dips lowest during April. Leveraging Airbnb dynamic pricing tools or strategies based on this seasonality can significantly boost revenue. Here's a look at the typical nightly rates achieved:
- Best-in-class properties (Top 10%) command rates of $418+ per night, often due to premium features or locations.
- Strong performing properties (Top 25%) achieve nightly rates of $191 or more.
- Typical properties (Median) charge around $120 per night.
- Entry-level properties (Bottom 25%) earn around $73 per night.
Average Daily Rate (ADR) Trend by Month in Villanuova sul Clisi
Get Live Villanuova sul Clisi Market Intelligence 👇

Explore Real-time Analytics
Airbnb Seasonality Analysis & Trends in Villanuova sul Clisi (2025)
Peak Season (July, August, June)
- Revenue averages $4,156 per month
- Occupancy rates average 59.9%
- Daily rates average $194
Shoulder Season
- Revenue averages $2,077 per month
- Occupancy maintains around 37.7%
- Daily rates hold near $171
Low Season (January, February, December)
- Revenue drops to average $750 per month
- Occupancy decreases to average 39.0%
- Daily rates adjust to average $171
Seasonality Insights for Villanuova sul Clisi
- The Airbnb seasonality in Villanuova sul Clisi shows highly seasonal trends requiring careful strategy. While the sections above show seasonal averages, it's also insightful to look at the extremes:
- During the high season, the absolute peak month showcases Villanuova sul Clisi's highest earning potential, with monthly revenues capable of climbing to $4,907, occupancy reaching a high of 73.4%, and ADRs peaking at $199.
- Conversely, the slowest single month of the year, typically falling within the low season, marks the market's lowest point. In this month, revenue might dip to $729, occupancy could drop to 26.9%, and ADRs may adjust down to $165.
- Understanding both the seasonal averages and these monthly peaks and troughs in revenue, occupancy, and ADR is crucial for maximizing your Airbnb profit potential in Villanuova sul Clisi.
Seasonal Strategies for Maximizing Profit
- Peak Season: Maximize revenue through premium pricing and potentially longer minimum stays. Ensure high availability.
- Low Season: Offer competitive pricing, special promotions (e.g., extended stay discounts), and flexible cancellation policies. Target off-season travelers like remote workers or budget-conscious guests.
- Shoulder Seasons: Implement dynamic pricing that balances peak and low rates. Target weekend travelers or specific events. Offer slightly more flexible terms than peak season.
- Regularly analyze your own performance against these Villanuova sul Clisi seasonality benchmarks and adjust your pricing and availability strategy accordingly.
Best Areas for Airbnb Investment in Villanuova sul Clisi (2025)
Exploring the top neighborhoods for short-term rentals in Villanuova sul Clisi? This section highlights key areas, outlining why they are attractive for hosts and guests, along with notable local attractions. Consider these locations based on your target guest profile and investment strategy.
| Neighborhood / Area | Why Host Here? (Target Guests & Appeal) | Key Attractions & Landmarks |
|---|---|---|
| Historic Center | The heart of Villanuova sul Clisi, known for its charming streets, local shops, and cultural heritage. Ideal for visitors looking to immerse themselves in local history and culture. | Chiesa di San Giovanni Battista, Local artisan shops, Villa Galnica |
| Lakeside Promenade | Scenic area alongside Lake Garda, perfect for outdoor activities and stunning views. Attracts tourists who enjoy nature and recreation. | Lake Garda, Biking and hiking trails, Picnic areas by the lake |
| Cascina Gigi | A secluded area surrounded by nature, offering a peaceful retreat. Popular with travelers seeking tranquility away from busy tourist spots. | Nature walks, Countryside views, Local farms |
| Local Vineyards | Region known for its exquisite wineries and vineyards, attracting wine enthusiasts and tourists keen to explore local wines and cuisine. | Wine tasting tours, Vineyard exploration, Local dining experiences |
| Cultural Spots | Concentrated around various cultural events and festivals which happen throughout the year, making it attractive to visitors seeking authentic experiences. | Cultural festivals, Local gourmet markets, Art exhibitions |
| Rural Escapes | Surrounding countryside ideal for those looking to escape into nature, offering opportunities for hiking, cycling, and relaxing in nature. | Hiking trails, Cycling routes, Beautiful landscapes |
| Family-Friendly Areas | Great options for families, providing spacious accommodations, parks, and family-oriented activities nearby. | Parks and playgrounds, Family entertainment centers, Cultural activities for kids |
| Wellness Retreats | Known for wellness tourism, featuring spas and relaxation centers, attracting those who want to recharge and rejuvenate. | Spas, Wellness centers, Yoga retreats |
Understanding Airbnb License Requirements & STR Laws in Villanuova sul Clisi (2025)
Yes, Villanuova sul Clisi, Lombardy, Italy enforces high STR regulations. Obtaining a license and ensuring compliance is almost certainly required according to current 2025 STR laws. Always verify the latest short term rental regulations and Airbnb license requirements directly with local government authorities for Villanuova sul Clisi to ensure full compliance before hosting.
(Source: AirROI data, 2025, based on 79% licensed listings)
Top Performing Airbnb Properties in Villanuova sul Clisi (2025)
Benchmark your potential! Explore examples of top-performing Airbnb properties in Villanuova sul Clisibased on Trailing Twelve Month (TTM) revenue. Analyze their characteristics, revenue, occupancy rate, and ADR to understand what drives success in this market.
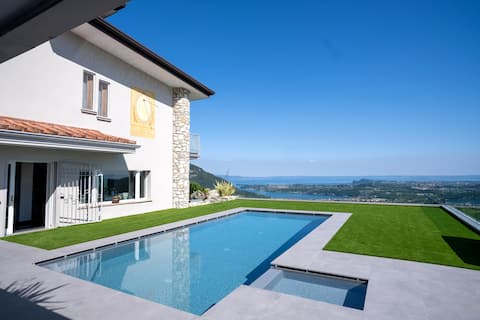
Villa Bellavista private pool - Garda Lake view
Entire Place • 4 bedrooms
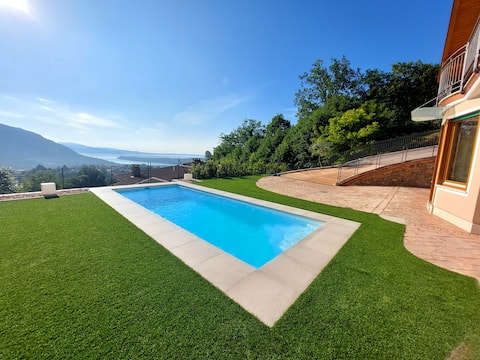
Mgh Luxury - Villa Colombo
Entire Place • 3 bedrooms
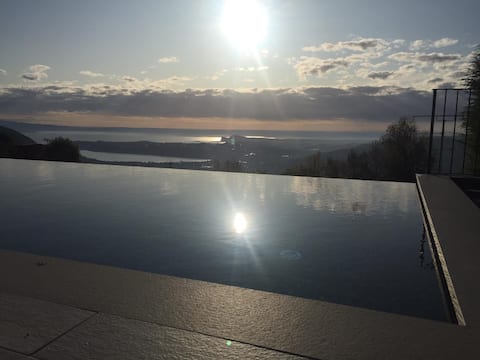
LAKE TERRACE - Garda Lake
Entire Place • 3 bedrooms
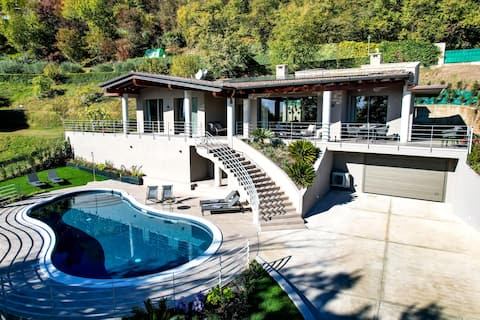
Single villa with private pool and lake view
Entire Place • 4 bedrooms
Holiday flat with pool, superb view & movie room
Entire Place • 2 bedrooms
AMIRO VISTA Private Garden, Pool & Lake Garda View
Entire Place • 2 bedrooms
Note: Performance varies based on location, size, amenities, seasonality, and management quality. Data reflects the past 12 months.
Top Performing Airbnb Hosts in Villanuova sul Clisi (2025)
Learn from the best! This table showcases top-performing Airbnb hosts in Villanuova sul Clisi based on the number of properties managed and estimated total revenue over the past year. Analyze their scale and performance metrics.
| Host Name | Properties | Grossing Revenue | Stay Reviews | Avg Rating |
|---|---|---|---|---|
| Valentina | 5 | $116,061 | 34 | 4.98/5.0 |
| Michela | 3 | $90,490 | 96 | 4.90/5.0 |
| Maria Teresa Olivari | 1 | $89,248 | 50 | 4.96/5.0 |
| My Garda Holiday | 1 | $74,735 | 10 | 4.90/5.0 |
| Anna | 2 | $33,755 | 68 | 4.95/5.0 |
| Christian | 1 | $25,704 | 72 | 4.86/5.0 |
| Lucas | 1 | $23,697 | 10 | 4.40/5.0 |
| Carlo | 1 | $23,691 | 151 | 4.97/5.0 |
| LagoVacanze | 1 | $21,479 | 4 | 4.25/5.0 |
| Host #196867136 | 3 | $19,754 | 269 | 4.80/5.0 |
Analyzing the strategies of top hosts, such as their property selection, pricing, and guest communication, can offer valuable lessons for optimizing your own Airbnb operations in Villanuova sul Clisi.
Dive Deeper: Advanced Villanuova sul Clisi STR Market Data (2025)
Ready to unlock more insights? AirROI provides access to advanced metrics and comprehensive Airbnb data for Villanuova sul Clisi. Explore detailed analytics beyond this report to refine your investment strategy, optimize pricing, and maximize your vacation rental profits.
Explore Advanced MetricsVillanuova sul Clisi Short-Term Rental Market Composition (2025): Property & Room Types
Room Type Distribution
Property Type Distribution
Market Composition Insights for Villanuova sul Clisi
- The Villanuova sul Clisi Airbnb market composition is heavily skewed towards Entire Home/Apt listings, which make up 89.7% of the 29 active rentals. This indicates strong guest preference for privacy and space.
- Looking at the property type distribution in Villanuova sul Clisi, House properties are the most common (51.7%), reflecting the local real estate landscape.
- Houses represent a significant 51.7% portion, catering likely to families or larger groups.
Villanuova sul Clisi Airbnb Room Capacity Analysis (2025): Bedroom Distribution
Distribution of Listings by Number of Bedrooms
Room Capacity Insights for Villanuova sul Clisi
- The dominant room capacity in Villanuova sul Clisi is 2 bedrooms listings, making up 34.5% of the market. This suggests a strong demand for properties suitable for couples or solo travelers.
- Together, 2 bedrooms and 1 bedroom properties represent 69.0% of the active Airbnb listings in Villanuova sul Clisi, indicating a high concentration in these sizes.
- A significant 31.0% of listings offer 3+ bedrooms, catering to larger groups and families seeking more space in Villanuova sul Clisi.
Villanuova sul Clisi Vacation Rental Guest Capacity Trends (2025)
Distribution of Listings by Guest Capacity
Guest Capacity Insights for Villanuova sul Clisi
- The most common guest capacity trend in Villanuova sul Clisi vacation rentals is listings accommodating 6 guests (34.5%). This suggests the primary traveler segment is likely larger groups.
- Properties designed for 6 guests and 4 guests dominate the Villanuova sul Clisi STR market, accounting for 58.6% of listings.
- 48.3% of properties accommodate 6+ guests, serving the market segment for larger families or group travel in Villanuova sul Clisi.
- On average, properties in Villanuova sul Clisi are equipped to host 5.1 guests.
Villanuova sul Clisi Airbnb Booking Patterns (2025): Available vs. Booked Days
Available Days Distribution
Booked Days Distribution
Booking Pattern Insights for Villanuova sul Clisi
- The most common availability pattern in Villanuova sul Clisi falls within the 181-270 days range, representing 44.8% of listings. This suggests many properties have significant open periods on their calendars.
- Approximately 82.7% of listings show high availability (181+ days open annually), indicating potential for increased bookings or specific owner usage patterns.
- For booked days, the 91-180 days range is most frequent in Villanuova sul Clisi (44.8%), reflecting common guest stay durations or potential owner blocking patterns.
- A notable 17.2% of properties secure long booking periods (181+ days booked per year), highlighting successful long-term rental strategies or significant owner usage.
Villanuova sul Clisi Airbnb Minimum Stay Requirements Analysis
Distribution of Listings by Minimum Night Requirement
1 Night
8 listings
30.8% of total
2 Nights
2 listings
7.7% of total
3 Nights
6 listings
23.1% of total
4-6 Nights
7 listings
26.9% of total
30+ Nights
3 listings
11.5% of total
Key Insights
- The most prevalent minimum stay requirement in Villanuova sul Clisi is 1 Night, adopted by 30.8% of listings. This highlights the market's preference for shorter, flexible bookings.
- A significant segment (11.5%) caters to monthly stays (30+ nights) in Villanuova sul Clisi, pointing to opportunities in the extended-stay market.
Recommendations
- Align with the market by considering a 1 Night minimum stay, as 30.8% of Villanuova sul Clisi hosts use this setting.
- Explore offering discounts for stays of 30+ nights to attract the 11.5% of the market seeking extended stays.
- Adjust minimum nights based on seasonality – potentially shorter during low season and longer during peak demand periods in Villanuova sul Clisi.
Villanuova sul Clisi Airbnb Cancellation Policy Trends Analysis (2025)
Super Strict 60 Days
1 listings
3.8% of total
Flexible
6 listings
23.1% of total
Moderate
8 listings
30.8% of total
Strict
11 listings
42.3% of total
Cancellation Policy Insights for Villanuova sul Clisi
- The prevailing Airbnb cancellation policy trend in Villanuova sul Clisi is Strict, used by 42.3% of listings.
- There's a relatively balanced mix between guest-friendly (53.9%) and stricter (42.3%) policies, offering choices for different guest needs.
Recommendations for Hosts
- Consider adopting a Strict policy to align with the 42.3% market standard in Villanuova sul Clisi.
- With 42.3% using Strict terms, this is a viable option in Villanuova sul Clisi, particularly for high-value properties or during peak demand periods.
- Regularly review your cancellation policy against competitors and market demand shifts in Villanuova sul Clisi.
Villanuova sul Clisi STR Booking Lead Time Analysis (2025)
Average Booking Lead Time by Month
Booking Lead Time Insights for Villanuova sul Clisi
- The overall average booking lead time for vacation rentals in Villanuova sul Clisi is 73 days.
- Guests book furthest in advance for stays during July (average 136 days), likely coinciding with peak travel demand or local events.
- The shortest booking windows occur for stays in December (average 20 days), indicating more last-minute travel plans during this time.
- Seasonally, Summer (122 days avg.) sees the longest lead times, while Winter (48 days avg.) has the shortest, reflecting typical travel planning cycles.
Recommendations for Hosts
- Use the overall average lead time (73 days) as a baseline for your pricing and availability strategy in Villanuova sul Clisi.
- For July stays, consider implementing length-of-stay discounts or slightly higher rates for bookings made less than 136 days out to capitalize on advance planning.
- Target marketing efforts for the Summer season well in advance (at least 122 days) to capture early planners.
- Monitor your own booking lead times against these Villanuova sul Clisi averages to identify opportunities for dynamic pricing adjustments.
Popular & Essential Airbnb Amenities in Villanuova sul Clisi (2025)
Amenity Prevalence
Amenity Insights for Villanuova sul Clisi
- Essential amenities in Villanuova sul Clisi that guests expect include: Kitchen, Refrigerator, Hair dryer, Wifi, Dishes and silverware, Heating. Lacking these (any) could significantly impact bookings.
- Popular amenities like TV, Hangers, Essentials are common but not universal. Offering these can provide a competitive edge.
Recommendations for Hosts
- Ensure your listing includes all essential amenities for Villanuova sul Clisi: Kitchen, Refrigerator, Hair dryer, Wifi, Dishes and silverware, Heating.
- Prioritize adding missing essentials: Refrigerator, Hair dryer, Wifi, Dishes and silverware, Heating.
- Consider adding popular differentiators like TV or Hangers to increase appeal.
- Highlight unique or less common amenities you offer (e.g., hot tub, dedicated workspace, EV charger) in your listing description and photos.
- Regularly check competitor amenities in Villanuova sul Clisi to stay competitive.
Villanuova sul Clisi Airbnb Guest Demographics & Profile Analysis (2025)
Guest Profile Summary for Villanuova sul Clisi
- The typical guest profile for Airbnb in Villanuova sul Clisi consists of predominantly international visitors (85%), with top international origins including France, typically belonging to the Post-2000s (Gen Z/Alpha) group (50%), primarily speaking English or German.
- Domestic travelers account for 15.4% of guests.
- Key international markets include Germany (32.1%) and France (16.7%).
- Top languages spoken are English (36.6%) followed by German (18.9%).
- A significant demographic segment is the Post-2000s (Gen Z/Alpha) group, representing 50% of guests.
Recommendations for Hosts
- Focus marketing internationally, particularly towards travelers from France.
- Tailor amenities and listing descriptions to appeal to the dominant Post-2000s (Gen Z/Alpha) demographic (e.g., highlight fast WiFi, smart home features, local guides).
- Highlight unique local experiences or amenities relevant to the primary guest profile.
- Consider seasonal promotions aligned with peak travel times for key origin markets.
Nearby Short-Term Rental Market Comparison
How does the Villanuova sul Clisi Airbnb market stack up against its neighbors? Compare key performance metrics like average monthly revenue, ADR, and occupancy rates in surrounding areas to understand the broader regional STR landscape.
| Market | Active Properties | Monthly Revenue | Daily Rate | Avg. Occupancy |
|---|---|---|---|---|
| Laglio | 64 | $4,873 | $463.61 | 47% |
| Urtijëi - St. Ulrich in Gröden - Ortisei | 163 | $4,698 | $630.45 | 40% |
| Moos in Passeier - Moso in Passiria | 17 | $4,619 | $547.60 | 27% |
| Brenzone sul Garda | 19 | $4,128 | $335.25 | 52% |
| Portofino | 68 | $4,086 | $454.35 | 44% |
| Sala Comacina | 64 | $3,794 | $400.27 | 50% |
| Bellagio | 373 | $3,630 | $328.26 | 55% |
| Oliveto Lario | 99 | $3,509 | $327.42 | 55% |
| Varenna | 216 | $3,419 | $272.27 | 56% |
| Carate Urio | 71 | $3,379 | $331.90 | 44% |